AbstrAct
Introduction Mali and Benin introduced a user fee exemption policy focused on caesarean sections in 2005 and 2009, respectively. The objective of this study is to assess the impact of this policy on service utilisation and neonatal outcomes. We focus specifically on whether the policy differentially impacts women by education level, zone of residence and wealth quintile of the household. Methods We use a difference-in-differences approach using two other western African countries with no fee exemption policies as the comparison group (Cameroon and Nigeria). Data were extracted from Demographic and Health Surveys over four periods between the early 1990s and the early 2000s. We assess the impact of the policy on three outcomes: caesarean delivery, facility-based delivery and neonatal mortality.
results We analyse 99 800 childbirths. The free caesarean policy had a positive impact on caesarean section rates (adjusted OR=1.36 (95% CI 1.11 to 1.66; P≤0.01), particularly in non-educated women (adjusted OR=2.71; 95% CI 1.70 to 4.32; P≤0.001), those living in rural areas (adjusted OR=2.02; 95% CI 1.48 to 2.76; P≤0.001) and women in the middle-class wealth index (adjusted OR=3.88; 95% CI 1.77 to 4.72; P≤0.001). The policy contributes to the increase in the proportion of facility-based delivery (adjusted OR=1.68; 95% CI 1.48 to 1.89; P≤0.001) and may also contribute to the decrease of neonatal mortality (adjusted OR=0.70; 95% CI 0.58 to 0.85; P≤0.001).
conclusion This study is the first to evaluate the impact of a user fee exemption policy focused on caesarean sections on maternal and child health outcomes with robust methods. It provides evidence that eliminating fees for caesareans benefits both women and neonates in sub-Saharan countries.
IntroductIon
The number of maternal deaths across the world has decreased considerably since 1990, dropping from 390 155 to 275 288 in 2015. Almost half of these deaths occurred in sub-Saharan Africa (SSA), where the maternal mortality ratio (MMR) remains high (374.9 per 100 000) compared with the global MMR
(195.7 per 100 000).1 One crucial issue that
allows the reduction of maternal mortality is
access to Emergency Obstetric and Neonatal Care. Approximately 15% of women are confronted with obstetric complications
during their pregnancy,2 3 and between 3.6%
and 6.5% of pregnant women should benefit from caesarean section (CS) delivery at birth
in West Africa.4 The WHO suggests that at
least 5% of pregnant women require a CS
delivery.5
Many women in low-income and middle-in-come countries (LMICs) delay their deci-sion to seek care or give up going to a health facility due to fear of having to pay for
exces-sive expenses.6–8 Household wealth directly
Removing user fees to improve access to
caesarean delivery: a quasi-experimental
evaluation in western Africa
Marion Ravit,1 Martine Audibert,2 Valéry Ridde,3,4 Myriam de Loenzien,1
Clémence Schantz,1 Alexandre Dumont1
To cite: Ravit M, Audibert M, Ridde V, et al. Removing user fees to improve access to caesarean delivery: a quasi-experimental evaluation in western Africa. BMJ Glob Health 2018;3:e000558. doi:10.1136/ bmjgh-2017-000558 Handling editor Seye Abimbola ►Additional material is published online only. To view please visit the journal online (http:// dx. doi. org/ 10. 1136/ bmjgh- 2017- 000558). Received 8 September 2017 Revised 21 November 2017 Accepted 26 November 2017 1Centre Population et Développement (Ceped), IRD, INSERM, Université Paris Descartes, Paris, France 2CNRS, CERDI, Université Clermont Auvergne, Clermont-Ferrand, France
3Institut de Recherche en Santé Publique de Montréal (IRSPUM), Montreal, Quebec, Canada 4Ecole de santé publique de Montréal (ESPUM), Montreal, Quebec, Canada
correspondence to
Marion Ravit, Centre Population et Développement (Ceped), IRD, INSERM Université Paris Descartes Paris France ; marion. ravit@ gmail. com
Key questions
What is already known about this topic?
► Following the implementation of pregnancy-related
fee removal, there has been evidence of increase in access to facility births and, to a much lesser extent, caesarean sections in Ghana, Senegal, Kenya and Burkina Faso.
► Mali and Benin introduced a user fee exemption
policy focused on caesarean sections in 2005 and 2009, respectively; however, no study has evaluated the impact of this policy on service utilisation and neonatal outcomes.
What are the new findings?
► User fee removal policy focused on caesarean
section had a positive impact on caesarean and facility-based delivery and contributes to improvements in neonatal outcomes, especially for less disadvantaged women.
recommendations for policy
► These findings confirm the idea that user fees are
a major barrier preventing access to caesarean sections in low-income countries.
► The level of implementation of the policy is far from
optimal, and the impact of the policy might have been more important if caesarean sections were really free for every woman.
► Exemption policies are a way to improve universal
health coverage.
on June 24, 2021 by guest. Protected by copyright.
http://gh.bmj.com/
influences access to CS.9 The cost of a caesarean episode can be very high, up to 10 times higher than for a normal delivery, and could lead households to catastrophic
expenses.7 10–13 The cost of a CS is also high for the health
system. In 2008, the cost of the global needed CS was
esti-mated to be approximately US$432 million.14
In recent years, the concept of universal health coverage (UHC), which posits that everybody should have access to health services without suffering from
financial issues when paying their fees, has emerged.15 16
In September 2015, the Sustainable Development Goals were adopted by the United Nations, and a part of goal 3
consists of achieving UHC.17 A common goal of different
UHC programme memes around the world is to remove financial barriers such as user fees, particularly for preg-nant women and children, who require priority access to
health services.18 19
User fee exemptions at the point of service are one reform that was implemented in LMICs to remove finan-cial barriers in health services utilisation. Fee removal can concern a targeted intervention, such as CS, or a targeted population, such as pregnant women, depending on the country. Removing user fees for facility-based delivery (FBD) services increased the access to facility births, and to a much lesser extent, to caesarean sections
in Ghana and Burkina Faso.20 One study, however, showed
positive impact on FBD but failed to identify an effect on
caesarean deliveries in Kenya, Ghana and Senegal.21 In
contrast, user fee exemptions focused on CS, called the ‘free caesarean’ policy, only concerns women delivering by CS. In this case, women must pay for all other pregnan-cy-related care. Benin and Mali introduced such a policy in 2005 and 2009, respectively. A study showed that there is no evidence of a supplementary increase of CS rates after the implementation of the exemption policy in these two
countries.22 We found no study assesses the impact of such
reforms on health services utilisation with robust methods, using population data and comparison groups.
Our hypothesis is that this specific reform would increase access to CS and FBD and that this increase in utilisation of maternal health services would have positive repercus-sions on neonatal mortality. Some studies showed that an increase of CS rates, when these rates are below 5%–10%,
could impact substantially neonatal mortality.23
Using long-term population data and a quasi-exper-imental approach, this study aims to assess the impact of a ‘free caesarean’ policy on access to caesarean and FBD and on early neonatal mortality in Mali and Benin. We focused specifically on whether this reform impacts women differentially by education level, zone of residence (rural vs urban) and wealth quintile of the household. dAtA And MetHod
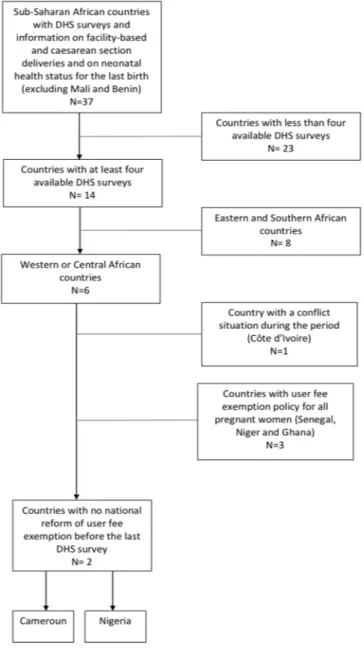
selection of countries
To select comparison countries to evaluate impact of the free caesarean policy in Benin and Mali with a coun-terfactual, we first considered all sub-Saharan countries
with Demographic and Health Surveys (DHS), which contains information on FBDs, CS deliveries and the neonatal health status of women who reported a birth during the last 3 or 5 years before the survey. In addition to Mali and Benin, we selected a total of 37 countries to form this sample. As four DHS surveys are available between the early 1990s and the early 2000s for Mali and Benin, we chose to select the 14 countries with at least four DHS surveys between the same period to use data in a panel manner and to be able to assess the impact of the reform with robust statistical analysis. We then concen-trated on the six western and central African countries to study comparable countries. Among these countries, we excluded Côte d’Ivoire due to the situation of conflict that existed during the period of study, which can
signif-icantly affect the health system.24 Three additional
coun-tries that implemented a pregnancy-related fee exemp-tion not specifically focused on CS were also excluded
(Senegal, Niger and Ghana).25 Two countries did not
experiment with any user fee exemptions for delivery between the first and the last available survey at a national level: Cameroon and Nigeria. These two countries were
used as counterfactuals in our study (see figure 1).
description of intervention
Mali introduced the user fee removal reform on 1 January 2005. This national policy concerns all CS in the public sector and covers the surgical procedure and preopera-tive examinations, the surgical kit and postoperapreopera-tive treat-ment (standardised set of products and medications) and hospitalisation. Structures receive 30 000 FCFA (US$50) for a simple caesarean and 42 000 FCFA (US$70) for a
complicated caesarean, in addition to a surgical kit.26 27
In Benin, the user fee exemption policy was introduced on 1 April 2009 and concerns caesareans in all public and private hospitals that offer emergency obstetric care. Hospitals receive 100 000 FCFA (US$166) per caesarean. The policy covers check-up costs before medical interven-tion, drugs, kits, surgery, blood and hospitalisation for 7
days.22 In these two countries, the state is the principal
financer of the reform.22
It is important to note that the level of implementation of the free caesarean policy in both countries is far from optimal and heterogeneous across countries. In Benin, the amount of the reimbursement is unique for all sites, while the cost of CS depends on the type of healthcare facility. Some authors reported that many pregnant women might have to pay a part of the caesarean fees
not covered by the exemption policy.28 Because of the
lack of official documents on the policy, there is no clear information for managers, health workers or even preg-nant women on the real content of the reform. It induces different interpretation of the free package by health providers and a disappointment for women who have
understood the caesarean was free in the whole country.28
In Malian health facilities, the introduction of free caesarean policy increased workload in public services,
without financial compensation for health workers.29 It
on June 24, 2021 by guest. Protected by copyright.
http://gh.bmj.com/
Figure 1 Flow chart for comparison countries selection. DHS, Demographic and Health Surveys.
puts more pressure on outdated equipment and leads to a deterioration of the quality of care. Furthermore, the standardised kits were often incomplete or sometimes not delivered in healthcare facilities during a long period of time. In a rural area of Mali, 91% of women still paid
for their CS during the period 2008–2011.30
data sources
The four DHS surveys available for the included coun-tries are distributed as follows: (1) Benin: 1996, 2001, 2006 and 2011–2012; (2) Mali: 1995–96, 2001, 2006 and 2012–13; (3) Cameroon: 1991, 1998, 2004 and 2011; and (4) Nigeria: 1990, 2003, 2008 and 2013.
We used data on women aged 15–49 years who spent the night before the interview in the surveyed household and who delivered a live-born child in the 3 years before the survey. If a woman delivered more than one child during this period, we selected the most recent birth only. We
considered only the last birth for a woman to minimise recall bias regarding the history of previous pregnancies.
The DHS surveys are nationally representative house-hold surveys with a large sample size (between 4500 and 38 500 households per survey for the four selected coun-tries over the four periods). Data on household character-istics (demographic, socioeconomic and environmental conditions) and on the last pregnancy, including infor-mation on the use of maternal health services, were extracted from relevant questionnaires. During the inter-view, the woman was asked whether her child was born by CS. As recommended, and for more accuracy, cases of CS among live births that occurred at home were recoded as
vaginal birth deliveries.31 Socioeconomic status was
eval-uated using principal component analysis as a relative wealth index that is based on household conditions and
assets.32 33 We used the household wealth quintile
avail-able in each DHS survey. Measures
We assessed the impact of the caesarean-related fee removal policy on three binary outcomes: CS, FBD and neonatal death (up to 28 days). CS is the primary outcome because we supposed that the policy implementation had a direct positive impact on women’s access to CS.
FBD and neonatal mortality were chosen as secondary outcomes to assess if the policy helped improve access to healthcare facilities and child survival. An FBD was defined as a birth that took place in a public or private healthcare facility (hospital, health centre and clinic). Other births (taxi, car and home) were coded as non-FBD. In the case of FBD, we created a specific variable to study if the birth occurred in a hospital or in another category of health-care facility. Neonatal mortality was defined as an infant death during the first 28 days of life (0–28 days). To assess the outcome of each included birth, we used informa-tion on infant mortality (age at death in days, months or years) reported by the interviewed mothers.
exposure variable
We created a variable denominated ‘free caesarean’ (yes or no) to indicate if the birth occurred in a country that implemented a caesarean-related fee exemption policy (Mali and Benin) or one that did not (Cameroon and Nigeria) over the studied period. We identified four studied periods according to the time of each DHS: period 1 (1990–1996), period 2 (1998–2003), period 3 (2004–2008) and period 4 (2011–2013). We defined two time periods according to the year of implementation of the ‘free caesarean’ policy in Mali and Benin: before and after the policy implementation. Each birth occur-ring after January 2005 in Mali and after April 2009 in Benin corresponds to the period ‘after’. For the control group (women who give birth in a country that did not implement a caesarean-related fee exemption policy), we defined 1 January 2008 as the criteria for the ‘time’ vari-able because the first birth in the last survey for the Came-roon occurred in 2008. We classified each birth occurring
on June 24, 2021 by guest. Protected by copyright.
http://gh.bmj.com/
after January 2008 as ‘after’ for the time variable in the group of country with no free caesarean policy.
statistical analysis
The effect of the policy was assessed as the difference in the change in the primary outcome from the period before to the period after implementation between the two groups
of countries (free or unfree caesarean).34 35 The additional
increase in the risk of having a CS in the free caesarean group, relative to the increase in this risk in the other group, was estimated by the OR with 95% CIs for the inter-action between groups (free and unfree caesarean) and time (before and after) provided by the logistics regression model. The model adjusted for variables selected a priori as potential effect modifiers for CS: zone of residence, maternal age, education level, wealth quintile of house-hold, parity and multiple pregnancies. The model took into account sampling weight, clustering and strata. Secondary binary outcomes, related to either FBD or neonatal deaths, were analysed using the same method as for the primary outcome. We considered two different types of FBD: delivery at referral hospital and delivery at another type of healthcare facility (health post, health centre or private clinic). We supposed that the impact of a free caesarean policy would be more important for delivery at hospital because this is the place where the surgery is performed.
Furthermore, we assessed whether the free caesarean policy effects varied between educated and non-edu-cated women, between those living in an urban and rural context and between household wealth quintiles. The free caesarean policy effects were reported separately for each stratum of the respective variable.
We performed sensitivity analysis by recoding the ‘group’ variable into three categories: Benin, Mali and control countries (Cameroon and Nigeria). The coef-ficient of interaction between group (three categories) and time in the regression model measures the effect of the policy in Benin, on the one hand, and in Mali, on the other hand, compared with the control group.
To use the differences-in-differences method, we made the assumption that changes in the proportion of CS, FBDs and neonatal mortality would not differ between the intervention and control groups without the pres-ence of the policy. We visually checked this assumption by ensuring that trends in the predicted prevalence of the three outcomes, adjusted on variables cited above, are similar for the intervention and control areas before the implementation of the policy.
No imputation of missing data was performed. Tests were two tailed, and P<0.05 was considered statistically significant. We managed the data using SPSS V.20, and analyses were performed using Stata V.13.0.
results
descriptive analysis
The four DHS surveys available for each country allowed us to analyse 99 800 women who delivered a live child in the last 3 years before the interview, 46 362 women in the
‘free caesarean’ policy group and 53 438 women in the ‘no free caesarean’ policy group. The mode of delivery was available for 99.5% of the 99 800 women included (99 324 women), and the place of delivery was reported for 99 476 women (99.7%). There are no missing data for neonatal mortality, as we considered a child to be
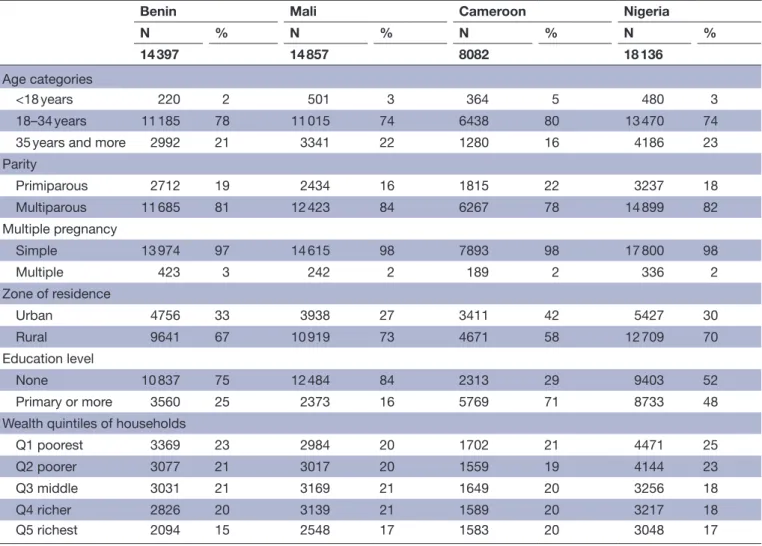
alive if the infant’s mortality was not reported. Table 1
presents the baseline characteristics of these women by country (ie, prior the implementation of intervention). We observed no major differences in these characteristics except for education level. At baseline, women in Benin and Mali are less educated than those of Cameroon and Nigeria.
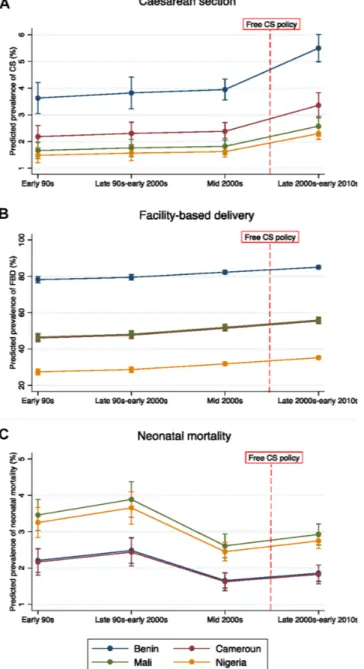
Figure 2A illustrates the trend in the adjusted predicted prevalence of caesarean sections from period 1 to period 4 by each of the studied countries. We do not observe differences in the trend in adjusted predicted preva-lence of caesarean section prior the implementation of the policy in the different countries. Similar patterns can be observed for FBD and neonatal mortality (see
figure 2B,C).
differences-in-differences analysis
After adjusting on covariates (table 2), there was a
signif-icant increase in the rate of CS in countries with a free caesarean policy compared with countries without such a policy, with an adjusted OR of 1.36 (95% CI 1.11 to 1.66; P≤0.01) and an adjusted absolute risk difference of 1.0% (95% CI 0.6% to 1.4%; P≤0.001). Furthermore, the caesarean rates increased significantly more rapidly in free caesarean countries for non-educated women (adjusted OR=2.71; 95% CI 1.70 to 4.32; P≤0.001), for women who live in rural areas (adjusted OR=2.02; 95% CI 1.48 to 2.76; P≤0.001), Q1 wealth index women (adjusted OR=2.02; 95% CI 1.07 to 3.84; P≤0.05) Q3 wealth index women (adjusted OR=3.88; 95% CI to 1.77– 4.72; P≤0.001) and Q4 wealth index women (adjusted OR=1.56; 95% CI 1.05 to 2.33; P≤0.05).
Table 3 shows that FBD rates (adjusted OR=1.68; 95% CI 1.48 to 1.89; P≤0.001) and particularly hospital-based delivery rates (adjusted OR=1.71; 95% CI 1.49 to 1.95; P≤0.001) increased significantly more rapidly in Mali and Benin compared with Cameroon and Nigeria. This posi-tive effect of free caesarean policy on FBD is observed for every subgroup of women (education level, zone of residence and wealth).
As shown in table 4, a free caesarean policy resulted
in a significant decrease in neonatal mortality (adjusted OR=0.70; 95% CI 0.58 to 0.85; P≤0.001), especially in non-educated women (adjusted OR=0.75; 95% CI 0.58 to 0.95; P≤0.05), Q3 wealth index women (adjusted OR=0.55; 95% CI 0.36 to 0.84; P≤0.01) and Q4 wealth index women (adjusted OR=0.59; 95% CI 0.38 to 0.91; P≤0.05).
We observed differential effect of the policy according to the intervention country. We found that the impact of the policy on caesarean rates is significant in Mali (adjusted OR=1.89; 95% CI 1.42 to 2.51; P≤0.001) and
on June 24, 2021 by guest. Protected by copyright.
http://gh.bmj.com/
Table 1 Baseline characteristics of pregnant women* by country
Benin Mali Cameroon Nigeria
N % N % N % N %
14 397 14 857 8082 18 136
Age categories
<18 years 220 2 501 3 364 5 480 3
18–34 years 11 185 78 11 015 74 6438 80 13 470 74
35 years and more 2992 21 3341 22 1280 16 4186 23
Parity Primiparous 2712 19 2434 16 1815 22 3237 18 Multiparous 11 685 81 12 423 84 6267 78 14 899 82 Multiple pregnancy Simple 13 974 97 14 615 98 7893 98 17 800 98 Multiple 423 3 242 2 189 2 336 2 Zone of residence Urban 4756 33 3938 27 3411 42 5427 30 Rural 9641 67 10 919 73 4671 58 12 709 70 Education level None 10 837 75 12 484 84 2313 29 9403 52 Primary or more 3560 25 2373 16 5769 71 8733 48
Wealth quintiles of households
Q1 poorest 3369 23 2984 20 1702 21 4471 25
Q2 poorer 3077 21 3017 20 1559 19 4144 23
Q3 middle 3031 21 3169 21 1649 20 3256 18
Q4 richer 2826 20 3139 21 1589 20 3217 18
Q5 richest 2094 15 2548 17 1583 20 3048 17
*Women who delivered a live-born child in the last 3 years before interview. marginal in Benin (adjusted OR=1.25; 95% CI 0.99 to 1.56; P=0.055).
The impact of the policy was similar in both countries in terms of FBD (adjusted OR for Mali=2.09; 95% CI 1.79 to 2.45; P≤0.001; adjusted OR for Benin=2.67; 95% CI 2.20 to 3.25; P≤0.001) and neonatal mortality (adjusted OR for Mali=0.63; 95% CI 0.51 to 0.78; P≤0.001; adjusted OR for Benin=0.76; 95% CI 0.57 to 0.98; P=0.039). dIscussIon
statement of principal findings
Caesarean delivery was increased by 36% in Benin and Mali after the free caesarean policy was implemented. Non-educated women and those living in rural areas or in the poorest and middle-class households benefited the most from the reforms. Finally, the policy also resulted in a marked increase in facility births and a significant decrease in neonatal mortality, especially in disadvan-taged groups, such as non-educated and rural women.
In this quasi-experimental study, we used counterfac-tual countries (Cameroon and Nigeria) to assess the
impact of free caesarean policies in Benin and Mali.36
This design is recommended to evaluate the effects of
fee exemption policies on maternal and neonatal health
when randomised controlled studies are not possible.37
To our knowledge, this is the first study to assess the impact of a user fee exemption policy focused on CS with a robust method.
Our findings complement other studies of pregnan-cy-related user fee removal policies (but not specifically
for CS) in SSA countries.20 21 37 All of these studies found
an increase in the utilisation of maternal health services after the reform, especially in FBD. However, none of these
authors, except Leone et al,20 found evidence of any positive
effect on caesarean deliveries. The other study that evalu-ated the impact of the exemption policy in Mali and Benin using segmented regression analysis found no effect on CS rates after the implementation of the policy but they did not
use comparison group.22 Our findings demonstrate that a
user-fee removal policy focused on CS had a positive and marked impact on CS. A systematic review reported that the increase of caesarean delivery rates of up to 10% are
asso-ciated with decreased neonatal mortality.38 The different
studies failed to control for concurrent reduction in neonatal mortality, however, reflecting secular trends. Our study showed that the free caesarean policy reduced neonatal
on June 24, 2021 by guest. Protected by copyright.
http://gh.bmj.com/
Figure 2 Trends in adjusted predicted prevalence of caesarean section with 95% confidence interval by period and by country. CS, caesarean section; FBD, facility-based delivery.
mortality by 30%, relative to the simultaneous changes in countries without a user fee removal policy. However, these results should be interpreted with caution because neonatal mortality starts to decrease in the middle of 2000s, before the introduction of the free CS policy in Mali and Benin (see
figure 2A). Using a quasi-experimental design, McKinnon
et al21 also showed a reduction in neonatal mortality by removing user fees for FBD services.
This study found that the abolition of user fees for CS improves access to CS, especially for vulnerable groups, such as non-educated women and those who live in rural areas. We assume that vulnerable pregnant women in Benin and Mali were less afraid of catastrophic expen-ditures when faced by complications after the free caesarean policy was implemented. For this reason, it was easier to make the decision to seek care. Furthermore,
when women needed a CS, the decision was less condi-tioned by the cost of the care and they were more
confi-dent in the system.39 Even if the free policy was not totally
effective, the monetary burden was less important for
women after the reform.40
There are several limitations to this study. First, quasi-ex-perimental methods differ from exquasi-ex-perimental methods in that they are not based on randomised assignment of the intervention. If any other factors are present and affect the difference in trends between the two groups of countries,
the estimation could be invalid or biased.36 To address
this issue, we searched the literature for other major poli-cies and reforms in maternal health occurring during the studied period in each included country (see online supplementary file 1). We could assume that the intro-duction of health insurance schemes in Mali and Nigeria improved pregnant women’s access to the maternal health
services.41 42 In Mali, however, despite the introduction of
health insurance targeted to poor people, approximately 80% of the population did not have medical coverage in
2012.43 In Nigeria, only approximately 3.5% of the
popula-tion was enrolled (5.3 million persons) in 2010.44 In Mali,
a study of rural areas showed that the referral evacuation system had a positive impact on CS rates. This system could partially explain our results through improvements in transportation and in the quality of emergency obstetric
care.45 In Nigeria, the fee exemption policy on maternal
and newborn care concerned 14–36 states and was imple-mented heterogeneously according to the state, but we did not find information on what the exemption covers
or its effectiveness.46 47 Moreover, in the early 2010s, most
primary healthcare facilities are unable to adequately provide basic emergency obstetric care services or meet
the demand for obstetric care.48 We can assume that
these local interventions did not have a major impact on maternal health service utilisation. We assumed that other policies in Benin, Cameroon and Nigeria did not influ-ence our results because they were introduced in 2012 at
the end of our study period.41 49 50 Second, the selection
of comparison countries (Cameroon and Nigeria) can be considered arbitrary. In fact, we chose to exclude countries such as Senegal, Niger and Ghana because they imple-mented a user fee exemption policy that was not particu-larly focused on CS. If we had taken them into account as intervention countries, it is likely that the effect size of the policy would have been underestimated. Furthermore, the choice of timing to classify births as prepolicy or postpo-licy for comparison countries (1 January 2008) can be also considered arbitrary. If we had chosen a different criterion for the time variable, we can suppose that the study results would have been different.
Third, DHS collects information on live births only. Therefore, all stillbirths were omitted in the analyses. The
rate of stillbirths is high in western African countries,51 and
there is evidence that the CS rate and intrapartum stillbirth
rate are correlated.52 In this study, however, we could not
show any impact of the free caesarean policy on stillbirth. Fourth, the period ‘after’ the policy is different between
on June 24, 2021 by guest. Protected by copyright.
http://gh.bmj.com/
Table 2
Ef
fects of ‘fr
ee caesar
ean’ policy on caesar
ean delivery Countries with no ‘fr ee caesar ean’ policy Dif f. Countries with ‘fr ee caesar ean’ policy Dif f. Ef fect of ‘fr ee caesar ean’ policy Befor e After Befor e After
Adjusted absolute risk differ
ence (95% CI)† Adjusted ORs (95% CI)‡ Total All pr egnant women 26 081 27 104 29 037 17 102 CS rate (%) 2.1 2.6 0.5 2.3 3.7 1.4 1.0 (0.6 to 1.4)*** 1.36 (1.11 to 1.66)** W
omen by level of education Educated
14 413 15 878 5884 3728 CS rate (%) 3.1 4.1 1.0 5.5 7.2 1.7 0.6 (−0.4 to 1.6) 0.97 (0.76 to 1.25) Non-educated 11 668 11 226 23 153 13 374 CS rate (%) 0.8 0.5 −0.1 1.4 2.8 1.4 1.5 (1.1 to 1.9)*** 2.71 (1.70 to 4.32)*** W omen by zone of r esidence Urban 8779 9070 8625 5400 CS rate (%) 3.6 5.3 1.7 4.5 6.9 2.4 1.0 (0.0 to 2.0)§ 1.05 (0.81 to 1.38) Rural 17 302 18 034 20 412 11 702 CS rate (%) 1.3 1.3 0.0 1.3 2.3 1.0 1.1 (0.7 to 1.5)*** 2.02 (1.48 to 2.76)*** W
omen by wealth quintiles of households Q1
poor est 6151 6154 6310 3490 CS rate (%) 0.6 0.6 0.0 1.0 2.0 1.0 1.0 (0.4 to 1.6)*** 2.02 (1.07 to 3.84)* Q2 poor er 5675 6342 6051 3580 CS rate (%) 0.9 1.0 0.1 1.5 2.0 0.5 0.7 (0.1 to 1.3)** 1.52 (0.89 to 2.6) Q3 middle 4884 5525 6163 3534 CS rate (%) 1.8 1.8 0.0 1.2 2.8 1.6 1.9 (1.1 to 2.7)*** 2.88 (1.77 to 4.72)*** Q4 richer 4772 4945 5910 3415 CS rate (%) 2.9 3.4 0.5 2.3 4.0 1.7 1.4 (0.4 to 2.4)** 1.56 (1.05 to 2.33)* Q5 richest 4599 4138 4603 3083 CS rate (%) 4.8 8.4 3.6 6.4 8.5 2.1 −0.1 (−1.7 to 1.5) 0.92 (0.68 to 1.24) Sour ce: DHS surveys (http://dhspr ogramme.com/).
*P≤0.05; **P≤0.01; ***P≤0.001. †The adjusted absolute risk dif
fer
ence r
epr
esents adjusted dif
fer
ences between gr
oup-specific changes over time (adjusted on age, education, wealth quintile of household, parity
, multiple
pr
egnancy and took into account sampling weight).
‡The adjusted ORs for the interaction between gr
oups (fr
ee caesar
ean or not) and time (befor
e vs after the implementation of the policy) wer
e estimated using multivariate logistic r
egr
ession
models adjusted on mater
nal age, zone of r
esidence, education, wealth quintile of household, parity and multiple pr
egnancy and took into account sampling weight, clustering and strata.
§Mar
ginal level of significance (0.05 < m < 0.10).
Countries with ‘fr
ee caesar
ean’ policy: Benin
and Mali. Countries with no ‘fr
ee caesar ean’ policy: Camer oon and Nigeria. CS, caesar ean section.
on June 24, 2021 by guest. Protected by copyright.
http://gh.bmj.com/
Table 3
Ef
fects of ‘fr
ee caesar
ean’ policy on facility-based delivery Countries with no ‘fr
ee caesar ean’ policy Dif f. Countries with ‘fr ee caesar ean’ policy Dif f. Ef fect of ‘fr ee caesar ean’ policy Befor e After Befor e After
Adjusted absolute risk differ
ence (95% CI)† Adjusted ORs (95% CI)‡ All pr egnant women 26 129 11 593 29 097 17 088 FBD rate (%) 42.4 42.7 0.3 57.1 66.8 9.7 8.7 (7.7 to 9.7)*** 1.68 (1.48 to 1.89)*** FBD 11 078 11 593 16 607 11 412
Hospital delivery rate (%)
60.5 62.5 2.0 20.4 31.3 10.9 9.7 (8.1 to 11.3)*** 1.71 (1.49 to 1.95)*** W
omen by level of education Educated
14 456 15 946 5895 3725 FBD rate (%) 64.0 63.0 −1.0 82.8 89.2 6.4 5.0 (3.0 to 7.0)*** 1.62 (1.35 to 1.96)*** Non-educated 11 673 11 216 23 202 13 363 FBD rate (%) 15.6 13.8 −1.8 50.5 60.5 10.0 9.2 (7.8 to 10.6)*** 1.59 (1.36 to 1.87)*** W omen by zone of r esidence Urban 8800 9142 8643 5395 FBD rate (%) 67.8 70.0 2.2 79.8 89.3 9.5 6.4 (4.6 to 6.2)*** 2.14 (1.70 to 2.70)*** Rural 17 329 18 020 20 454 11 693 FBD rate (%) 29.5 29.0 −0.5 47.5 56.4 8.9 9.7 (8.3 to 11.1)*** 1.62 (1.40 to 1.87)*** W
omen by wealth quintiles of households
Q1 poor est 6155 6141 6322 3487 FBD rate (%) 15.1 9.2 −5.9 37.2 50.2 13.0 16.8 (14.6 to 19.0) *** 2.94 (2.34 to 3.71)*** Q2 poor er 5681 6338 6061 3577 FBD rate (%) 24.3 26.8 2.5 46.2 56.1 9.9 9.3 (6.9 to 11.7)*** 1.47 (1.21 to 1.78)*** Q3 middle 4896 5530 6173 3532 FBD rate (%) 41.6 46.9 5.3 53.1 60.7 7.6 6.0 (3.3 to 8.7)*** 1.31 (1.09 to 1.59)* Q4 richer 4781 4973 5928 3412 FBD rate (%) 62.0 64.5 2.5 67.9 76.3 8.4 8.2 (5.7 to 10.7)*** 1.66 (1.33 to 2.08)*** Q5 richest 4616 4180 4613 3080 FBD rate (%) 81.7 84.5 2.8 90.1 94.4 4.3 3.3 (1.3 to 5.3)** 2.03 (1.44 to 2.85)*** Sour ce: DHS surveys (http://dhspr ogramme.com/).
*P≤0.05; **P≤0.01; ***P≤0.001. †The adjusted absolute risk dif
fer
ence r
epr
esents adjusted dif
fer
ences between gr
oup-specific changes over time (adjusted on age, education, wealth quintile of household, parity
, multiple
pr
egnancy and took into account sampling weight).
‡The adjusted ORs for the interaction between gr
oups (fr
ee caesar
ean or not) and time (befor
e vs after the implementation of the policy) wer
e estimated using multivariate logistic r
egr
ession
models adjusted on mater
nal age, zone of r
esidence, education, wealth quintile of household, parity
, multiple pr
egnancy and took into account sampling weight, clustering and strata.
§Mar
ginal level of significance (0.05< m < 0.10).
Countries with ‘fr
ee caesar
ean’ policy: Benin
and Mali. Countries with no ‘fr
ee caesar ean’ policy: Camer oon and Nigeria. FBD, facility-based delivery .
on June 24, 2021 by guest. Protected by copyright.
http://gh.bmj.com/
Table 4
Ef
fects of ‘fr
ee caesar
ean’ policy on neonatal mortality
Countries with no ‘fr ee caesar ean’ policy Dif f. Countries with ‘fr ee caesar ean’ policy Dif f. Ef fect of ‘fr ee caesar ean’ policy Befor e After Befor e After
Adjusted absolute risk differ
ence
(95%
CI)†
Adjusted ORs (95%
CI)‡
All live births
26 218 27 220 29 254 17 108
Death per 100 births
2.5 2.8 0.3 2.8 2.3 −0.5 −0.8 (−1.2 to −0.4)*** 0.70 (0.58 to 0.85)***
By level of education of the mother Educated
14 502 15 978 5933 3731
Early neonatal death rate (%)
2.3 2.7 0.4 2.5 2.3 −0.2 −0.7 (−1.5 to 0.1)* 0.72 (0.51 to 1.03) § Non-educated 11 716 11 242 23 321 13 377
Early neonatal death rate (%)
2.7 2.8 0.1 2.9 2.3 −0.6 −0.7 (−1.3 to −0.1)** 0.74 (0.58 to 0.95)* By zone of r
esidence of the mother**
Urban 8838 9159 8694 5404
Early neonatal death rate (%)
2.3 2.5 0.2 2.5 2.2 −0.3 −0.9 (−1.5 to −0.3)** 0.65 (0.46 to 0.92)* Rural 17 380 18 061 20 560 11 704
Early neonatal death rate (%)
2.6 2.9 0.3 3.0 2.3 −0.7 −0.8 (−1.4 to −0.2)** 0.73 (0.58 to 0.91)**
By wealth quintiles of household Q1
poor est 6173 6155 6353 3491
Early neonatal death rate (%)
2.3 2.6 0.3 2.8 2.8 0.0 −0.3 (−1.1 to 0.5) 0.87 (0.60 to 1.26) Q2 poor er 5703 6350 6094 3580
Early neonatal death rate (%)
2.9 2.9 0.0 2.9 2.4 −0.5 −0.6 (−1.6 to 0.4) 0.80 (0.54 to 1.18) Q3 middle 4905 5545 6200 3536
Early neonatal death rate (%)
2.6 2.9 0.3 3.0 1.9 −1.1 −1.4 (−2.0 to −0.8)** 0.55 (0.36 to 0.84)** Q4 richer 4806 4985 5965 3416
Early neonatal death rate (%)
2.4 2.9 −0.5 2.7 2.1 −0.6 −1.1 (−2.1 to −0.1)* 0.59 (0.38 to 0.91)* Q5 richest 4631 4185 4642 3085
Early neonatal death rate (%)
2.1 2.5 0.4 2.5 2.1 −0.4 −0.7 (−1.7 to 0.3) 0.71 (0.43 to 1.16) Sour ce: DHS surveys (http://dhspr ogramme.com/).
*P≤ 0.05; **P≤0.01; ***P≤ 0.001. †The adjusted absolute risk dif
fer
ence r
epr
esents adjusted dif
fer
ences between gr
oup-specific changes over time (adjusted on age, education, wealth quintile of household, parity
, multiple
pr
egnancy and took into account sampling weight).
‡The adjusted ORs for the interaction between gr
oups (fr
ee caesar
ean or not) and time (befor
e vs after the implementation of the policy) wer
e estimated using multivariate logistic r
egr
ession
models adjusted on mater
nal age, zone of r
esidence, education, wealth quintile of household, parity
, multiple pr
egnancy and took into account sampling weight, clustering and strata.
§Mar
ginal level of significance (0.05<m<0.10).
Countries with ‘fr
ee caesar
ean’ policy: Benin
and Mali Countries with no ‘fr
ee caesar
ean’ policy: Camer
oon
and Nigeria.
on June 24, 2021 by guest. Protected by copyright.
http://gh.bmj.com/
both intervention countries: 8 years in Mali and 3 years in Benin. This could partly explain why the impact of the policy on caesarean rates in statistically significant in Mali and marginally significant in Benin. Finally, this impact study did not take into account the level of implementa-tion of the free caesarean policy in both countries. As we mentioned previously, the implementation of the policy is not optimal in Benin and Mali. The impact of the policy might have been more important than that observed if CSs were really free for every woman.
We may wonder whether the user fee removal policy benefits the poorest women, those who could not afford a caesarean intervention before the policy’s introduc-tion. This study showed that the effect on caesarean rates was more important for women in the middle and upper-middle wealth quintiles. Generally, only the poorest and the richest classes are studied, and the subject of the emerging middle classes in western Africa is not yet well developed in the literature. Further research is needed to understand the effect of user fee removal reforms in this subgroup. Further analyses of DHS are also required to examine if the free caesarean policy reduces inequalities
in coverage and health outcomes.16
conclusIon
This study provides evidence that pregnant women’s access to facility-based and caesarean deliveries was improved in countries where free caesarean policies were implemented in the 2000s. It confirms the idea that user fees are one of the barriers preventing access to maternal health services, especially for CS. A free caesarean policy is entirely within the concept of UHC, because it is an effective way to provide CS to women in need. It seems important that the governments of Mali and Benin continue to finance this exemption policy and provide reimbursements, complete kits, a workforce and motivated health workers to health facilities in a timely fashion.
Acknowledgements This study was part of PhD work by MR, supported by the Université Pierre et Marie Curie (UPMC), France, and the Public Health Doctoral Network of the School for Higher Studies in Public Health (EHESP), France. contributors MR and AD designed the study and prepared the first draft of the manuscript. MR performed statistical analyses. All authors contributed to the data interpretation and the revisions of the manuscript and provided approval of the final submission. MR and AD are the guarantors.
Funding MR has a PhD grant from the French School of Public Health (EHESP). VR holds a CIHR-funded Research Chair in Applied Public Health (CPP-137901). competing interests VR has served as a consultant on the issue of user fee abolition to non-governmental organizations in West Africa. VR is a BMJ Global Health associate editor.
Provenance and peer review Not commissioned; externally peer reviewed. data sharing statement No additional data are available.
open Access This is an Open Access article distributed in accordance with the Creative Commons Attribution Non Commercial (CC BY-NC 4.0) license, which permits others to distribute, remix, adapt, build upon this work non-commercially, and license their derivative works on different terms, provided the original work is properly cited and the use is non-commercial. See: http:// creativecommons. org/ licenses/ by- nc/ 4. 0/
© Article author(s) (or their employer(s) unless otherwise stated in the text of the article) 2018. All rights reserved. No commercial use is permitted unless otherwise expressly granted.
RefeRences
1. Kassebaum NJ, Barber RM, Bhutta ZA, et al. Global, regional, and national levels of maternal mortality, 1990–2015: a systematic analysis for the Global Burden of Disease Study 2015. The Lancet
2016;388:1775–812.
2. Ronsmans C, Etard JF, Walraven G, et al. Maternal mortality and access to obstetric services in West Africa. Trop Med Int Health
2003;8:940–8.
3. Storeng KT, Baggaley RF, Ganaba R, et al. Paying the price: the cost and consequences of emergency obstetric care in Burkina Faso.
Soc Sci Med 2008;66:545–57.
4. Dumont A, de Bernis L, Bouvier-Colle MH, et al. Caesarean section rate for maternal indication in sub-Saharan Africa: a systematic review. Lancet 2001;358:1328–33.
5. Bailey P, Lobis S, Maine D, et al. Monitoring emergency obstetric
care: a handbook: World Health Organization, 2009.
6. Borghi J, Hanson K, Acquah CA, et al. Costs of near-miss obstetric complications for women and their families in Benin and Ghana.
Health Policy Plan 2003;18:383–90.
7. Borghi J, Ensor T, Neupane BD, et al. Financial implications of skilled attendance at delivery in Nepal. Trop Med Int Health
2006;11:228–37.
8. Skordis-Worrall J, Pace N, Bapat U, et al. Maternal and neonatal health expenditure in Mumbai slums (India): a cross sectional study.
BMC Public Health 2011;11:1.
9. Richard F, Witter S, de Brouwere V. Innovative approaches to reducing financial barriers to obstetric care in low-income countries.
Am J Public Health 2010;100:1845–52.
10. Kowalewski M, Mujinja P, Jahn A. Can mothers afford maternal health care costs? User costs of maternity services in rural Tanzania.
Afr J Reprod Health 2002;6:65.
11. Renaudin P, Prual A, Vangeenderhuysen C, et al. Ensuring financial access to emergency obstetric care: three years of experience with Obstetric Risk Insurance in Nouakchott, Mauritania. Int J Gynaecol Obstet 2007;99:183–90.
12. Quayyum Z, Nadjib M, Ensor T, et al. Expenditure on obstetric care and the protective effect of insurance on the poor: lessons from two Indonesian districts. Health Policy Plan 2010;25:237–47.
13. Arsenault C, Fournier P, Philibert A, et al. Emergency obstetric care in Mali: catastrophic spending and its impoverishing effects on households. Bull World Health Organ 2013;91:207–16. 14. Gibbons L, Belizán JM, Lauer JA, et al. The global numbers and
costs of additionally needed and unnecessary caesarean sections performed per year: overuse as a barrier to universal coverage.
World Health Rep 2010;30:1–31.
15. Sachs JD. Achieving universal health coverage in low-income settings. Lancet 2012;380:944–7.
16. World Health Organization,. Health systems financing: the path to
universal coverage. Geneva, 2010.
17. United Nations Publications. Sustainable development goals report
2016. UN, 2016. https:// books. google. fr/ books? id= rudVvgAACAAJ
18. Quick J, Jay J, Langer A. Improving women’s health through universal health coverage. PLoS Med 2014;11:e1001580. 19. Yates R. Universal health care and the removal of user fees. Lancet
2009;373:2078–81.
20. Leone T, Cetorelli V, Neal S, et al. Financial accessibility and user fee reforms for maternal healthcare in five sub-Saharan countries: a quasi-experimental analysis. BMJ Open 2016;6:e009692.
21. McKinnon B, Harper S, Kaufman JS, et al. Removing user fees for facility-based delivery services: a difference-in-differences evaluation from ten sub-Saharan African countries. Health Policy Plan 2015;30:432–41.
22. Witter S, Boukhalfa C, Cresswell JA, et al. Cost and impact of policies to remove and reduce fees for obstetric care in Benin, Burkina Faso, Mali and Morocco. Int J Equity Health 2016;15:123.
23. Ye J, Zhang J, Mikolajczyk R, et al. Association between rates of caesarean section and maternal and neonatal mortality in the 21st century: a worldwide population-based ecological study with longitudinal data. BJOG 2016;123:745–53.
24. Betsi NA, Koudou BG, Cissé G, et al. Effect of an armed conflict on human resources and health systems in Côte d'Ivoire: prevention of and care for people with HIV/AIDS. AIDS Care 2006;18:356–65.
on June 24, 2021 by guest. Protected by copyright.
http://gh.bmj.com/
25. Richard F, Antony M, Witter S, et al. Fee exemption for maternal care in sub-Saharan Africa: a review of 11 countries and lessons for the region. Glob Health Gov 2013;6:52–72.
26. El-Khoury M, Gandaho T, Arur A, et al. Improving access to life saving maternal health services: the effects of removing user fees for caesareans in mali. Health Syst 2011:20:20.
27. Ministère de la Santé du Mali. Décret n° 05 – 350/P-RM du 04 août 2005 - Relatif à la prise en charge gratuité de la césarienne. 2005. http:// mail. cnom. sante. gov. ml/ index. php? option= com_ content& task= view& id= 406& Itemid= 87 (accessed 7 Apr 2017).
28. Centre de Recherche en Reproduction Humaine et en Démographie.
Rapport de synthèse: l’évaluation de la politique de gratuité de la césarienne dans cinq zones sanitaires. Bénin: FEMHealth, 2014.
http://www. abdn. ac. uk/ femhealth/ documents/ Deliverables/ Rapport_ FP7_ Sourou_ Benin_ 310314_ without_ table_ 17_ 2. pdf (accessed 12 Apr 2017).
29. Touré L. User fee exemption policies in Mali: sustainability
jeopardized by the malfunctioning of the health system. BMC Health Serv Res 2015;15(Suppl 3):S8.
30. Ravit M, Philibert A, Tourigny C, et al. The hidden costs of a free caesarean section policy in west africa (kayes region, mali). Matern Child Health J 2015;19:1734–43.
31. Holtz SA, Stanton CK. Assessing the quality of cesarean birth data in the demographic and health surveys. Stud Fam Plann
2007;38:47–54.
32. Rutstein SO, Johnson K. The DHS wealth index. DHS comparative
reports no. 6: Calverton ORC Macro, 2004.
33. Sahn DE, Stifel DC. Poverty comparisons over time and across countries in Africa. World Dev 2000;28:2123–55.
34. Angrist JD, Pischke J-S. Mostly harmless econometrics: an empiricist’s companion. Princeton university press 2008.
35. Liu X, Yan H, Wang D. The evaluation of "Safe Motherhood" program on maternal care utilization in rural western China: a difference in difference approach. BMC Public Health 2010;10:566.
36. Gertler PJ, Martinez S, Premand P, et al. Impact evaluation in
practice. 2nd edn: World Bank Publications, 2016.
37. Dzakpasu S, Powell-Jackson T, Campbell OM. Impact of user fees on maternal health service utilization and related health
outcomes: a systematic review. Health Policy Plan 2014;29:137–50.
38. Betran AP, Torloni MR, Zhang J, et al. What is the optimal rate of caesarean section at population level? A systematic review of ecologic studies. Reprod Health 2015;12:1.
39. Robert E, Samb OM, Marchal B, et al. Building a middle-range theory of free public healthcare seeking in sub-Saharan Africa: a realist review. Health Policy Plan 2017;32:1002–14.
40. Mongbo V, Godin I, Mahieu C, et al. La césarienne dans le contexte de gratuité au Bénin. Sante Publique 2016;28:399–407.
41. Cirillo C, Tebaldi R. Social Protection in Africa: inventory of
non-contributory programmes: International Policy Centre for Inclusive
Growth, United Nations Development Programme, 2016.
42. NHIS. National Health Insurance Scheme. https://www. nhis. gov. ng/ (accessed 30 Mar 2017).
43. République du Mali. Rapport national sur le développement humain
durable. 2012 edn: Protection Sociale et Développement Humain au
Mali, 2012.
44. Mohammed S, Babale M, Dong H, et al. Assessing the
implementation of social health insurance in Nigeria: where are the missing links? Trop Med Int Health 2011;16:344.
45. Fournier P, Dumont A, Tourigny C, et al. The free caesareans policy in low-income settings: an interrupted time series analysis in Mali (2003-2012). PLoS One 2014;9:e105130.
46. Okonofua F, Lambo E, Okeibunor J, et al. Advocacy for free maternal and child health care in Nigeria--results and outcomes. Health Policy
2011;99:131–8.
47. Kana MA, Doctor HV, Peleteiro B, et al. Maternal and child health interventions in Nigeria: a systematic review of published studies from 1990 to 2014. BMC Public Health 2015;15:334.
48. Erim DO, Resch SC, Goldie SJ. Assessing health and economic outcomes of interventions to reduce pregnancy-related mortality in Nigeria. BMC Public Health 2012;12:786.
49. Antony M, Bertone MP, Barthes O. Exploring implementation practices in results-based financing: the case of the verification in Benin. BMC Health Serv Res 2017;17:204.
50. Flink IJ, Ziebe R, Vagaï D, et al. Targeting the poorest in a performance-based financing programme in northern Cameroon.
Health Policy Plan 2016;31:767–76.
51. Lawn JE, Lee ACC, Kinney M, et al. Two million intrapartum-related stillbirths and neonatal deaths: where, why, and what can be done?
Int J Gynecol Obstet 2009;107:S5–19.
52. Goldenberg RL, McClure EM, Bann CM. The relationship of intrapartum and antepartum stillbirth rates to measures of obstetric care in developed and developing countries. Acta Obstet Gynecol Scand 2007;86:1303–9.
on June 24, 2021 by guest. Protected by copyright.
http://gh.bmj.com/