Normal Values of Blood Pressure
Self-Measurement in View of the 1999 World
Health Organization-International Society of
Hypertension Guidelines
B. Weisser, T. Mengden, R. Du¨sing, H. Vetter, and W. Vetter
New guidelines for the management of
hypertension have been published in 1999 by the World Health Organization (WHO) and the International Society of Hypertension (ISH). The WHO/ISH Committee has adopted in principle the definition and classification of hypertension provided by the JNC VI (1997). The new classification defines a blood pressure of 120/80 mm Hg as optimal and of 130/85 mm Hg as the limit between normal and high-normal blood pressure. It is unclear which self-measured home blood pressure values correspond to these office blood pressure limits.
In this study we reevaluated data from our Du¨bendorf study to determine self-measured blood pressure values corresponding to optimal and normal office blood pressure using the percentiles
of the (office and home) blood pressure
distributions of 503 individuals (age, 20 to 90 years; mean age, 46.5 years; 265 men, 238 women). Self-measured blood pressure values corresponding to office values of 130/85 mm Hg and 120/80 mm Hg were 124.1/79.9 mm Hg and 114.3/75.1 mm Hg. Thus, we propose 125/80 mm Hg as a home blood pressure corresponding to an office blood pressure of 130/85 mm Hg (WHO 1999: normal) and 115/75 mm Hg corresponding to 120/80 mm Hg (optimal). Am J Hypertens 2000;13:940 –943 © 2000 American Journal of Hypertension, Ltd.
KEY WORDS: World Health Organization,
International Society of Hypertension, guidelines, self-measured blood pressure.
S
elf-measurement provides valuable infor-mation on the long-term control of blood pressure1–3 and increases the reproducibil-ity and precision of blood pressure mea-surement.4 However, definitions for high blood pressure are generally based on casual, office bloodpressure values. Until recently, most of the epide-miologic and pharmacologic studies have used only casual blood pressure measurement. Various influ-ences that limit the accuracy and validity of casual (office) blood pressure measurement are well docu-mented.5 One of the problems of blood pressure self-measurement is that there is no universally agreed-upon upper limit of normal self-measured home blood pressure. Several studies have adressed this problem in the past. In the population-based Du¨bendorf study6 we have proposed 133/86 mm Hg as the upper limit of normal self-measured blood pressure, corresponding to the 140/90 mm Hg cutoff limit for casual blood pressure using
Received August 9, 1999. Accepted January 13, 2000.
From the Medizinische Poliklinik Universita¨t Bonn, Bonn, Ger-many; and Universita¨tsspital Zu¨rich, Medizinsche Poliklinik, Zu¨-rich, Switzerland.
Address correspondence and reprint requests to B. Weisser, Medizinische Poliklinik Universita¨t Bonn, Wilhelmstrasse 35-37, D-53111 Bonn, Germany.
AJH 2000;13:940 –943
© 2000 by the American Journal of Hypertension, Ltd. 0895-7061/00/$20.00
percentiles of the distributions of self-measured and casual blood pressure. Other groups have obtained similar data to our original Du¨bendorf study con-cerning the normal values of self-measurement, in-dicating that using percentiles for determination of normative values might be an appropriate method.7 We agree with the statement in the JNC VI 1997 publication that self-measured blood pressure “val-ues of 135/85 mm Hg or greater should be consid-ered elevated,” provided that 140/90 mm Hg is the definition of hypertension using office blood pres-sure.8 Therefore, most of the international societies of hypertension have until now used 135/85 mm Hg as the upper limit of normal for self-measured blood pressure.
In the contrast, the 1999 WHO/ISH guidelines propose 125/80 mm Hg as home blood pressure corresponding to an office blood pressure of 140/90 mm Hg.9We disagree with this proposal, which is in contrast with our original Du¨bendorf data and with the JNC VI recommendations. The difference might be explained by the fact that this proposal is based on a single study using only two measure-ments on the same day an ambulatory blood pres-sure recording was performed.10 We believe that only the average of home blood pressures obtained in the morning and in the evening for at least 7 days (better would be 14 days) might serve as a reference value.
In the 1999 World Health Organization/Interna-tional Society of Hypertension Guidelines, an office blood pressure less than 130/85 mm Hg is defined as normal (130 to 139/85 to 89 mm Hg⫽ “high normal”) and a blood pressure less than 120/80 mm Hg is defined as optimal with respect to cardiovascular risk.9 It is unclear how these newly defined office limits can be compared to self-measured blood pres-sure values.
MATERIALS AND METHODS
In this analysis, we have attempted to determine the self-measured blood pressure values corresponding to these cutoff points of office blood pressure by using percentiles of the distributions of self-measured and casual blood pressure from our Du¨bendorf database. In the Du¨bendorf study, 503 individuals were studied (age, 20 to 90 years; mean age, 46.5 years; 265 men, 238 women). The subjects were not preselected according to their blood pressure levels. Only patients taking antihypertensive drugs were excluded.
Office blood pressure was measured twice in the sitting position after a rest of at least 5 min before and after a 2-week period of home blood pressure mea-surement. The patients were instructed on the tech-nique of blood pressure self-measurement during the first visit. Oscillometric semiautomatic devices (OM 1,
Boehringer Mannheim, Switzerland) were used both for office and home blood pressure determination. The subjects were instructed to measure blood pressure at home once in the morning and once in the evening over a period of 14 days. They were instructed to write down the measurements and to report them during their second office visit (a mean of 26.7 measurements was obtained). The means of the first and second visit (two measurements per visit) were compared with the means of self-measured home blood pressure by paired two sided t test and values are given as means⫾ standard deviation.
RESULTS
Mean office blood pressure (130.0⫾ 16.5/82.1 ⫾ 11.1 mm Hg) was significantly (P⬍ .01) higher than mean self-measured blood pressure (123.1 ⫾ 14.6/77.6 ⫾ 10.7 mm Hg). There was no significant difference be-tween the first and second visit. Mean office blood pressure was 129.8⫾ 17.6/82.5 ⫾ 12.2 mm Hg (first visit) and 130.2 ⫾ 18.0/81.7 ⫾ 11.9 mm Hg (second visit). However, the correlation coefficients between the values were lower than those for the comparison between morning and evening self-measured blood pressures. This difference indicates that there was less variation in self-measured blood pressure compared with office blood pressure.
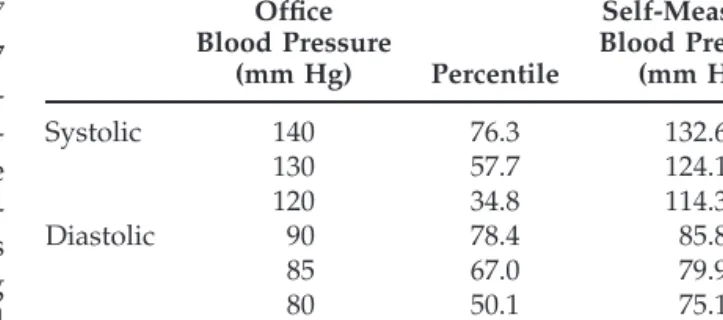
The percentiles of an office blood pressure of 130/85 mm Hg and 120/80 mm Hg were determined and the self-measured blood pressure values at these percen-tiles were calculated. The results are shown in Table 1 and are compared with our original results (office values, 140/90 mm Hg).
Thus, the corresponding self-measured blood pres-sure to the recently defined upper limit of normality (130/85 mm Hg) was 124.1/79.9 mm Hg and optimal office blood pressure corresponds to a home blood pressure of 114.3/75.1 mm Hg.
TABLE 1. PERCENTILES OF THE DISTRIBUTION OF OFFICE BLOOD PRESSURE AT 120/80 MM HG,
130/85 MM HG, AND 140/90 MM HG AND THE CORRESPONDING SELF-MEASURED BLOOD
PRESSURE VALUES Office Blood Pressure (mm Hg) Percentile Self-Measured Blood Pressure (mm Hg) Systolic 140 76.3 132.6 130 57.7 124.1 120 34.8 114.3 Diastolic 90 78.4 85.8 85 67.0 79.9 80 50.1 75.1
DISCUSSION
The objective of identifying normal values is to define blood pressure values associated with an increased cardiovascular morbidity and mortality. The predic-tive value of blood pressure self-measurement seems to be superior to office blood pressure.11
In the present study, the self-measured blood pres-sure values were written down by the subjects. We have recently shown an observer bias in the individual patient reporting self-measured blood pressure val-ues.12This bias can be reduced by using devices such
as the Omron IC to record all measurements; it was not available at the time of the present study. How-ever, we have also demonstrated that observer bias did not substantially affect group comparisons,12and we are confident that we have obtained valid data in the present study.
During the last decades, large and prospective stud-ies in untreated subjects have contributed to the defi-nition of normal office blood pressure values by show-ing that blood pressure values greater than 140/90 mm Hg are associated with increased cardiovascular morbidity and mortality. It will be very difficult to conduct such large studies investigating the prognos-tic significance of self-measured blood pressure in un-treated subjects.
A more acceptable method is to determine the percentile of the distribution of office blood pres-sures at 140/90 mm Hg. The corresponding blood pressure level at the same percentile of the distribu-tion of self-measured values might serve as a refer-ence value for an upper limit of normality. Other methods have been used for the determination of normal home blood pressure values. Mean blood pressure ⫾ one or two standard variations or the 95th percentile in normotensive subjects have been proposed as upper limits, although these values are arbitrary cutoff points. In addition, regression anal-ysis has produced values similar to the results of the so-called “percentile-correspondence” method used in this analysis. We think that every method can be criticized for some reason, but our original data from Du¨bendorf are in very good accordance with reference values for home blood pressure based on the only prognostic study available.11
For the definition of normal values it is not suffi-cient to introduce the mean differences between self- and office measurement as a correcting factor, as the office-home difference increases with higher levels of blood pressure.13 In addition to the com-parison of office and home blood pressure, another important conclusion might be drawn from the data shown in Table 1. At an office blood pressure of 140/90 mm Hg, the percentiles for systolic and di-astolic pressures are very similar (76.3% and 78.4%).
However, using the lower blood pressure levels of 130/85 and 120/80 mm Hg the percentiles for the systolic blood pressure decrease more than those obtained for diastolic blood pressure. The optimal blood pressure corresponds to percentiles of 34.8% (distribution of systolic blood pressure) and 50.1% (distribution of diastolic blood pressure). Thus, the new cutoff values might be more ambitious with respect to the systolic blood pressure as compared to diastolic blood pressure.
In conclusion, if an upper limit of 130/85 mm Hg for the normal office blood pressure is accepted, as suggested by the guidelines of the WHO and ISH (1999), we propose, for practical reasons, 125/80 mm Hg as the corresponding self-measured blood pressure.
REFERENCES
1. Kleinert HD, Harshfield GA, Pickering TG, Devereux RB, Sullivan PA, Marion RM, Mallory WK, Laragh JH: What is the value of home blood pressure in patients with mild hypertension? Hypertension 1984;6:574 –578. 2. Pickering T: Recommendations for the use of home (self) and ambulatory blood pressure monitoring. Am J Hypertens 1996;9:1–11.
3. Mengden T, Schwartzkopff B, Strauer BE: What is the value of home (self) blood pressure monitoring in pa-tients with hypertensive heart disease? Am J Hypertens 1998;11:813– 819.
4. Mengden T, Ba¨ttig B, Vetter W: Self-measurement of blood pressure improves the accuracy and reduces the number of subjects in clinical trials. J Hypertens 1991;9 (suppl 6):336 –337.
5. Mancia G, Bertinieri G, Parati G, Pomidossi G, Ferrari A, Gregorini L, Zanchetti A: Effects of blood pressure measurement by the doctor on patients’ blood pressure and heart rate. Lancet 1983;ii:695– 698.
6. Weisser B, Gru¨ne S, Burger R, Blickensdorfer H, Iseli J, Michelsen SH, Opravil R, Rageth S, Sturzenegger ER, Walker P, Widmer W, Vetter W: The Du¨bendorf study: a population-based investigation on normal values of blood pressure self-measurement. J Hum Hypertension 1994;8:227–231.
7. Mejia AD, Julius S, Jones KA, Schork NJ, Kneisley J: The Tecumseh Blood Pressure Study. Normative data on blood pressure self-determination. Arch Intern Med 1990;150:1209 –1213.
8. The Joint National Committee on Prevention, Detec-tion, EvaluaDetec-tion, and Treatment of High Blood Pres-sure: The Sixth Report National High Blood Pressure Education Program, National, Lung, and Blood Insti-tute, National Institutes of Health. Arch Intern Med 1997;157(21):2413–2446.
9. Guidelines Subcommittee: 1999 World Health Organi-zation-International Society of Hypertension guide-lines for the management of hypertension. J Hypertens 1999;17:151–184.
10. Mancia G, Sega R, Bravi D, De Vito G, Valagussa F, Cesena G, Zanchetti A: Ambulatory blood pressure
AJH–AUGUST 2000 –VOL. 13, NO. 8
normality: results from the PAMELA study. J Hyper-tens 1995;13:1377–1390.
11. Kubo T, Imai Y, Tsuji I, Nagai K, Kato J, Kikuchi N, Nishiyama A, Aihara A, Sekino M, Kikuya M, Ito S, Satoh H, Hisamichi S: Home blood pressure measure-ment has a stronger predictive power for mortality than does screening blood pressure: a population-based observation in Ohasama, Japan. J Hypertens 1998;16:971–975.
12. Mengden T, Hernandez Medina RM, Beltran B, Alvarez E, Kraft K, Vetter H: Reliability of reporting self-mea-sured blood pressure values by hypertensive patients. Am J Hypertens 1998;11:1413–1417.
13. Mengden T, Ba¨ttig B, Edmonds D, Jeck T, Huss R, Sachinidis A, Schubert M, Feltkamp H, Vetter W: Self-measured blood pressure at home and during consult-ing hours: are there any differences? J Hypertens 1990;8 (suppl 3):15–19.