HAL Id: hal-00318075
https://hal.archives-ouvertes.fr/hal-00318075
Submitted on 21 Dec 2005
HAL is a multi-disciplinary open access
archive for the deposit and dissemination of
sci-entific research documents, whether they are
pub-lished or not. The documents may come from
teaching and research institutions in France or
abroad, or from public or private research centers.
L’archive ouverte pluridisciplinaire HAL, est
destinée au dépôt et à la diffusion de documents
scientifiques de niveau recherche, publiés ou non,
émanant des établissements d’enseignement et de
recherche français ou étrangers, des laboratoires
publics ou privés.
substorm cycles: II. Generation of poleward-moving
events and polar cap patches by pulses in the
magnetopause reconnection rate
M. Lockwood, J. A. Davies, J. Moen, A. P. van Eyken, K. Oksavik, I. W.
Mccrea, M. Lester
To cite this version:
M. Lockwood, J. A. Davies, J. Moen, A. P. van Eyken, K. Oksavik, et al.. Motion of the dayside polar
cap boundary during substorm cycles: II. Generation of poleward-moving events and polar cap patches
by pulses in the magnetopause reconnection rate. Annales Geophysicae, European Geosciences Union,
2005, 23 (11), pp.3513-3532. �hal-00318075�
SRef-ID: 1432-0576/ag/2005-23-3513 © European Geosciences Union 2005
Annales
Geophysicae
Motion of the dayside polar cap boundary during substorm cycles:
II. Generation of poleward-moving events and polar cap patches by
pulses in the magnetopause reconnection rate
M. Lockwood1,*, J. A. Davies1, J. Moen2,**, A. P. van Eyken3, K. Oksavik2,***, I. W. McCrea1, and M. Lester4
1Rutherford Appleton Laboratory, Chilton, Didcot, Oxon OX11 0QX, UK
2Department of Physics, University of Oslo, P.O. Box 1048 Blindern, N-0316 Oslo, Norway
3EISCAT Headquarters, Kiruna, Sweden
4Department of Physics and Astronomy, University of Leicester, Leicester, UK
*also at: Department of Physics and Astronomy, Southampton University, Southampton, Hampshire, UK
**also at: Arctic Geophysics, University Centre on Svalbard, N-9170 Longyearbyen, Norway
***also at: Johns Hopkins University, Applied Physics Laboratory, Laurel, MD, USA
Received: 11 July 2003 – Revised: 12 October 2005 – Accepted: 20 October 2005 – Published: 21 December 2005
Abstract. Using data from the EISCAT (European
Incoher-ent Scatter) VHF and CUTLASS (Co-operative UK Twin-Located Auroral Sounding System) HF radars, we study the formation of ionospheric polar cap patches and their re-lationship to the magnetopause reconnection pulses identi-fied in the companion paper by Lockwood et al. (2005). It is shown that the poleward-moving, high-concentration plasma patches observed in the ionosphere by EISCAT on 23 November 1999, as reported by Davies et al. (2002), were often associated with corresponding reconnection rate pulses. However, not all such pulses generated a patch and only within a limited MLT range (11:00–12:00 MLT) did a patch result from a reconnection pulse. Three proposed mechanisms for the production of patches, and of the con-centration minima that separate them, are analysed and eval-uated: (1) concentration enhancement within the patches by cusp/cleft precipitation; (2) plasma depletion in the minima between the patches by fast plasma flows; and (3) intermit-tent injection of photoionisation-enhanced plasma into the polar cap. We devise a test to distinguish between the ef-fects of these mechanisms. Some of the events repeat too frequently to apply the test. Others have sufficiently long repeat periods and mechanism (3) is shown to be the only explanation of three of the longer-lived patches seen on this day. However, effect (2) also appears to contribute to some events. We conclude that plasma concentration gradients on the edges of the larger patches arise mainly from local time variations in the subauroral plasma, via the mechanism pro-posed by Lockwood et al. (2000).
Keywords. Ionosphere (Polar ionosphere) –
Magneto-spheric physics (Magnetopause, cusp and boundary layers; Storms and substorms)
Correspondence to: M. Lockwood (m.lockwood@rl.ac.uk)
1 Introduction
In a companion paper, hereafter referred to as Paper I, Lockwood et al. (2005) studied motions of the open-closed field line boundary (OCB) during two substorm cycles on 23 November 1999. From detailed analysis of the flows ob-served by the EISCAT (European Incoherent Scatter) VHF radar, the reconnection rate was shown to be pulsed when the IMF was steadily southward and EISCAT was within the inferred merging gap (the ionospheric footprint of the magnetopause reconnection X-line). From both the EISCAT data and the DMSP (Defense Meteorological Satellite Pro-gram) spacecraft passes, Lockwood et al. (2005) found the merging gap extent to be of order 09:30–15:30 MLT (which EISCAT beam 1 observed in the interval 06:45–12:45 UT). Davies et al. (2002) reported that poleward-moving plasma concentration enhancements (polar cap “patches”) were seen by the EISCAT VHF radar on this day and associated them with regions of enhanced HF backscatter, observed using the CUTLASS (Co-operative UK Twin-Located Auroral Sound-ing System) HF radar at Hankasalmi. In the present paper, we analyse the association of the reconnection rate pulses with the formation of the patches and investigate the mecha-nism by which the patches are formed.
1.1 Polar cap patches
Ionospheric plasma concentration enhancements have been observed moving in an antisunward direction throughout the
polar cap. They are seen moving poleward into the
po-lar cap on the dayside (Foster and Doupnik, 1984; Foster, 1989; Lockwood and Carlson, 1992; Lockwood et al., 2001; Opgenoorth et al., 2001; Carlson et al., 2002, 2004), mov-ing across the central polar cap (Weber et al.,1984; Anderson et al., 1988; Sojka et al., 1993, 1994; McEwen and Harris,
1996; Pedersen, 2000), and emerging from the polar cap into the nightside auroral oval (Lockwood and Carlson, 1992). In many studies, patches have been associated with regions of enhanced HF radar backscatter and so linked with the poleward-moving events seen by these radars (Rodger et al., 1994a, b; Milan et al., 2000; Davies et al., 2002).
The mechanisms responsible for the formation of polar cap patches have been a matter of considerable debate. An as-sociation between patches and transient reconnection pulses has been suggested by a number of recent studies (McCrea et al., 2000; Lockwood et al., 2000, 2001; Opgenoorth et al., 2001; Moen et al., 2001). Other studies suggest patches are linked to other phenomena, such as travelling convection vortices (Valladares et al., 1994, 1999).
A key feature, which any theory of polar cap patches must explain, is why there exist minima between the re-gions of high plasma concentration, as opposed to them be-ing appended directly to each other, so formbe-ing a continu-ous “tongue” of enhanced ionization extending into the po-lar cap. Two different classes of mechanism have been pro-posed: (1) the intermittent entry of flux tubes (and the frozen-in, photon-produced ionization) into the polar cap by time-varying convection; and (2) in-situ effects of precipitation and electric fields within the cusp/cleft region.
1.2 Intermittent entry of photon-produced ionization into
the polar cap
Several conceptual and simulation models have reproduced polar cap patches using time-dependent convection in the presence of the photon-produced plasma concentration gra-dients associated with solar zenith angle (e.g., Anderson et al.,1988; Sojka et al., 1993, 1994). However, as pointed out by Lockwood (1993), it is not valid to impose time-varying convection patterns on a model of the coupled ionosphere-thermosphere system in an ad-hoc manner. The reason is that such a procedure will neglect the key magnetospheric distinction between open and closed field lines. Imposing an empirical model of the pattern of convection without this consideration will allow closed field lines to convect antisun-ward (without them first being opened or being subject to any viable viscous-like momentum transfer mechanism) and open field lines to convect sunward (without them first being reconfigured by tail or lobe reconnection).
Thus, although such simulations can produce patches by allowing plasma of varying photon-produced concentration to enter the polar cap, they are not revealing the true mecha-nism. This is because they are not constraining field lines to move into the polar cap through a realistic dayside re-connection merging gap, given that convection excitation is dominated by the production and loss of open flux by magnetic reconnection. Lockwood and Carlson (1992) pro-vided a conceptual model of how the flow changes associ-ated with pulsed reconnection could generate convecting po-lar cap patches, using the theory of ionospheric convection excitation by Cowley and Lockwood (1992). However, this mechanism relied on the OCB being in a close and particular
proximity to the plasma concentration gradient associated with the day-night solar terminator and so cannot explain si-multaneous patch production in the summer and winter polar caps, as has been observed by Rodger et al. (1994b). In ad-dition, the requirement of this special condition is at odds with the fact that patches are present within the polar cap for such a large fraction of the time. Lockwood et al. (2000) provided a refinement of the Lockwood and Carlson model which would apply if the Y-component of the IMF is large in magnitude and events are longitudinally extensive. In this model, lower-concentration flux tubes arise from local times further away from noon and, once in the polar cap, they form the equatorward part of each patch of newly-opened flux gen-erated by a reconnection pulse. Combined observations by the EISCAT Svalbard Radar (ESR) with the EISCAT VHF and CUTLASS radars (Lockwood et al., 2000) and by the ESR with the Cluster and DMSP spacecraft (Opgenoorth et al., 2001) provide evidence for this mechanism. Further-more, fast azimuth scans by the ESR have shown plasma enhancements propagating into the polar cap (Carlson et al., 2002).
1.3 In-situ effects in the cusp
Rodger et al. (1994a) point out that plasma production by soft particle precipitation could be an important effect in patch production (Whitteker, 1977; Watermann et al., 1994; Davis and Lockwood, 1996; Millward et al., 1999; Walker et al., 1999; Vontrat-Reberac et al., 2001). In addition, Rodger et al. (1994a) note that plasma loss rates are enhanced by strong ion drifts (Schunk et al., 1975) and these have been both predicted and observed to generate significant depletions in the cusp region (Balmforth et al., 1998, 1999; Ogawa et al., 2001) within flow channel events (Pinnock et al., 1993). Both these factors could be significant in introducing structure into the plasma concentrations on the timescales for flux tubes to enter the polar cap. To do so, it is necessary for some flux tubes entering the polar cap to have undergone one or both of these processes to a greater degree than others. If all variables remained constant, other than the reconnection rate, then all newly-opened flux tubes reconnected at a given MLT would undergo the same sequences of precipitation and motion and this would not generate the required structure.
Debate about these two classes of mechanism has been considerable (e.g. Rodger et al., 1994c; Lockwood and Carl-son, 1994) and it is probable that both are required for a full understanding of patches. McCrea et al. (2000) used the ESR to study the field-aligned plasma concentration profiles within patches and found them to be different from the pro-files of the nearby sunlit ionosphere but also different from those within the cusp, indicating that the enhanced plasma concentration in patches may result from ionisation by both solar EUV and cusp/cleft precipitation.
log
10( [N
e]
2in m
-3)
A B C D E F G H Ic).
b).
log
10( [N
e]
1in m
-3)
a).
Fig. 1. Logarithm of plasma concentration, log10[Ne], colour-coded as a function of invariant latitude and observation time, as observed
along (a) beam 1 and (b) beam 2 of the EISCAT VHF radar CP-4-B experiment (see text for details). The data are integrated into 10-s intervals. The plot shows the poleward-moving patches reported by Davies et al. (2002). (c) The ionospheric velocity, V0, corresponding to the magnetopause reconnection rate. The high ion temperature boundary is shown in the upper two panels as a white line. Minima in the reconnection rate are marked with vertical red dashed lines.
2 Observations
In this section, we consider in detail the observations of polar cap patches made by the EISCAT VHF radar on 23 November 1999, between 03:00 and 13:00 UT. Davies et al. (2002) have shown that some of these patches are linked to poleward-moving events seen by the HF CUTLASS Su-perDARN radar at Hankasalmi. A full description of the in-terplanetary conditions, seen by the Wind and ACE satellites, has been given in Paper I and by Moen et al. (2004). The re-sponse in the polar cap detected by the EISCAT VHF radar,
the auroral electrojet magnetometers and by various DMSP satellites, is also presented in Paper I, along with an analysis of the local reconnection rate around EISCAT beam 1. The reconnection rate was found to be significantly above zero at 06:45–12:45 UT (MLT of 09:30–15:30).
The magnetopause reconnection rate is proportional to V0,
the ionospheric plasma convection velocity component nor-mal to the open-closed boundary, OCB, and in the OCB rest frame (the constant of proportionality being the
prod-uct BiLi, where Bi is the ionospheric field and Li is the
log
10( f(h)
× [N
e]
1in m
-3)
log
10( f(h)
× [N
e]
2in m
-3)
c).
a).
b).
12 3 4 5 6 7 8 9 A B C D E F G H IFig. 2. Logarithm of the height-corrected plasma concentration, log10[f(h)Ne], colour-coded as a function of invariant latitude and
obser-vation time, as observed along (a) beam 1 and (b) beam 2 of the EISCAT VHF radar. The normalizing factor f(h) is an estimate of the ratio Ne(350)/Ne(h) based on the plasma scale height, derived from the observed temperatures and assuming diffusive equilibrium. (c) The
ionospheric velocity V0corresponding to the magnetopause reconnection rate. The high ion temperature boundary is shown in the upper two panels as a white line. The pulses in the reconnection rate can be associated with poleward moving events. Minima in the reconnection rate are marked with vertical red dashed lines. In (a) and (b) the dotted white lines mark linear fits to the major minima in the plasma concentration, as a function of range.
maps along field lines to unit length of the magnetopause
X-line). Paper I presents a procedure for computing V0
from EISCAT CP-4-B data, along with the westward velocity
along the OCB, V||W. Because the radar data are gated into
range gates of length 65 km, there are quantum jumps in the inferred OCB latitude and orientation and these are smoothed out by employing 5-min running means. This results in the
V0 and V||W data presented here being similarly smoothed
(i.e., 5-point running means of 1-min data). By comparison,
the scalar parameters (the plasma concentration Ne, the ion
temperature Ti, and the electron temperature Te) presented
here are all unsmoothed 10-s integrations.
2.1 EISCAT plasma concentration observations
On 23 November 1999, the CP4 experiment was run on the EISCAT VHF radar. In this mode, the radar observes simul-taneously along two beam directions: beam 1 is at an
1 2 3 4 5 6 7 8 9
Fig. 3. The variation of altitude-normalised ionospheric plasma concentration, f(h)×Ne, for range gate 5 of beam 1 (3=72.82◦, in black)
and gate 4 of beam 2 (3=72.16◦, in mauve). The data for beam 2 have been lagged by 110 s and the two observations points are 189 km apart.
the magnetic L-shells; beam 2 is at an azimuth 15◦east of
beam 1. Both beams are at an elevation of 30◦. For beam 1,
the MLT is approximately 2.75 h ahead of UT. The raw data are pre-integrated and recorded every 10 s; in the present pa-per, no post-integration of raw data has been applied before
they were analysed to give Ne, Teand Ti. We here employ
range gates 1–17, which cover invariant latitudes 3 from
70.8◦ to 78.1◦ along beam 1 and for which the separation
of the beams along the L-shells is 142 km and 421 km, re-spectively (corresponding to 15 min and 64 min of MLT).
The poleward-moving events can be seen in
Figs. 1a and b. These present the logarithm of the electron concentration, Ne, observed along EISCAT beams 1 and 2, respectively, as a function of time and radar range. Note that these plots scale the range axis (up the page) as a function of invariant latitude, 3, but because the beams are at an
elevation of 30◦, the observation altitude increases from
280 km to 914 km across the 3 range shown. It can be
seen that high-concentration patches were observed first in beam 2, appearing there near 07:15 UT, and roughly 25 min later in beam 1. This delay is of the same order as the MLT
separation of the two beams for range gate 5 (3=72.8◦),
where these early patches first appeared. Thus the radar appears to have rotated into a region where patches could be seen (at MLT>11 h). The patches were seen after the
IMF turned southward and the inferred OCB was eroding equatorward in the growth phase of the second substorm, discussed in Paper I. The end of the last significant patch was seen in the polar cap at 09:08 and 09:03 UT for beams 1 and 2, respectively (11:53 and 12:08 MLT). Thus patches were seen only during the relatively small MLT interval of about 11–12 h, whereas reconnection signatures were seen over the much larger MLT range of 09:30-15:30 (see Paper I). There is evidence that suggests that at least some of the reconnection pulses that do not generate patches are
real. For example, the large V0peak around 09:24 UT can be
seen to have caused an equatorward migration of the OCB
(and also caused a burst of enhanced westward flow (V||W,
seen in Fig. 3 and by the CUTLASS HF radar at Pykkvibær – data not shown) and ion temperature (see Fig. 5). Thus we conclude that this reconnection pulse was indeed real and yet it did not generate a poleward-moving patch.
Because the further range gates are at greater altitudes in the topside ionosphere, the patches of enhanced plasma con-centration in Fig. 1 appear to decay as they migrate pole-ward. To compensate for this, a correction has been made in Figs. 2a and b to make an allowance for the altitude profile of the ionosphere within the radar f-o-v. If we assume that the
plasma is in diffusive equilibrium, the topside Ne will show
A B C D E F G H I
b).
a).
V
| | W( km s
-1) V
′ ( km s
-1)
Fig. 4. (a) The velocity normal to the boundary in its own rest frame, V0, and (b) The westward flow parallel to the boundary, V||W. The
dashed black and white lines are at the same times as the red dashed lines in Figs. 1 and 2. The green line shows the lower latitude edge of enhanced plasma concentration observed along beam 1 and the white line is the OCB latitude.
Ne(h) = Ne(ho)e−(h−ho)/H,
f (h) = Ne(ho)/Ne(h) = e(h−ho)/H, (1)
where hois a reference altitude (here we adopt ho=350 km),
and H is the plasma scale height given by
H = kB(Te+Ti)/mig . (2)
Teand Ti are the electron and ion temperatures, kBis
Boltz-mann’s constant, mi the mean ion mass (assumed here to be
16 amu, i.e. pure atomic oxygen ions) and g the gravitational
acceleration. Using the Te and Ti observed by the radar in
each range gate and sampling interval, we compute the cor-responding H (assumed to be independent of altitude) and
f (h)and then estimate Ne(ho), the plasma concentration on the same field line as the observation, but mapped to a
uni-form altitude (we here adopt ho=350 km), using Eqs. (1) and
(2). Note that this procedure tends to underestimate Ne(ho)
in the nearest range gates as these are near the F2 peak and the exponential decrease with h in the topside is an
overesti-mate of the true gradient in Neat these heights.
The solid white lines in parts a and b of both Figs. 1 and 2 show the OCB latitude along the two beams, as derived in
Pa-per I. Figures 1c and 2c show the variation of V0, the velocity
of the plasma normal to the inferred OCB in the OCB rest
frame. In these figures, V0is for the gate immediately
pole-ward of the inferred OCB. (N.B., the full variation over the whole 10-h interval is shown in Fig. 13 of Paper I). Because
the value V0 depends primarily on V1, the plasma velocity
component observed normal to the L-shells along beam 1, it is here taken to apply to the MLT of beam 1.
Figure 1c shows that reconnection was ongoing through-out the interval, and was pulsed at the location of EISCAT.
The variations in V0 seen after 08:30 UT are much larger
than the estimated uncertainty, εV0=220 ms−1(see Paper I).
However, before this time the variations are smaller than, or
comparable to, εV0: thus the reconnection rate pulses before
08:30 UT were generally too small in amplitude, and/or too frequent to allow definitive identification in any one gate.
However, the same variations in V0 are seen in several
ad-jacent independent range gates around the OCB (c.f. Fig. 4a) indicating that they are real. Combining estimates from 4
such gates yields almost the same variation in V0but reduces
εV0 to near 100 ms−1, compared to which the pulses in V0
are significant, even before 08:30. There were two DMSP passes in close conjunction to the EISCAT radar in this inter-val. The first was by the F14 satellite which crossed the OCB at12:30 MLT and 08:50 UT (when the EISCAT beam 1 was near 11:35 MLT) and is shown in Fig. 6 of Paper I. The sec-ond was by F12 which crossed the OCB at 12:24 MLT and 9:01 UT (when the EISCAT beam 1 was near 11:46MLT) and is shown in Fig. 5 of Moen et al. (2004). Both these passes showed small stepped cusp ion signatures which, given the association with poleward-moving events, are con-sistent with rapid magnetopause reconnection rate pulses, as predicted by Cowley et al. (1991b) and Lockwood and Smith (1992). Lockwood et al. (1993a) and Farrugia et al. (1998)
have previously reported that cusp ion steps are indeed ob-served in association with poleward-moving events.
In Figs. 1 and 2, the times of the main minima in V0
are marked with vertical red dashed lines and are labelled A-I. As discussed in the Introduction, it is the production of the minima between the patches that is most puzzling and Figs. 2a and b reveal that a series of poleward-propagating plasma concentration minima was launched from the OCB: each of these minima has been marked by a black and white
dashed line and labelled 1–9. The V0 sequence applies at
beam 1 and comparison of Figs. 2c and a reveals that the on-set times of the plasma concentration minima 2, 5, 7, 8 and
9 in beam 1 are coincident with, respectively, V0minima C,
D, E, F and G. Thus reconnection pulses within the MLT in-terval 11–12 h can all be associated with poleward-moving patches, but outside this MLT range reconnection pulses do
not generate patches (there in no Ne enhancement between
V0 minima pairs AB, BC, GH and HI). It should be noted
here that rapid variations in the V0variation will be smoothed
out, because of the need to take a 5-min running means. The average separation of minima 1–7 is 5 min, whereas the cor-responding figure for minima 7–9 is 15 min. Therefore it is
not surprising that other rapidly-repeating Ne minima (1, 3,
4 and 6) cannot be associated with a clear, resolvable
min-ima in V0but may well be associated with the variations that
can still be seen, despite the smoothing, between the labelled minima.
Figure 2, because it allows for the altitude variation of the concentration, shows the true evolution of the patches. The tendency of the patches to fade out with increasing lati-tude in Fig. 1 is often the result of the experiment geometry – they appear to fade out because the beam is too high in the topside ionosphere at the greatest latitudes. Until about 08:45 UT, patches migrated poleward out of the radar field of view, but after this time, the patches were not reaching the further ranges of the beam. We will show that this is because they convected westward, under the influence of the strong
prevailing positive IMF By, rather than moving poleward out
of the radar f-o-v. The change at 08:45 UT is exactly mir-rored in backscattered power from adjacent latitudes to the north of the EISCAT f-o-v, as detected by the CUTLASS HF radar at Hankasalmi, Finland (see Davies et al., 2002). This provides yet further support for the association between poleward-propagating regions of enhanced HF backscatter and polar cap patches in the plasma concentration.
Figure 3 demonstrates the convection of the patches by plotting the altitude-normalised ionospheric plasma
con-centration, Ne(ho)=f(h)×Ne, for range gate 5 of beam 1
(3=72.82◦, in black) and gate 4 of beam 2 (3=72.16◦, in
mauve). The data for the beam 2 point have been lagged by 1t=110 s and because the two observations points are
d=189 km apart, the patches consistently convect at about
Vp=d/1t=1.7±0.2 km s−1between the two points (taking the
uncertainty in 1t to be ±10 s). Figure 2 gives that the
pole-ward phase motion of events was about 0.6 km s−1, from
which the observed Vp yields a westward phase motion of
1.6 kms−1. In Fig. 3 we note two classes of minima between
the patches. The first type are longer-lived minima
(vary-ing from 3 to 8 min, giv(vary-ing extents of Lmof between 300 and
600 km in the direction of motion). Within these longer-lived
minima, Ne(ho)returns to values typical of those seen on
the nightside (between about 2×10¹¹m−3and 3×10¹¹m−3).
These are the dominant minima seen after 08:24 UT and they are almost identical in the data from the two VHF radar beams. Before then, the second class of minimum dominates. These are shorter-lived (between about 20 and 120 s, giving
extents Lmin the range 35–200 km), shallower (Ne(ho)
con-sistently near 7×10¹¹m−3)and less coherent between the
two locations, although there is still considerable similarity between the two. One of these minima appears in the cen-tre of the first larger- scale patch observed by beam 1 (be-tween minima 7 and 8), but is absent from the same feature in beam 2. The patches between the deeper minima last for of
order 10 min, giving patch sizes Lpof order 1700 km in the
direction of motion), whereas the patches between the more
shallow minima last for of order 2 min giving Lp≈340 km.
Davies et al. (2002) and Moen et al. (2004) have noted that the ion temperatures at the time of many of these events showed transient enhancements, implying that the poleward-moving density structures were connected to transient flow and reconnection bursts. Figure 2 confirms that there is some association between the patches and reconnection rate pulses.
2.2 EISCAT plasma flow observations
Figures 4, 10 and 11 apply a novel analysis to the EISCAT plasma flow data during this interval. The panels of Fig. 4
show (a) V0(the poleward plasma flow, perpendicular to the
OCB in the OCB rest frame) and (b) V||W(the westward flow
parallel to the OCB) colour-coded as a function of observa-tion time and invariant latitude. The derivaobserva-tion of these flows relative to the inferred OCB is presented in Paper I. The black and white vertical dashed lines are at the same times as the red dashed lines in Figs. 1 and 2, i.e. the times of minima in the reconnection rate. It can be seen in Fig. 4a that the
V0features are largely aligned vertically in the plot,
indicat-ing that the poleward flow across the boundary is relatively independent of latitude. This confirms that the precise iden-tification of the OCB latitude is not critical in the reconnec-tion rate determinareconnec-tion, as noted in Paper I. Note that Fig. 4a shows that during reconnection rate pulses, poleward flow is excited on both sides of the boundary, as expected for the incompressible ionospheric magneto-plasma as it enters the polar cap: the fact that the poleward flow in the bursts is only a weak function of latitude shows that the reconnection ex-tended over a wide range of MLTs about the radar.
Figure 4b shows that the along-boundary westward flow,
V||W, was periodically enhanced over a range of latitudes
poleward of the OCB. These intervals of high V||W always
start with, or follow immediately after, the maxima in V0
and we interpret them as the bursts of westward flow on the newly-opened field lines produced by the reconnection burst
(for the prevailing IMF BY>0 in the Northern Hemisphere).
2 1 0.8 0.4 0 -0.4 l-o-s vel ocit y ( k m s -1 , positive t o war d r a dar) -0.8 (a)
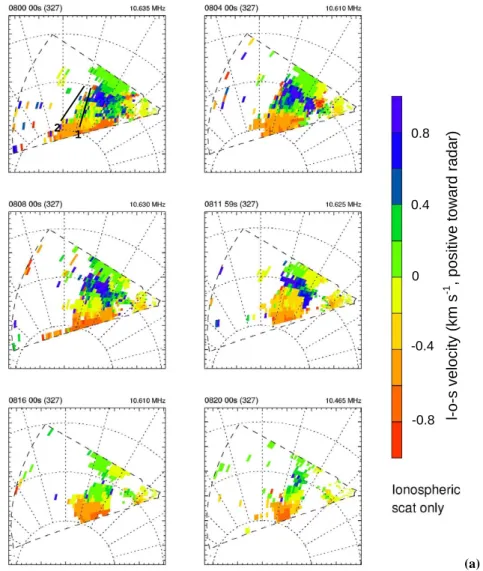
Fig. 5. Line-of-sight velocity measurements by the Pykkvibær CUTLASS HF radar, colour-coded on an MLT-invariant latitude, 3, grid.
The vertical dotted line is the 12:00 MLT axis and the concentric dotted circles are 3=60◦, 70◦and 80◦. Scans were recorded every 2 min, but only every other scan is presented here. (a) for 08:00–08:20 UT, (b) for 08:24–08:44 UT. Positive values (color coded green or blue) are toward the radar, i.e. generally westward, The black lines in the first panel give the locations of the two EISCAT VHF beams.
westward flow regions confirm the OCB identification. Note that the OCB location is not well defined between 08:00 and 08:45 UT when it migrated equatorward of the EISCAT f-o-v and fast flow features may therefore haf-o-ve been missed in
the EISCAT data for events which start after V0minima D, E
and F. The flow is westward at all latitudes and times covered by Figs. 1, 2 and 4, except at the lowest latitudes early in the interval, where it is eastward. This region of sunward flow is that discussed by Moen et al. (2004) and the equatorward edge of the patches shown in Fig. 1a is the green line drawn in Fig. 4b. This shows that all the patches were only seen poleward of the convection reversal boundary, on westward-flowing, newly-opened field lines. Thus Fig. 4b reveals why patches and high plasma concentrations were not observed before 10:30 MLT and appeared first at high latitudes: the patches were only seen where the convection was westward (away from noon) and not equatorward of the convection
re-versal boundary where V||W<0 because this eastward flow
brought low-density, nightside plasma onto the dayside.
The flow speeds derived (poleward and westward) are sim-ilar to the patch phase motions discussed in the previous sec-tion. Thus they appear to be convecting under the E×B drift, as expected for polar cap patches and as is usually assumed in the interpretation of HF radar backscatter patches. The pres-ence of westward flow bursts is confirmed by data from the HF CUTLASS radar at Pykkvibær, Iceland, shown in Fig. 5. These data are also valuable in identifying which of the west-ward flow channels extended equatorwest-ward of the EISCAT f-o-v during the interval 08:15–09:00 UT, when the OCB
mi-grates to 3 below 70.8◦. The l-o-s velocity (Vlos, positive
towards the radar) is plotted for the eastward-viewing scan in an invariant latitude – MLT frame. The beams of the EISCAT VHF radar are shown in black in the first frame of Figs. 5a and b. Scans were recorded every 2 min, but only every other scan is presented here: Fig. 5a is for 08:00–08:20 UT and Fig. 5b is for 08:24–08:44 UT.
The intermediate scans (not shown), in general, reveal evo-lution between the frames that are shown. At the start of
2 2 1 1 0.8 0.4 0 -0.4 l-o-s vel ocit y ( k m s -1 , positive t o war d r a dar) -0.8 (b) Fig. 5. Continued.
the interval shown, a westward flow burst can be seen as a blue patch in Fig. 5a, immediately to the west of the EIS-CAT beam 1. This patch persists in the next three frames and migrates southward. This behaviour can also be
identi-fied in V||W in Fig. 4b and corresponds to the event
follow-ing the V0minimum labelled D. In this event, V||W peaks at
1.5 kms−1which is consistent with the peak Vlosof 1 kms−1
because the boundary is oriented at about 30◦ to the
rele-vant Pykkvibær radar beams. It is also comparable to the inferred phase motion of the events. This first event in the HF radar data shown had faded away by 08:16. A second, smaller westward-flow event peaked at 08:24 UT which did not extend to latitudes below the EISCAT f-o-v. The
cor-responding small event can be seen in V||W in Fig. 4b
fol-lowing the V0 minimum E. This small event had faded by
08:28 UT and a third, very strong and latitudinally-extensive event started to form at 08:36 UT. For comparison, the peaks
in V||Win Fig. 4b in gate 2 are at 08:09, 08:23 and 08:48 UT
– in good agreement with the bursts of westward flow at the same latitude seen by the Pykkvibær CUTLASS radar. Thus
the patches were convecting rapidly into, and through, the EISCAT f-o-v from the east with a convection velocity of
or-der 1.5 km s−1. This westward motion was much faster than
the poleward propagation which was of order 0.6 km s−1.
2.3 EISCAT plasma temperature observations
The ion temperature (Ti)enhancements seen along the two
beams are very similar, as can be seen in Fig. 6 which plots
Ti, colour-contoured as a function of invariant latitude and
UT for (a) beam 1 and (b) beam 2. Note that the ion tem-peratures observed are line-of-sight values and assume a Maxwellian ion thermal velocity distribution. For the large angles between the magnetic field lines and the radar beams used here, the ion temperatures derived will systematically overestimate the true ion temperature in heating events be-cause of the non-isotropic, non-Maxwellian form of the ion distribution functions (Lockwood et al., 1993d); however, this effect will not alter the general pattern of the variations
shown in Fig. 6. The general decrease in Ti values between
a).
b).
1 2 3 4 5 6 7 8 9[T
i]
1( K )
[T
i]
2( K )
Fig. 6. Ion temperature observed along (a) azimuth 1, [Ti]1, and (b) along azimuth 2, [Ti]2, for the same interval as Fig. 1. The white lines
are the inferred OCB latitude and the dashed white lines are the same as in Figs. 2 and 7.
the effect of enhanced neutral winds driven by the persistent westward ion flow and we here discuss this effect in some more detail. Lockwood and Fuller-Rowell (1987) used a coupled ionosphere-thermosphere model to show how strong westward neutral winds are expected in the afternoon auroral oval and in the near-noon cusp region. This is because cen-trifugal and coriolis forces are opposed to each other in the afternoon auroral oval and parcels of neutral thermospheric air receive greater momentum from ions because this bal-ance of forces keeps them in the region of fast sunward ion flow for longer intervals. As a result, fast westward neutral wind (velocity Vn) arrives in the cusp region around noon.
Ion-neutral frictional heating varies as (Vi–Vn)2, where Vi is
the ion velocity: thus there is a region of strong ion heating where the westward wind meets the eastward ion flows in the auroral oval of the dawn convection cell, as seen before 07:45 at low latitudes. However, after 07:45 the ion flow observed is westward and hence the vector difference (Vi–Vn) is not so large and the ion heating is weaker. After 08:45 stronger ion heating is again seen because the polar cap is contract-ing: this causes the westward ion flow to meet any eastward neutral wind that had been established in the expanded polar cap. Lockwood et al. (1988) and Fox et al. (2001) have pre-sented other examples of such ion heating associated with a contracting polar cap boundary.
The dashed lines are the same as marked on Fig. 2 for
the respective beams. There were no consistent Ti
struc-tures associated with the Neminima but there were ion
heat-ing events near the onset of several events. Specifically,
minima 1, 3 and 9 in beam 1 and 2 and 9 in beam 2 mapped to
strong enhanced Ti events. Thus only for event 9 did strong
ion heating span both beams. Minima 2, 5, 7 and 8 in beam 1
and 3, 5, 7 and 8 in beam 2 map to weak Ti enhancements.
Thus only for minima 4 and 6 is no ion heating seen in either beam.
Figure 7 shows the electron temperature Te data in the
same format as Fig. 6. The poleward-moving events can be
seen with minima in Tecoinciding with the Nepeaks and Te
peaks lining up with the dashed lines denoting the Ne
min-ima, as given by Fig. 2. The very strong anticorrelation
be-tween the EISCAT Teand Neobservations is underlined by
the plots for gates 1 (bottom) to 6 (top) shown in Fig. 8.
3 Analysis of patch formation mechanisms
As discussed earlier, the major difficulty in understanding patch formation is the origin of the concentration minima be-tween the patches rather than the mechanisms that give the high concentration within the patches. We here analyse each of the mechanisms in the light of the data presented in the last section.
3.1 Patch enhancement by magnetosheath precipitation
Figures 7 and 8 show that the minima in Ne are
accompa-nied by maxima in the electron temperature Teand that Teis
considerably depressed inside the high Nepatches. Inside the
1 2 3 4 5 6 7 8 9
b).
a).
[T
e]
1( K )
[T
e]
2( K )
Fig. 7. Electron temperature observed along (a) azimuth 1, [Te]1, and (b) along azimuth 2, [Te]2, for the same interval as Fig. 1. The white
lines are the inferred OCB latitude and the dashed white lines are the same as in Figs. 2 and 6.
be enhanced (Whitteker, 1977; Walker et al., 1999; Millward et al., 1999; Vontrat-Reberac et al., 2001) and this is indeed observed in the cusp/cleft region (Titheridge, 1976; Brace et al., 1982; Curtis et al., 1982; Doe et al., 2001). However, as the field lines convect poleward of the cusp/cleft into the mantle and polar cap precipitation regions, modelling studies
show Tewill fall rapidly as the precipitation flux decays; on
the other hand Newill decay only slowly (Watermann et al.,
1994; Davis and Lockwood, 1996;). Thus regions of high
Neand non-enhanced Tecould be fossil remnants of passage
through the cusp/cleft precipitation region. For sheath-like precipitation alone to form a convecting sequence of patches and minima, some flux tubes would need to be subject to higher precipitation flux than others as they enter the polar cap.
Satellite passes close to the EISCAT f-o-v at the time of these patch observations show high-flux magnetosheath ion and electron precipitation (cusp and cleft) over an invariant
latitude band of at least 1.5◦poleward of the OCB (see, for
example, Fig. 6 of Paper I and Fig. 5 of Moen et al., 2004).
If the polar cap patches (high Ne– low Te)were remnants of
precipitation, in no case did either of the EISCAT beams in-tersect the source precipitation region (which would be
iden-tified by elevated Neand Te). In fact, the observed
concen-tration enhancements in the patches Ne>1012m−3are
con-siderably greater than the simulation studies discussed above predict for sheath precipitation effects.
Figure 7 shows that several of the low Te regions extend
continuously poleward from equatorward of the OCB. The precipitation required cannot be regarded as being to the west
or, most likely in this case with IMF BY>0, to the east of the
radar f-o-v. In Fig. 4 we see that reconnection is ongoing lo-cally and thus the sheath-like precipitation on newly-opened field lines must be present at the MLT of the radar. Thus we conclude that the patches seen on this day were not fossil remnants of sheath-like precipitation.
3.2 Patch separation by high plasma flow channel
Strong flow channels in which newly-opened field lines move rapidly for periods of order 5–10 min can deplete the iono-sphere. Observations of this effect, and numerical simula-tions of it, have been presented by Balmforth et al. (1998, 1999). Thus if some of the newly-opened flux tubes undergo rapid motion for a prolonged time (where others do not), this effect can give the minima between patches. The plasma is depleted because of high plasma loss rates, caused by en-hanced ion velocities in the presence of ion-neutral collisions (Schunk et al., 1975). This effect also elevates the ion tem-perature. Thus regions where such loss is taking place will show in the radar data as regions of high ion temperature. Given only minima 4 and 6 failed to register at least some ion heating in at least one radar beam in their observed life history (Fig. 6), this effect could indeed be important. (In events 4 and 6 the ion heating could have existed but at an MLT outside the radar f-o-v).
Coincident with minimum 8 there is a persistent weak
rise in Ti; however, Ti<Te here and so the ions are
be-ing heated predominantly by conduction from the electron gas, rather than ion-neutral frictional heating. Strong ion
12 3 4 5 6 7 8 9
Fig. 8. Ten-second electron concentration ([Ne]1, blue) and temperature ([Te]1, red) observations by the EISCAT VHF radar along beam 1,
for range gates 1 (bottom) to 6 (top) at invariant latitudes 3 of 70.83◦, 71.33◦, 71.84◦, 72.33◦, 72.82◦and 73.30◦.
heating is possible in this event equatorward of the EISCAT f-o-v where fast westward flow could have existed between the OCB and the equatorward edge of the f-o-v. However, this is the small middle event of the three revealed in the data from the Pykkvibær CUTLASS radar shown (Fig. 5) and these data reveal that this westward flow burst did not
extend equatorward of the EISCAT f-o-v. Another
explana-tion could be that the high-Ti region was to the east of the
radar field of view and the fossil trough it generated then
convected westward into the f-o-v. The trough was first
seen in beam 1 roughly d=100 km poleward of the OCB,
Fig. 4). From this we infer that this trough was first seen by
beam 1 on field lines that have been open for d/V0≈250 s.
Figure 4b shows that the westward flow along the boundary
at this time was V||W≈1.2 kms−1 and thus the trough field
line crossed the boundary V||W(d/V0)≈300 km to the east of
beam 1. This gives two inconsistencies with the concept that the trough originated via a high-velocity flow channel: firstly, the elapsed time is unlikely to be great enough to produce the concentration decrease (Balmforth et al., 1998, 1999). Sec-ondly, beam 2 is roughly 200 km to the east at this latitude and would be seeing the same field lines when their time elapsed since reconnection was just 80 s, and yet no
signifi-cant Ti enhancement was seen at beam 2 either.
We can conclude that at least one of the observed minima between the patches is inconsistent with the concept that they were generated by rapid flow on newly-opened field lines.
3.3 Patch production by intermittent poleward transport of
photoionisation-produced plasma
Figure 9 shows schematically the patch formation mecha-nism proposed by Lockwood et al. (2000), adapted for this
case of IMF BY>0 in the Northern Hemisphere. This
mech-anism is based on the concept that the active reconnection region expands rapidly away from noon during each event, as proposed by Lockwood et al. (1993b) and Lockwood (1994), and as consistent with the data presented by Milan et al. (2000) and McWilliams et al. (2001). The shading of ar-eas in Fig. 9 denotes the time that parts of an event are recon-nected, the darker regions being reconnected later and further away from noon as the reconnection pulse propagates around the afternoon sector. The panels of Fig. 9 show the evolution of newly-opened field lines as they move westward under the magnetic curvature force (Cowley et al., 1991a; Greenwald et al., 1990) before being assimilated into the polar cap by poleward motion (Cowley and Lockwood, 1992). This pat-tern of motion is as observed in dayside cusp/cleft auroral and flow transients (Lockwood et al., 1989) and the motion of regions of enhanced HF backscatter (Milan et al., 2000).
Patches in Ne could be seen because the last flux tubes to
be opened by the pulse are reconnected nearer dusk, where the ionospheric plasma concentrations are lower. Thus the black region will contain lower plasma concentrations than the lighter-shaded region, which was reconnected earlier in the event. In Fig. 9, two illustrative radar beams are shown. For the more westerly of the two, A, the full poleward mo-tion of the event would be seen. However, for a radar beam at location B, further to the east, the patches move mainly westward over the beam and their poleward motion is not seen in full. This behaviour can be noted in Fig. 2a be-cause beam 1 observed patches that propagated through all
latitudes to 3=78◦ until 08:45 UT (11:30 MLT), but after
this time the patches were not seen at the highest latitudes. Thus before this time, beam 1 was at an MLT correspond-ing to beam A in Fig. 9, whereas after this time beam 1 was in a location corresponding to B in Fig. 9. Because this behaviour of the patches is also apparent in Fig. 2, where
b). c). d). a). A B e).
Fig. 9. Schematic illustration of the theory of polar cap patch
forma-tion by Lockwood et al. (2000), here for the Northern Hemisphere with IMF By>0. The pulse of enhanced reconnection propagates
through the afternoon sector away from 12:00 MLT (vertical line), opening the field lines: the darker shaded regions are opened last and at the largest MLT. A and B are two illustrative radar beam locations (see text for details).
electron density is reconstructed for a constant altitude, this effect cannot be attributed to the altitude of the beam. The same change can be seen for beam 2 (Fig. 2b) at 07:52 UT
(11:41 MLT at 3=78◦). The data from both beams are hence
consistent with events evolving to later MLT before about 11:30 UT under the magnetic curvature force, before mov-ing northward and bemov-ing subsumed into the polar cap.
The decreases in Teassociated with high Nereported here
can be considered consistent with transport of EUV-produced plasma into the polar cap. Under the same downward heat
flux conditions, an increase in Ne will lead to a decrease in
Te. Thus if high-Ne plasma patches are convected through
the cleft/cusp, Te will be lower than for low-Ne flux tubes
a).
b).
1 2 3 4 5 6 7 8 9 1 2 3 4 5 6 7 8 9∫
V
2dt ( km
2s
-1)
[M
LT]
o(hrs)
Fig. 10. Analysis of the cause of the patches. (a) The estimated MLT where field lines seen by beam 1 were reconnected, [MLT]oand (b)
the integral of the square of the plasma speed between reconnection and observation at beam 1. The white lines are the inferred OCB latitude and the dashed lines are the same as in Fig. 2. In (a) values of [MLT]obelow 11 are shown in blue.
of any high Neequatorward of the patches in beam 1 before
08:30 UT (08:20 for beam 2) in Fig. 1 does not argue against the convection of EUV-enhanced patches into the polar cap, as it would have done had the flow been purely poleward. This is because at this time the patches were also convect-ing westward and so the EUV-enhanced plasma would have crossed the OCB to the east of the radar f-o-v but moved poleward into the polar cap to the west of the radar f-o-v.
Outside the MLT interval 11:00–12:00, no poleward-moving patches were observed despite the fact that pulsed reconnection signatures were detected over a much longer interval (09:30–15:30 MLT). Thus patches were only seen in the EISCAT f-o-v when it was near to noon and there was pulsed local reconnection. This is consistent with the con-cept of entry of subauroral, EUV-enhanced plasma into the polar cap, as proposed by Lockwood and Carlson (1992), in that the merging gap must have the required orientation with respect to the plasma concentration gradient around the day-night terminator – it is also consistent with the refinement of this concept by Lockwood et al. (2000) in which the recon-nection pulse propagates zonally over this plasma concentra-tion gradient.
Lockwood et al. (2000) pointed out that Fig. 9 can ac-commodate two physical mechanisms that might generate the minima between the patches. Flux tubes reconnected away from noon will contain a lower concentrations of EUV-produced ionospheric plasma; at the same time, such flux tubes may also move further and faster under the magnetic curvature force before moving poleward into the polar cap.
Both effects mean that these flux tubes will have lower con-centration than flux tubes reconnected nearer noon. In addi-tion, any enhancement by cusp/cleft precipitation would be smaller because of the plasma concentration variation in the
magnetosheath. These low-Neflux tubes would end up
sand-wiched between the high-Ne flux tubes inside the polar cap.
Figures 10 and 11 present an analysis of the relative impor-tance of these two effects.
The upper panel of Fig. 10 shows [MLT]o, the estimated
MLT where a flux tube was reconnected, as a function of the time and latitude of its subsequent observation by the EIS-CAT radar beam 1. To produce this figure, we assume that the flow components across and along the OCB, as seen by
EISCAT (V0 and V||W), apply at a given time t at all MLT
between the reconnection site and the radar beam. Each flux tube is then mapped backwards in time, in the boundary rest
frame, using the observed V0and V||W, shown in Fig. 4,
un-til it intersects the boundary, giving the time and MLT of reconnection (i.e. when it crossed the boundary). The re-sults are shown in Fig. 10a. It can be seen that field lines seen early in the series were reconnected before 11:00 MLT (shaded dark blue), but then some field lines reconnected af-ter 11:30 MLT (the light blue contour) begin to appear at the radar beam. Because they originate closer to noon, these will
contain higher Ne. Figure 8 shows that the highest number
densities in gate 1 (which for most of the time is equatorward of the OCB) are observed in a plateau at 08:45–09:20 UT (11:30–12:05 MLT). These peak concentrations correspond to the green and light blue contours in Fig. 10a. These agree
∫
V
2dt ( km
2s
-1)
[M
LT]
o(hrs)
12 3 4 5 6 7 8 9 1 2 3 4 5 6 7 8 9b).
a).
Fig. 11. Same as Fig. 10, for beam 2.
quite well with where Ne(ho)is greatest in Fig. 2a, although
higher electron concentrations commence somewhat earlier in Fig. 2 than we might predict on the basis of Fig. 10, pre-sumably because of the additional ionising effect of sheath-like precipitation. The bottom panel of Fig. 8 shows that
Ne falls rapidly in beam 1, gate 1 between about 09:15 and
09:45 UT (roughly 12:00–12:30 MLT). The red contours are
for [MLT]oexceeding 12:30, where the source concentration
is smaller than the near-noon peak values by a factor of more than 3. It can be seen that minima 8 and 9 do indeed line up very well with peaks in [MLT]o, strongly implying that these minima are created by the transport of lower concen-tration plasma from the post-noon sector. Minima 3 and 6
are also aligned with peaks of [MLT]o. The largest values
of [MLT]oare to be found late in the interval and these are
consistent with the low Ne(ho)observed then (with no patch
enhancements).
The bottom panel of Fig. 10 shows the square of the ion
ve-locity, V2, integrated over the interval during which the flux
tube convects from its inferred reconnection site to where it
is observed by the EISCAT radar (∫V2dt). This quantity is a
measure of the integrated effect of the convection velocity on
the flux tube depletion. Maxima in ∫V2dt match up well to
minima 2, 5, 6, 7 and 9; however, event 8 shows no peak in
∫V2dt and that observed in event 9 does not line up so well
with the Neminimum.
Note that because the variations of V0and V||W are both
5-point running means of 1-min data, neither [MLT]o nor
∫V2dt should be expected to reflect all of the structure that
can be seen in the Ne(ho)observations. Nevertheless, it is
instructive to look at the timings of what variations are ob-served and how they vary along the radar beams.
The one feature missing in Fig. 10a is the large [MLT]o
that should have been observed along minimum 7, which Figs. 1a and 3 show was one of the most pronounced of all
the Ne minima. An explanation of this is may be provided
by Fig. 10b which shows that there is well-aligned peak in
∫V2dt, albeit not of the largest magnitude.
Figure 11 shows the corresponding plot to Fig. 10 for beam 2. Because of the different orientation of this beam with respect to the magnetic meridian, the regions of larger
[MLT]o are more sloped than in Fig. 10. Again, minima 8
and 9 fit the predicted [MLT]ovariation very well and 3 and
6 line up with weak peaks in [MLT]o. As for beam 1, there
is a ∫V2dt peak at the time of minimum 9, but which is not
quite as well aligned as that in [MLT]o, and there is no peak
associated with minimum 8. The peaks in ∫V2dt do not line
up well with the earlier events 1–7.
Because both ∫V2dt and [MLT]o are based on smoothed
flow data (5-min running-means) we should expect them to match the larger period events at the end of the interval bet-ter than the short period events 1–7. The computation of both
∫V2dt and [MLT]ois based on the assumption that the flow
is longitudinally uniform between the reconnection point and the radar at all times – this assumption will be poorest when the MLT difference between the radar and the reconnection point is greatest and may lead to some of the apparent dis-crepancies.
These results are summarised in Table 1, which also gives the time of each minimum since the previous one, 1T, the
Table 1. Summary of event characteristics.
Event Minimum Decrease since Time since Potential Potential Potential Potential
Number in Ne(ho)** since since [MLT]o [MLT]o ∫V2dt ∫V2dt
(1011m−3) preceding preceding feature in feature in feature in feature in maximum** minimum beam 1? in beam 2? beam 1? in beam 2?
1Ne(ho) 1T (min)
(1011m−3)
1 5 7 4.65 No* No* No* No*
2 7 6 4.03 No* No* Yes No*
3 4 8 5.34 Yes Yes No No
4 6 11 4.77 No* No* No* No*
5 6 11 5.84 Yes No Yes No
6 6 11 5.38 Yes Yes Yes No
7 2 15 4.98 No* No* Yes No*
8 2 13 15.37 Yes Yes No No
9 2 10 15.21 Yes Yes Yes Yes
∗but 1T<5 min
∗∗maximum and minimum values in range gates 3–17.
minimum Ne(ho)and the decrease since the previous
maxi-mum 1Ne(ho). In Table 1, we mark with an asterisk those
events which do not match up to ∫V2dt and [MLT]ofeatures
and for which 1T is less that the 5-min smoothing time of the velocity data. Table 1 shows that the failure to match up either mechanism to minima 1 and 4 can be attributed to the necessary smoothing of the flow data and the same effect makes it hard to draw conclusions from events 2 and 7. For
both beams, minima 3, 6 and 8 match up will with [MLT]o
features but not ∫V2dt features, whereas minimum 9 can be
matched up with corresponding features in both [MLT]oand
∫V2dt.
4 Conclusions
Pulses in the inferred reconnection rate have been shown to be associated with synchronous flow enhancements along the OCB and consequent ion temperature enhancements, and the production of poleward-moving events and polar cap patches. We have shown that most of the poleward-moving patches of enhanced plasma concentration in the interval studied can be associated with a reconnection pulse. How-ever, some pulses failed to cause a patch and patch produc-tion was limited to a much smaller MLT extent than the observed reconnection merging gap and the interval over which the reconnection pulses were observed. The events presented here were also seen in conjunction with cusp ion steps (Cowley et al., 1991b; Lockwood and Smith, 1992; Newell and Meng, 1991; Escoubet et al., 1992) seen by low-altitude polar-orbiting spacecraft (see Paper I) which, when seen in conjunction with poleward moving events, are an
unambiguous signature of transient magnetopause reconnec-tion (Lockwood et al., 1993a; Lockwood and Davis, 1995; 1996; Pinnock et al., 1995; Farrugia et al., 1998).
We have looked at the various mechanisms that have been proposed for polar cap patch production. We have provided strong evidence that at least the longer-lived, deeper min-ima between the larger-scale patches appear to be caused by transient inclusion of lower-concentration plasma from outside the polar cap, as discussed in Sect. 1.2. We find evidence for enhancement of plasma concentration by soft magnetosheath precipitation down newly-opened field lines, but this does not appear to be a factor that contributes to the minima between the patches and poleward-moving events, nor is it sufficient to explain the maximum plasma concen-trations in the patches. We also have shown evidence of a second cause of plasma concentration minima. These tend to be shorted-lived, more repetitive, less coherent in longi-tude and less deep. It is difficult to differentiate between the mechanisms for threes cases because of the need to use 5-min smoothed flow data. We find evidence for some contribution of the enhanced loss rates in zonal flow events of the kind ob-served by Lockwood et al. (1989) and Pinnock et al. (1993), as modelled by Balmforth et al. (1998, 1999) (see Sect. 1.3). The results can be summarised by looking at the electron density minima seen in Figs. 1 and 2, in relation to the pre-dictions for the proposed mechanisms, as shown in Figs. 10 and 11 and Table 1. To summarise the results: three of the events (minima 3, 6 and 8) are only explained as injection of lower concentration of photon-produced plasma from larger MLT (hereafter referred to as “the MLT effect”). One of the deeper minima, event 7, is only explained by enhanced loss
rates induced by fast longitudinal flow (“the flow channel ef-fect”); however, although this is true for beam 1, agreement is not so good for beam 2. Three events could be a mix-ture of the two effects, but the propagation of events down the beams is better matched to the MLT effect than the flow channel effect.
For the last event (minimum 9) there is a clear peak in
[MLT]o, but there is also a peak in ∫V2dt; however, the
lat-ter is not as well-aligned with the progression of the event down the beam in either azimuth. Thus minimum 9 appears best explained by the MLT effect. This was one of the deep
minima. Minimum 8 shows a clear peak in [MLT]owhich,
in both beams, is well-aligned with the event progression in
both azimuths, but no peak in ∫V2dt. The CUTLASS radar
data confirm there was no strong flow event at this time which could have generated this minimum; therefore this deep min-imum is only explained by the MLT effect.
The plasma concentration enhancements will cause en-hanced excitation of the 630-nm red line oxygen emission in the cusp by the hot tail of the thermal ionospheric elec-tron population (Wickwar and Koffman, 1984; Lockwood et al., 1993c). Thus we can associate the events discussed here with aspects of poleward-moving auroral red-line transients (Sandholt et al., 1993; Fasel, 1995; Moen et al., 1995). We note, however, that not all aspects of the auroral emission in these transient events can be explained in terms of the ef-fects of enhanced plasma concentration in patches. In par-ticular, events frequently show regions of dominant 557.7-nm oxygen green line emission in their early phases and this reveals accelerated electron precipitation: this has been as-sociated with the region of upward field-aligned current of the oppositely-directed pair that transfers the momentum as-sociated with the event to the ionosphere (Lockwood et al., 1993c). Observations by the CUTLASS radar shows that the transient red-line events are also associated with poleward-moving regions of enhanced HF backscatter (Davies et al., 2002). As with polar cap patches, the difficulty in under-standing these events has been underunder-standing the minima that form between them, as discussed by Lockwood and Davis (1996). (Note that without the minima, they would not be identified as poleward-moving events).
Several of the observed events have repeat periods too short (<5 min) to allow discrimination between the proposed mechanisms. This time resolution limitation is set by the need to smooth out boundary location and orientation errors introduced by the range resolution of the radar experiment used. Thus improved range resolution would allow the test to be applied to the shorter period events.
In this paper, we have found that some of the well-resolved minima (repeat periods >5 min) are only explicable as the ef-fect of plasma concentration gradients associated with solar photo-ionisation being convected into the polar cap. There is, however, also evidence of an additional effect of enhanced plasma loss rates induced by fast flow. The role of one or other, or a combination of the two is explained using the the-ory outlined by Lockwood et al. (2000).
Paper I shows that reconnection was present on this day over a wide extent of the dayside (covering roughly 09:00– 15:00 MLT), whereas the patches presented here were only seen by EISCAT over the smaller range of 10:30–12 MLT. The lack of patches before 10:30 MLT is because the radar was then viewing the region of eastward (sunward) flow in the auroral oval and thus the plasma originates from the nightside and is of low concentration. The lack of patches after 12:00 MLT is related to the motions of the polar cap boundary discussed in Paper 1 and, in particular, the pole-ward retreat of the dayside OCB caused by the substorm ex-pansion phase. Figure 6a shows that because of this pole-ward retreat of the OCB, only before 12:00 MLT (09:15
at beam 1) do the bursts of poleward flow (V0>0) reach
down to the lower latitudes near the day-night terminator, where ionospheric plasma concentrations are enhanced by photoionisation. Thus this is consistent with the idea that the higher concentrations in the patches observed were gen-erated by photoionisation and then convected into the polar cap when bursts of reconnection opened them and they sub-sequently migrated into the polar cap: for this to happen the OCB needed to be close to the day-night terminator and this was true in the late growth phase/early expansion phase of the substorm until the polar cap contracted too far poleward. Thus, through their effect on the latitude of the OCB (as dis-cussed in Paper 1), substorm cycles can modulate the forma-tion of polar cap patches.
Acknowledgements. The authors are grateful to the staff of the
EIS-CAT Scientific Association for their support and the provision of the EISCAT radars. EISCAT is a collaboration of research Councils of the UK, France, Germany, Norway, Sweden, Finland, Japan and China. The CUTLASS SuperDARN radars are supported by the UK Particle Physics and Astronomy Research Council (PPARC). The UK authors of this paper are supported by PPARC, the Nor-wegian scientists by the NorNor-wegian Research Council and AFOSR task 2311AS.
Topical Editor T. Pulkkinen thanks P. E. Sandholt and another referee for their help in evaluating this paper.
References
Anderson, D. N., Buchau, J., and Heelis, R. A.: Origin of density enhancements in the winter polar cap ionosphere, Radio Sci., 23, 513–519, 1988.
Balmforth, H. F., Moffett, R. J. and Rodger, A. S.: Modelling stud-ies of the effects of cusp inputs on the polar ionosphere, Adv. Space Res., 22(9), 1391–1394, 1998.
Balmforth, H. F., Moffett, R. J., and Rodger, A. S.: Localised struc-ture in the cusp and high latitude ionosphere, A modelling study, Ann. Geophys., 17, 455–462, 1999,
SRef-ID: 1432-0576/ag/1999-17-455.
Brace, L. H., Theis, R. F., and Hoegy, W. R.: A global view of the F-region electron density and temperature at solar maximum, Geophys. Res. Lett., 9, 989–992, 1982.
Carlson, H. C., Oksavik, K., Moen, J., van Eyken, A. P., and Guio, P.: ESR mapping of polar-cap patches in the dark cusp, Geophys. Res. Lett., 29 (10), 1386, doi:10.1029/2001GL014087, 2002.
Carlson, H. C., Oksavik, K., Moen, J., and Pedersen, T.: Iono-spheric patch formation: Direct measurements of the origin of a polar cap patch, Geophys. Res. Lett., 31 (8), L08806, doi:10.1029/2003GL018166, 2004.
Cowley, S. W. H. and Lockwood, M.: Excitation and decay of so-lar wind-driven flows in the magnetosphere-ionosphere system, Ann. Geophys., 10, 103–115, 1992.
Cowley, S. W. H., Morelli, J. P., and Lockwood, M.: Dependence of convective flows and particle precipitation in the high-latitude dayside ionosphere on the X and Y components of the interplan-etary magnetic field, J. Geophys. Res., 96, 5557–5564, 1991a. Cowley, S. W. H., Freeman, M. P., Lockwood, M., and Smith, M.
F.: The ionospheric signature of flux transfer events, in: CLUS-TER – dayside polar cusp, edited by: Barron, C. I., ESA SP-330, European Space Agency Publications, Noordwijk, The Nether-lands, 105–112, 1991b.
Curtis, S. A., Hoegy, W. R., Brace, L. H., Maynard, N. C., Suguira, M., and Winningham, J. D.: DE-2 cusp observations: role of plasma instabilities in topside ionospheric heating and density fluctuations, Geophys. Res. Lett., 9, 997–1000, 1982.
Davies, J. A., Yeoman, T. K., Rae, I. J., Milan, S. E., Lester, M., Lockwood, M., and McWilliams, K. A.: Ground-based obser-vations of the auroral zone and polar cap ionospheric responses to dayside transient reconnection, Ann. Geophys., 20, 781–794, 2002,
SRef-ID: 1432-0576/ag/2002-20-781.
Davis, C. J. and Lockwood, M.: Predicted signatures of pulsed re-connection in ESR data, Ann. Geophys., 14, 1246–1256, 1996,
SRef-ID: 1432-0576/ag/1996-14-1246.
Doe, R. A., Kelly, J. D., and S´anchez, E. R.: Observations of per-sistent dayside F- region electron temperature enhancements as-sociated with soft magnetosheathlike precipitation, J. Geophys. Res., 106, 3615–3630, 2001.
Escoubet, C. P., Smith, M. F., Fung, S. F., Anderson, P. C., Hoff-man, R. A., Basinska, E. M., and Bosqued, J.-M.: Staircase ion signature in the polar cusp: a case study, Geophys. Res. Lett., 19, 1735–1738, 1992.
Farrugia, C. J., Sandholt, P. E., Denig, W. F., and Torbert, R. B.: Observation of a correspondence between poleward-moving au-roral forms and stepped cusp ion precipitation, J. Geophys. Res., 103, 9309–9315, 1998.
Fasel, G. J.: Dayside poleward moving auroral forms: a statistical study, J. Geophys. Res., 100, 11 891–11 905, 1995.
Foster, J. C.: Plasma transport through the dayside cleft: A source of ionisation patches in the polar cap, in: Electromagnetic cou-pling in the polar clefts and caps, edited by: Sandholt, P. E. and Egeland, A., Kluwer, 343–354, 1989.
Foster, J. C. and Doupnik, J. R.: Plasma convection in the vicinity of the cleft, J. Geophys. Res., 89, 9107–9113, 1984.
Fox, N. J., Cowley, S. W. H., Davies, J. A., Greenwald, R. A., Lester, M., Lockwood, M., and L¨uhr, H.: Ionospheric ion and electron heating at the poleward boundary of a poleward-expanding substorm-disturbed region, J. Geophys. Res., 106, 12 845–12 862, 2001.
Greenwald, R. A., Baker, K. B., Ruohoniemi, J. M., Dudeney, J. R., Pinnock, M., Mattin, N., Leonard, J. P., and Lepping, R. P.: Simultaneous conjugate observations of dynamic variations in high-latitude dayside convection due to changes in IMF By, J. Geophys. Res., 95, 8057–8072, 1990.
Lockwood, M.: Modelling the high-latitude ionosphere for time-varying plasma convection, Proc. Inst. Elec. Eng. H, 140, 91– 100, 1993.
Lockwood, M.: Ionospheric signatures of pulsed magnetopause re-connection, in: Physical signatures of magnetopause boundary layer Processes, edited by: Holtet, J. A. and Egeland, A., NATO ASI Series C, Vol. 425, Kluwer, 229–243, 1994.
Lockwood, M., and Fuller-Rowell, T. J.: The modelled occurrence of non-thermal plasma in the ionospheric F-region and possible consequences for ion outflows into the magnetosphere, Geophys. Res. Lett., 14, 371–374, 1987; correction Geophys. Res. Lett., 14, 581–582, 1987.
Lockwood, M. and Carlson Jr., H. C.: Production of polar cap elec-tron density patches by transient magnetopause reconnection, Geophys. Res. Lett., 19, 1731–1734, 1992.
Lockwood, M. and Smith, M. F.: The variation of reconnection rate at the dayside magnetopause and cusp ion precipitation, J. Geo-phys. Res., 97, 14 841–14 847, 1992.
Lockwood, M. and Carlson Jr., H. C.: Reply: ionospheric effects of transient magnetopause reconnection, Geophys. Res. Lett., 21, 2337–2338, 1994.
Lockwood, M., and Davis, C. J.: The occurrence probability, width and number of steps of cusp precipitation for fully-pulsed re-connection at the dayside magnetopause, J. Geophys. Res. 100, 7627–7640, 1995.
Lockwood, M. and Davis, C. J.: On the longitudinal extent of magnetopause reconnection bursts, Ann. Geophys., 14, 865–878, 1996,
SRef-ID: 1432-0576/ag/1996-14-865.
Lockwood, M., Cowley, S. W. H., Todd, H., Willis, D. M., and Clauer, C. R.: Ion flows and heating at a contracting polar cap boundary, Planet. Space Sci., 36, 1229–1253, 1988.
Lockwood, M., Sandholt, P. E., Cowley, S. W. H., and Oguti, T.: Interplanetary magnetic field control of dayside auroral activity and the transfer of momentum across the dayside magnetopause, Planet. Space Sci., 37, 1347–1365, 1989.
Lockwood, M., Denig, W. F., Farmer, A. D., Davda, V. N., Cow-ley, S. W. H., and L¨uhr, H.: Ionospheric signatures of pulsed magnetic reconnection at the Earth’s magnetopause, Nature, 361 (6411), 424–428, 1993a.
Lockwood, M., Moen, J., Cowley, S. W. H., Farmer, A. D., Løvhaug, U.-P., L¨uhr, H., and Davda, V. N.: Variability of day-side convection and motions of the cusp/cleft aurora, Geophys. Res. Lett., 20, 1011–1014, 1993b.
Lockwood, M., Carlson Jr., H. C., and Sandholt, P. E.: The impli-cations of the altitude of transient 630 nm dayside auroral emis-sions, J. Geophys. Res., 98, 15 571–15 587, 1993c.
Lockwood, M., McCrea, I. W., Millward, G. H., Moffett, R. J., and Rishbeth, H.: EISCAT observations of ion composition and tem-perature anisotropy in the high-latitude F-region, J. Atmos. Terr. Phys., 55, 895–906, 1993d.
Lockwood, M., McCrea, I. W., Milan, S. E., Moen, J., Cerisier, J.-C., and Thorolfsson, A.: Plasma structure within poleward-moving cusp-cleft auroral transients: EISCAT Svalbard radar ob-servations and an explanation in terms of large local time extent of events, Ann. Geophys., 18, 1027–1042, 2000,
SRef-ID: 1432-0576/ag/2000-18-1027.
Lockwood, M., Opgenoorth, H. J., van Eyken, A. P., Fazakerley, A., Bosqued, J.-M., Denig, W. F., Wild, J., Cully, C., Greenwald, R. A., Lu, G., Amm, O., Frey, H., Strømme, A. , Prikryl, P., Hapgood, M. A., Wild, M. N., Stamper, R., Taylor, M., McCrea, I. W., Kauristie, K., Pulkkinen, T., Pitout, F., Balogh, A., Dunlop, M. W., R`eme, H., Behlke, R., Hansen, T., Provan, G., Eglitis, P., Morley, S. K., Alcayd´e, D., Blelly, P.-L., Moen, J., Donovan, E., Engebretson, M., Lester, M. E., Watermann, J., and Marcucci,
![Fig. 1. Logarithm of plasma concentration, log 10 [N e ], colour-coded as a function of invariant latitude and observation time, as observed along (a) beam 1 and (b) beam 2 of the EISCAT VHF radar CP-4-B experiment (see text for details)](https://thumb-eu.123doks.com/thumbv2/123doknet/14768100.589555/4.892.149.747.100.773/logarithm-concentration-function-invariant-latitude-observation-observed-experiment.webp)
![Fig. 2. Logarithm of the height-corrected plasma concentration, log 10 [f(h)N e ], colour-coded as a function of invariant latitude and obser- obser-vation time, as observed along (a) beam 1 and (b) beam 2 of the EISCAT VHF radar](https://thumb-eu.123doks.com/thumbv2/123doknet/14768100.589555/5.892.151.746.100.769/logarithm-corrected-concentration-function-invariant-latitude-observed-eiscat.webp)


![Fig. 6. Ion temperature observed along (a) azimuth 1, [T i ] 1 , and (b) along azimuth 2, [T i ] 2 , for the same interval as Fig](https://thumb-eu.123doks.com/thumbv2/123doknet/14768100.589555/11.892.151.745.91.491/fig-ion-temperature-observed-azimuth-azimuth-interval-fig.webp)
![Fig. 7. Electron temperature observed along (a) azimuth 1, [T e ] 1 , and (b) along azimuth 2, [T e ] 2 , for the same interval as Fig](https://thumb-eu.123doks.com/thumbv2/123doknet/14768100.589555/12.892.149.744.99.484/fig-electron-temperature-observed-azimuth-azimuth-interval-fig.webp)
![Fig. 8. Ten-second electron concentration ([N e ] 1 , blue) and temperature ([T e ] 1 , red) observations by the EISCAT VHF radar along beam 1, for range gates 1 (bottom) to 6 (top) at invariant latitudes 3 of 70.83 ◦ , 71.33 ◦ , 71.84 ◦ , 72.33 ◦ , 72.82](https://thumb-eu.123doks.com/thumbv2/123doknet/14768100.589555/13.892.181.738.94.895/second-electron-concentration-temperature-observations-eiscat-invariant-latitudes.webp)

![Fig. 10. Analysis of the cause of the patches. (a) The estimated MLT where field lines seen by beam 1 were reconnected, [MLT] o and (b) the integral of the square of the plasma speed between reconnection and observation at beam 1](https://thumb-eu.123doks.com/thumbv2/123doknet/14768100.589555/15.892.147.744.96.488/analysis-patches-estimated-reconnected-integral-square-reconnection-observation.webp)
