HAL Id: hal-00318200
https://hal.archives-ouvertes.fr/hal-00318200
Submitted on 21 Nov 2006
HAL is a multi-disciplinary open access
archive for the deposit and dissemination of
sci-entific research documents, whether they are
pub-lished or not. The documents may come from
teaching and research institutions in France or
abroad, or from public or private research centers.
L’archive ouverte pluridisciplinaire HAL, est
destinée au dépôt et à la diffusion de documents
scientifiques de niveau recherche, publiés ou non,
émanant des établissements d’enseignement et de
recherche français ou étrangers, des laboratoires
publics ou privés.
the MaCWAVE winter campaign ? Part II: Radar
investigations and modelling studies
A. Serafimovich, Ch. Zülicke, P. Hoffmann, D. Peters, P. Dalin, W. Singer
To cite this version:
A. Serafimovich, Ch. Zülicke, P. Hoffmann, D. Peters, P. Dalin, et al.. Inertia gravity waves in
the upper troposphere during the MaCWAVE winter campaign ? Part II: Radar investigations and
modelling studies. Annales Geophysicae, European Geosciences Union, 2006, 24 (11), pp.2863-2875.
�hal-00318200�
www.ann-geophys.net/24/2863/2006/ © European Geosciences Union 2006
Annales
Geophysicae
Inertia gravity waves in the upper troposphere during the
MaCWAVE winter campaign – Part II: Radar investigations and
modelling studies
A. Serafimovich1, Ch. Z ¨ulicke1, P. Hoffmann1, D. Peters1, P. Dalin2, and W. Singer1
1Leibniz-Institut f¨ur Atmosph¨arenphysik, K¨uhlungsborn, Germany 2Swedish Institute of Space Physics, Kiruna, Sweden
Received: 6 March 2006 – Revised: 16 September 2006 – Accepted: 18 October 2006 – Published: 21 November 2006
Abstract. We present an experimental and modelling study
of a strong gravity wave event in the upper troposphere/lower stratosphere near the Scandinavian mountain ridge. Continu-ous VHF radar measurements during the MaCWAVE rocket and ground-based measurement campaign were performed at the Norwegian Andoya Rocket Range (ARR) near An-denes (69.3◦N, 16◦E) in January 2003. Detailed gravity wave investigations based on PSU/NCAR Fifth-Generation Mesoscale Model (MM5) data have been used for compar-ison with experimentally obtained results. The model data show the presence of a mountain wave and of an inertia grav-ity wave generated by a jet streak near the tropopause re-gion. Temporal and spatial dependencies of jet induced in-ertia gravity waves with dominant observed periods of about 13 h and vertical wavelengths of ∼4.5–5 km are investigated with wavelet transform applied on radar measurements and model data. The jet induced wave packet is observed to move upstream and downward in the upper troposphere. The model data agree with the experimentally obtained results fairly well. Possible reasons for the observed differences, e.g. in the time of maximum of the wave activity, are dis-cussed. Finally, the vertical fluxes of horizontal momentum are estimated with different methods and provide similar am-plitudes. We found indications that the derived positive ver-tical flux of the horizontal momentum corresponds to the ob-tained parameters of the jet-induced inertia gravity wave, but only at the periods and heights of the strongest wave activity.
Keywords. Meteorology and atmospheric dynamics (Mesoscale meteorology; Middle atmosphere dynamics; Waves and tides)
Correspondence to: P. Hoffmann
(hoffmann@iap-kborn.de)
1 Introduction
Gravity waves are an essential part of the dynamics of the atmosphere on a wide band of meteorological scales. Propa-gating to higher altitudes, the gravity wave amplitude gener-ally increases due to the exponential decrease in atmospheric density with height, until the waves encounter their break-ing level. Here, the amplitude is so large that entailed atmo-spheric changes become irreversible and the waves deposit energy and momentum into the mean flow (Lindzen, 1981; Holton, 1982). Over the last decades, a multitude of experi-mental observations, theoretical and modelling studies have considerably improved our understanding of gravity waves and their effects on the atmosphere (e.g. Fritts, 1984, 1989; Fritts and Alexander, 2003). It is generally accepted that the main gravity wave sources in the lower and middle atmo-sphere are orographic forcing (R¨ottger, 2000), jet streams in the tropopause region (Plougonven et al., 2003; Z¨ulicke and Peters, 2006), deep convection processes (Nastrom et al., 1990; Alexander and Holton, 2004), wave-wave interactions (R¨uster, 1994), thunderstorms (Chimonas and Nappo, 1987). Orographically generated gravity waves with upward propa-gation can be expected in the presence of strong winds in the lower troposphere. However, such a meteorological situation is often coupled with strong winds in the tropopause level, which can also be associated with sub-inertial waves gener-ated from a jet in the tropopause region. This generation pro-cess has previously been shown to produces both upward and downward propagating waves (Peters et al., 2003). Hence, it is an important task to detect and quantify both mountain and jet generated inertia gravity waves.
Detailed reports on VHF radar observations of jet-induced gravity waves have been given by Thomas et al. (1999) and Pavelin and Whiteway (2002). Buss et al. (2004) report on model analyses of jet stream induced gravity waves associ-ated with polar stratospheric clouds. Recently, Hertzog et al. (2002) compared in situ observations of gravity waves using
long-duration balloons with numerical simulations on grav-ity waves during the SAGE III – Ozone Loss and Validation Experiment and Third European Stratospheric Experiment on Ozone 2000 (SOLVE/THESEO) campaign and showed a generation of gravity waves by a flow across the Norwe-gian mountains. According to their work, the mesoscale model simulations reproduce most of the observed grav-ity wave characteristics fairly well, whereas the fluctuations were significantly underestimated by the European Center for Medium-Range Weather Forecast (ECMWF) model.
In this paper we study jet generated inertia gravity waves under the presence of orographically induced waves. These investigations have been done in the frame of the MaCWAVE-project (Mountain and Convective Waves As-cending Vertically) to study the vertical propagation of the gravity waves up to the mesosphere and lower thermosphere region (Goldberg et al., 2004, 2006), using radars and lidars, supplemented by meteorological rockets and radiosondes.
In a companion paper (Part I, Hoffmann et al., 2006) we present experimental results of gravity waves in the upper troposphere/lower stratosphere at both sides of the Scandi-navian mountain ridge using continuous VHF radar mea-surements near Andenes (69.3◦N, 16◦E) and near Kiruna (67.9◦N, 21.1◦E). For the period with strongest gravity wave activity, here we selected one case study to compare experimentally obtained results with detailed gravity wave analyses based on PSU/NCAR Fifth-Generation Mesoscale Model (MM5) calculations. The application of mesoscale circulation models to the generation of mountain and jet gen-erated inertia gravity waves has been proven as useful for the interpretation of observations due to the large amount of consistent simulated data. Especially the detection and interpretation of mountain waves which are generated by a steady background flow and therefore appear as station-ary relative to a fixed ground based measurement, will be mainly supported by model simulations. Conversely, their degree of reality can be characterized from a validation with observations. This two-fold approach will be used in this study. Therefore, the main aim of this study is concentrated to check, how the mesoscale model simulations and the radar measurements fit together and complement each other.
Gravity waves strongly affect atmospheric circulation and structure by transferring momentum and energy from their sources (Holton, 1982; Fritts and VanZandt, 1993; Gavrilov et al., 1996). Measurements of the vertical trans-port of horizontal momentum are possible with aircraft-mounted systems (Lilly and Kennedy, 1973), superpressure balloons (Hertzog and Vial, 2001), mesosphere-stratosphere-troposphere (MST) radar (Fukao et al., 1988). From the ob-servational point of view, it is difficult to measure the verti-cal velocity component with a sufficient accuracy. Although radars in principle measure this quantity, the wave-attributed variations are often superimposed with noise. Additionally to the direct computation of vertical fluxes using the covari-ances between perturbations of the zonal, meridional winds,
and vertical winds, Doppler beam radars open the possibil-ity to make estimates of the momentum fluxes straightfor-ward using two tilted radial beams (Vincent and Reid, 1983). Here, the available data will be used for an intercomparison of these methods.
The paper is organized as follows. In Sect. 2 the data base used in this case study is presented. The meteorolog-ical background for the generation of mountain and inertia gravity waves is described in Sect. 3. Section 4 is devoted to the estimation of jet induced inertia gravity wave character-istics including their horizontal momentum fluxes. In Sect. 5 we discuss our main results and give concluding remarks in Sect. 6.
2 Data base
2.1 VHF radar ALWIN
We analysed data from the 53.5 MHz ALOMAR Wind (ALWIN) VHF Radar in Andenes (Latteck et al., 1999). The radar is situated at high latitudes in the vicinity of western side of the Scandinavian mountain ridge (69.2◦N, 16◦E) and measures wind parameters in the stratospheric-tropospheric (ST) mode with a resolution of 300 m in height and 2 min in time in the height range of 2–16 km, where the upper limit depends on the signal-to-noise ratio of the backscattered sig-nal. For further investigations in this work, the data are averaged over 30 min intervals. The full description of the ALWIN radar is given in a companion article (Part I, Hoff-mann et al., 2006).
2.2 Mesoscale model MM5
The MM5 model is used to examine the results de-rived from the radar measurements during 24–26 January 2003. It is a limited-area, nonhydrostatic, terrain-following sigma-coordinate model designed to simulate mesoscale and regional-scale atmospheric circulation (Dudhia, 1993; Grell et al., 1994). The simulation was centered at Andenes and covered an area of 2880 km×2880 km with a horizon-tal resolution of 24 km and a vertical resolution of 250 m. Such a configuration allows a simulation of waves with hor-izontal and vertical wavelengths larger than ∼170 km and
∼1.4 km, respectively (Z¨ulicke and Peters, 2006). The
com-plex physics run was set up with a radiative upper bound-ary condition (Zhang, 2004), Grell cumulus parametrization (Grell, 1993) and the Dudhia scheme for microphysics (Dud-hia, 1993) together with the Hong-Pan planetary boundary layer module (Hong and Pan, 1996). The USGS (United States Geological Survey) terrain data were used with spa-tial resolution of 10′. The initial and boundary conditions were constructed from the ECMWF analyses. The model run was started at 00:00 UT 23 January 2003. The resulting data fields have been recorded for each hour.
-30 -15 0 15 30 45 60 Longitude [°E] 30 40 50 60 70 80 L a ti tu d e [° N ] 8.3 8.5 8.7 8.9 9.1 9.3 9.5 G eopo tent ial he igh t [k m ] Wind vectors [m/s] 65 Andenes
Fig. 1. Wind vectors and geopotential height derived from ECMWF analysis for the 300 hPa level at 24 January 2003, 12:00 UT.
3 General meteorological situation
In order to describe the meteorological background, Fig. 1 shows wind vectors and geopotential heights derived from the ECMWF analyses at 12:00 UT on 24 January 2003 for the 300 hPa level corresponding to a height of ∼9 km.
The meteorological situation was determined by the oc-currence of a poleward downstream breaking Rossby wave (classified as P2 according Peters and Waugh, 1996). This event leads to a strong eastward directed jet near the tropopause towards the Northern Scandinavian mountains mostly south of Andenes.
3.1 ALWIN, ECMWF and MM5 local winds
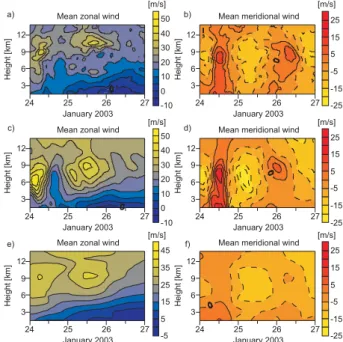
Figure 2 presents the zonal and meridional winds at Andenes measured by the ALWIN radar (Fig. 2, upper panel), the out-put of the MM5 model (Fig. 2, middle panel) and results de-rived from the ECMWF analysis (Fig. 2, lower panel). MM5 model and ALWIN radar show good agreement in both loca-tion and timing of the background winds. However, in com-parison with the ECMWF data, the advantage to investigate smaller-scale phenomena with mesoscale models is evident due to their higher temporal and vertical resolution suitable for the reproduction of winds and their variations measured by radar observations.
3.2 Wave diagnostics
The MM5 model captures the mesoscale structure quite well. Inertia gravity waves are associated with deviations from the geostrophic equilibrium. Therefore the horizontal divergence is used as an indicator for a gravity wave field. It is com-monly written in Cartesian coordinates
∇H · v =
∂u ∂x+
∂v
∂y 6= 0, (1)
Fig. 2. Mean zonal and meridional winds at Andenes measured by the radar (a, b), derived from the MM5 model (c, d) and from the ECMWF analysis (e, f) from 24–26 January 2003.
where u and v are the zonal and meridional components of the vector wind field v along the horizontal axes x and y, respectively.
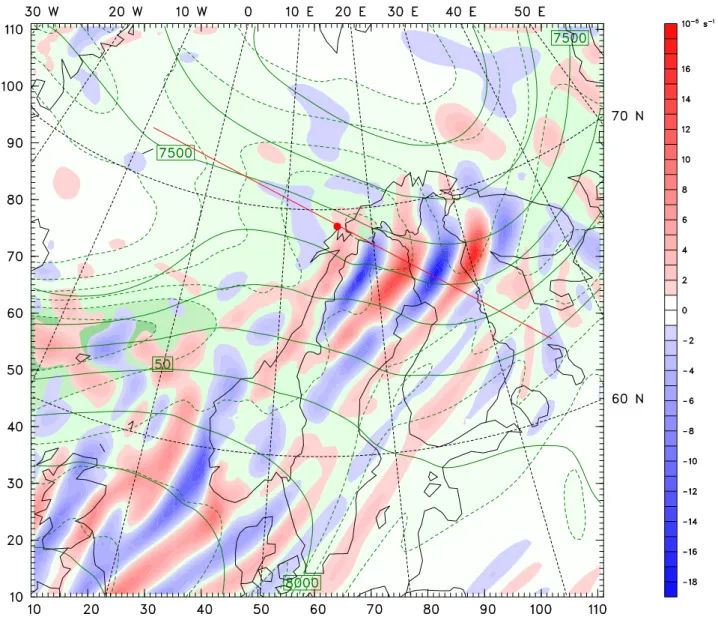
The pattern of the horizontal divergence derived for 24 January 2003 at 04:00 UT from MM5 model simulations are shown as horizontal map at about 16 km height in Fig. 3 to-gether with the wind speed and geopotential height at about 8 km and indicates strong wave activity above Scandinavia with apparent horizontal wavelengths of about 200 km. The red line in Fig. 3 marks the location of the vertical cross sec-tion presented in Fig. 4 with the bold dot at the posisec-tion of Andenes.
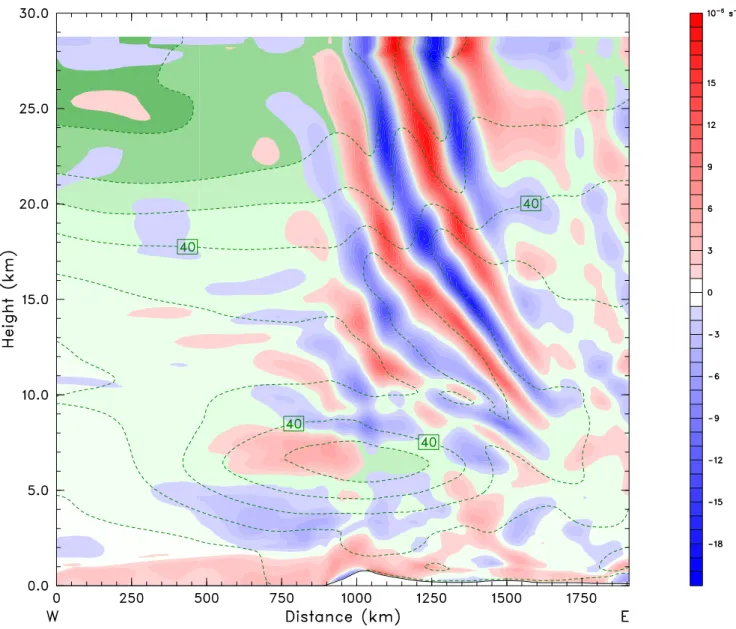
With reference to the vertical profile of the MM5 model (Fig. 4) we see in the divergence pattern clear signals of a stationary mountain wave with a vertical wavelength of 8– 10 km which is practically dominant above ∼12 km height. They appear as upstream upwards inclined structures corre-sponding to upward propagating energy which also confirms the character of a mountain wave. The observed changes of their phase angles above ∼17 km height can be caused by changes of the background winds (Fritts and Alexander, 2003) or by variations of the wavenumbers.
This structure is slightly deformed at the tropopause level at about ∼9 km height. Above and below the jet, flatter waves are also evident in Fig. 4. They are clearly seen down-stream the mountains and weakly updown-stream. These waves have vertical wavelengths in the order of 3 km. According to Peters et al. (2003), there are propagating away from the jet. The inspection of the temporal development of the wave
Fig. 3. Horizontal map with wind speed (dotted green) and geopotential height of 350 hPa (∼ 8 km) combined with divergence (blue/red) at 100 hPa (∼ 16 km) derived for 24 January 2003 at 04:00 UT from MM5 simulations. The red line marks the location of the vertical cross section presented in Fig. 4 with the bold dot at the position of Andenes. The upper and right axis show latitude and longitude, while left and lower axis show the number of meridional and zonal model grid points (horizontal resolution = 24 km).
patterns (not shown here) revealed wave packets propagat-ing upwards in the stratosphere and downwards in the tro-posphere. Hence, the energy source of such inertia gravity waves is the tropospheric jet streak. Therefore, these waves are termed “jet generated waves” (Peters et al., 2003).
The rotary spectrum is an appropriate method to describe the presence of atmospheric gravity waves, their vertical wavelengths and to get hints on their energies and vertical propagation directions (Thompson, 1978; Guest et al., 2000). This method has been used by Peters et al. (2003) to diagnose an inertia gravity wave generated by a tropospheric jet dur-ing a Rossby wave breakdur-ing event. The application on radar measurements has been described in detail by Serafimovich et al. (2005) and in the frame of the MaCWAVE winter
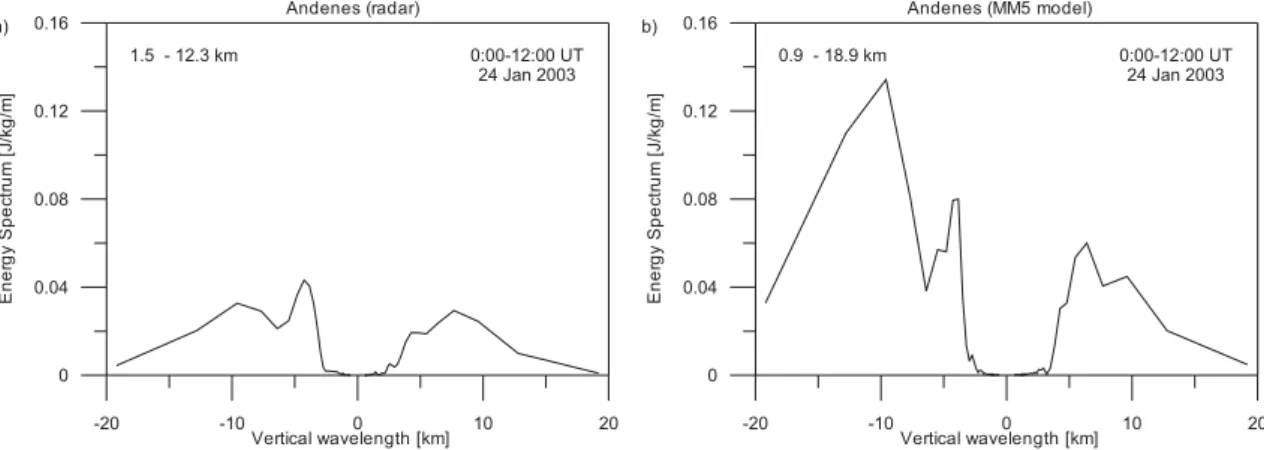
cam-paign by Hoffmann et al. (2006). In Sect. 4.2 we will apply this method in more detail to investigate the jet generated waves. But at first, we describe the vertical structure influ-enced by both types of waves, generated by the mountains and by the upper tropospheric jet. Therefore, the rotary spec-tra have been created for the ALWIN radar data from 1.5– 12.3 km (Fig. 5a) and for the model data from 0.9–18.9 km (Fig. 5b) without any filtering in the vertical direction, but only filtered in time for periods between 8–18 h in order to reduce the influence of the jet observed with periods of about 24–36 h (Fig. 2). The band pass-filter has been realized by application of the Fourier transformation technique.
The results from 24 January 2003 indicate the presence of two waves. Unfortunately, the radar profile did not reach
Fig. 4. Vertical cross section of the horizontal divergence (negative blue, positive red) and the wind speed (dotted green contours each 10 ms−1) along the line through Andenes (see red line in Fig. 3) derived for 24 January 2003 at 04:00 UT from MM5 simulations.
high enough to sample the strong mountain wave appearing most clearly above 12 km. The flatter wave with a vertical wavelength of 4 km appears with its downward component and corresponds to the model results (Figs. 4 and 5b), while the upward component (above the jet) was not sampled by the radar.
Corresponding to Fig. 4, the higher negative peaks in the model data (Fig. 5b) with a vertical wavelength of about
∼10 km describe the dominating upward propagating
moun-tain wave. Additionally, the peaks with a vertical wavelength of about ∼5 km indicate the presence of an inertia gravity wave. The intensity of these peaks is not very different, prob-ably caused by the contribution of both, upward and down-ward propagation of these waves above and below the jet maxima. In the next section we will investigate these waves in more detail.
4 Jet generated inertia gravity waves
Normally, the wind perturbations are analyzed as superpo-sition of atmospheric waves with different frequencies. In order to estimate inertia gravity wave parameters, individual waves have to be separated with objective statistical methods.
4.1 Wavelet analysis
In order to detect the presence of a wave in the data, a wavelet transform has been applied (Torrence and Compo, 1998; Zink and Vincent, 2001). This technique is becom-ing a common tool for analyzbecom-ing localized variations due to their possibilities to resolve the waves in frequency domain as well as in time or height.
Fig. 5. Results of rotary spectra derived from vertical profiles of horizontal winds at Andenes from ALWIN radar data in the height range 1.5–12.3 km (left) and MM5 model data in the height range 0.9–18.9 km (right). The spectra are averaged for 12 h starting from 00:00 UT, 24 January 2003. The band-pass filtering has been used only in the time domain for periods from 8–18 h.
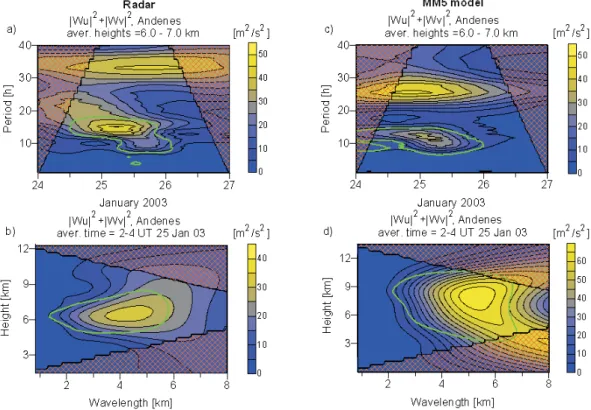
Wavelet transforms have been applied on time series of the zonal and meridional winds for constant height ranges as well as on wind profiles versus height for fixed time intervals. The significance of the results depends on the mother wavelet and the sample length, which is reduced at the boundaries of the time and height intervals, respectively. To minimize such border effects, we decided to apply the Paul wavelet on the wind profiles due to their short record lengths. This wavelet leads to a better height localization of the dominant vertical wavelengths and smaller influences of the border effects, as shown by Torrence and Compo (1998). For the wavelet trans-forms of time series for constant heights the Morlet wavelet has been applied resulting in a better frequency localization of the dominant observed periods. With the Morlet wavelet the influence of limited data on the borders are larger in com-parison with the Paul wavelet, but there are no problems to extend the time series. Details of the choice of the wavelet function can be found in Torrence and Compo (1998). More information on the methods used here are given in Serafi-movich et al. (2005). From the averaged wavelet power spec-tra of the zonal and meridional winds of both, experimental and model data, we estimated the dominant observed periods and vertical wavelengths. The wavelet transform of the radar data measured at Andenes (Fig. 6, left panel) shows a signifi-cant wave with an observed period of about 10–13 h (Fig. 6a) and a vertical wavelength of 4–5 km (Fig. 6b). Similar struc-tures have been found in the averaged wavelet power spec-tra of the zonal and meridional winds obtained by the model (Figs. 6c, d). The wavelet spectrum of time series averaged in height (Fig. 6c) shows a significant wave event during 00:00– 12:00 UT at 25 January 2003 with an observed period of
∼13 h, whereas the wavelet spectrum applied to vertical
pro-files of horizontal winds (Fig. 6d) averaged in time detects a significant vertical wavelength of ∼5 km. Consequently, this information has been used to construct appropriate filter for the estimation of wind perturbations.
4.2 Rotary spectrum
As already discussed in Sect. 3.2, the calculation of the ro-tary spectrum allows directly to estimate the vertical direc-tion of energy propagadirec-tion. To identify a possible source of the gravity wave, Fig. 7 shows the rotary spectra derived from vertical profiles of horizontal winds from ALWIN radar (left) and MM5 model (right) data. In contrast to Fig. 5, a two-dimensional band-pass filtering was applied to the data with a bandwidth of 8–18 h in time and 2–8 km in height to ex-clude the influence of the dominating mountain wave. The rotary spectra of the radar data in the height range 3–9 km are shown in the left part of Fig. 7. The dominance of the negative parts in the spectra indicates a downward energy propagation in the troposphere. Unfortunately, the radar pro-file did not reach high enough to describe the propagation of the gravity wave above the jet. Figure 7 (right) repre-sents the rotary spectra derived from the model simulations, again in the height range 3–9 km (solid line) and, additional, from 9–15 km (dashed line). The difference in the negative and positive parts of the spectra indicates a downward energy propagation in the troposphere and an upward energy propa-gation in the lower stratosphere. This gives us the evidence of the gravity wave generation by the jet streak in the upper troposphere.
4.3 Stokes analyses
In order to provide a more statistical description of the wave field, we use the Stokes-parameter technique, intro-duced by Vincent and Fritts (1987) and improved by Eck-ermann and Vincent (1989). This technique assumes that any given vertical profile of horizontal velocity perturbations,
(u′(z), v′(z)), contains a partially polarized wave field. The
four Stokes parameters are defined as total variance I , axial anisotropy D, “in-phase” covariance P associated with linear polarization, and “in quadrature” covariance Q associated
Fig. 6. The wavelet spectra of horizontal winds from ALWIN radar measurements (a, b) and MM5 model output (c, d). The upper panel (a, c) shows the Morlet wavelet transform of the time series averaged over the altitude ranges 6–7 km. The lower panel (b, d) shows the averaged in time Paul wavelet transforms of vertical profiles of horizontal winds. The bold green line outlines the region with 95% significance level, the red shaded area indicates the zones where boundary effects appear.
Fig. 7. Rotary spectra derived from vertical profiles of horizontal winds in the height range 3–9 km (solid line) and 9–15 km (dashed line) at Andenes. The spectra are averaged for 9 h starting from 15:00 UT, 25 January 2003. The ALWIN radar data (left) and MM5 model data (right) have been used after band-pass filtering with bandwidth of 8–18 h in time and 2–8 km in height.
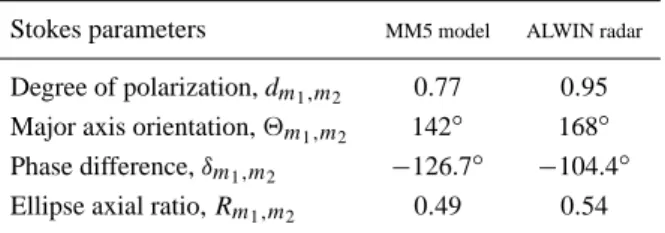
with the circular polarization of the gravity wave. Based on the Stokes parameters of the wave field, the phase differ-ence δ between zonal and meridional wind perturbations, the major axis orientation 2, and the averaged ellipse axial ra-tio R are estimated from the radar measurements and MM5 model output for the altitude range from 3–9 km (Table 1).
According to the results of the wavelet analyses (Fig. 6), here the Stokes parameters are calculated for vertical wave-lengths between 3.2–9.6 km for the model data, whereas ver-tical wavelengths between 3.8–6.4 km have been used for the radar measurements.
Table 1. Stokes parameters derived from MM5 model output and radar measurements for the altitude range from 3–9 km at Andenes on 25 January 2003 after band pass-filtering with bandwidths of 8– 18 h in time and 2–8 km in height.
Stokes parameters MM5 model ALWIN radar
Degree of polarization, dm1,m2 0.77 0.95
Major axis orientation, 2m1,m2 142◦ 168◦
Phase difference, δm1,m2 −126.7◦ −104.4◦
Ellipse axial ratio, Rm1,m2 0.49 0.54
From the total variance I (not shown here), we found the maximum energy in the model data at 15:00–16:00 UT on 25 January, whereas the radar data showed the peak of the wave activity on 25 January 6 h earlier.
The main representative characteristics of gravity waves are their intrinsic frequency ˆω, horizontal khand vertical m
wavenumbers, phase υpand group cgvelocities. The
estima-tion of these values is based on the soluestima-tion of the three equa-tions, polarization, dispersion and Doppler equation (Eqs. 2– 4) using the polarization ellipse ratio R, the horizontal ori-entation of wave propagation 2 estimated by the Stokes-parameter analysis as well as the observed frequency ωob
and the vertical wavenumber m. Corresponding to Zink and Vincent (2001), we adopt here the convention of a positive intrinsic frequency ˆω. The polarization relation (Eq. 2)
in-cluding the wind shear term ∂ ¯V /∂z can be used to find an
expression for the axis ratio R
R = fc ˆ ω − kh m ˆω ∂V ∂z , (2)
where fc is the Coriolis frequency. Here the vertical wind
shear effect in the background wind, as introduced by Hines (1989), is included by the term ∂V∂z, where V denotes the mean horizontal wind component perpendicular to the wave propagation.
The dispersion relationship is given by
ˆ ω2= fc2+N 2k2 h m2 − 2f kh m ∂V ∂z, (3)
where N is Brunt-V¨ais¨al¨a frequency here selected with a typ-ical value of 0.013 s−1for tropospheric heights.
While the Stokes analysis reveals the wave orientation 2, the direction of the horizontal wave vector still must be spec-ified. The Doppler relationship connecting the observed fre-quency ωoband the intrinsic frequency ˆω of the gravity wave
is given by
ωob= khU + ˆω, (4)
where U is the mean background horizontal wind compo-nent given in the same orientation as horizontal wavenum-ber kh. From the analysis of the rotary spectrum (Sect. 4.2,
Fig. 7) we found a downward energy propagation in the troposphere, hence m is positive. From the Hovm¨oller-diagram (not shown here) we deduce an observed frequency
ωob=2π/(13h), consistent to the wavelet spectra (Fig. 6).
The analysis of Eq. (4) reveals two solutions: a down-stream wave in slow winds (kh>0, U ∼−10 ms−1) and an
upstream wave in fast winds (kh<0, U ∼20 ms−1). Due to
the dominating westerly winds of about u=25 ms−1, the lat-ter solution is adopted, also in agreement with the already in Sect. 3.2 discussed wave propagation away from the jet (Peters et al., 2003). The wave orientation is slightly dis-torted by 38◦ with respect to the dominating flow in the zonal direction. The component projected onto the wave is
U =25· cos(38◦)=20 ms−1, and this is the number retrieved form the Doppler equation. Hence, the modelled inertia grav-ity wave packet in the upper troposphere moves upstream downward.
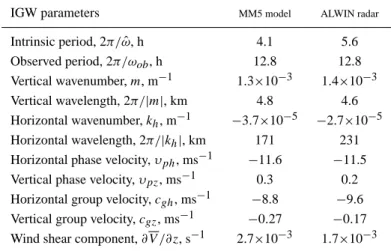
The derived gravity waves parameters are presented in Ta-ble 2.
The analysis of the gravity wave with an observed period
Tob of ∼13 h and a vertical wavelength of ∼4.8 km in the
model data leads to an intrinsic period Tinof about 4.1 h and
a horizontal wavenumber of 3.7×10⁻⁵m−1, corresponding to a horizontal wavelength of 171 km.
The analysis of radar measurements gives an intrinsic pe-riod of gravity wave in the order of 5.6 h, a horizontal wave-length of 231 km, and a vertical wavewave-length of ∼4.6 km. The horizontal and vertical wavenumbers are negative and positive, respectively, reflecting the discussed upstream and downward propagation of the wave packet.
The wave characteristics derived from radar measurements and model output are in a good agreement. Both, observa-tions and simulaobserva-tions indicate a wave propagation to north-west and differ by only 26◦.
4.4 Momentum flux due to gravity waves
4.4.1 Direct approach, symmetric-beam and hybrid meth-ods
Gravity waves transport momentum from energy sources. These processes are characterized by the momentum fluxes which can be measured by ground based radars with symmetric-beam and hybrid methods or with the direct ap-proach method. The separation of noise and wave related variation presents a special problem for the following anal-ysis. Too high noise levels prevented the analysis of strato-spheric data. Therefore, we are focussing here on the influ-ence of the jet induced inertia gravity waves (Table 2) on the momentum fluxes and restricted our analysis to the height range 4–10 km. Further, the momentum fluxes are suscep-tible to the effects of outliers, which can easily dominate the derived results. Following the suggestion of Dutta et al. (2005a) the outliers have been removed by analysis of 1-h mean wind sections with rejection of values exceeding 1.7
Table 2. Gravity waves parameters derived from the results of the Stokes-parameter analysis as shown in Table 1 for the MM5 model output and radar measurements at Andenes.
IGW parameters MM5 model ALWIN radar
Intrinsic period, 2π/ ˆω, h 4.1 5.6 Observed period, 2π/ωob, h 12.8 12.8 Vertical wavenumber, m, m−1 1.3×10⁻³ 1.4×10⁻³ Vertical wavelength, 2π/|m|, km 4.8 4.6 Horizontal wavenumber, kh, m−1 −3.7×10⁻⁵ −2.7×10⁻⁵ Horizontal wavelength, 2π/|kh|, km 171 231
Horizontal phase velocity, υph, ms−1 −11.6 −11.5
Vertical phase velocity, υpz, ms−1 0.3 0.2
Horizontal group velocity, cgh, ms−1 −8.8 −9.6
Vertical group velocity, cgz, ms−1 −0.27 −0.17
Wind shear component, ∂V /∂z, s−1 2.7×10⁻³ 1.7×10⁻³
times the standard deviation. The linear interpolation has been used to fill up the data gaps in height profiles of mea-sured winds. Similar to Worthington and Thomas (1996), we have reduced the influence of the mean winds and of the mountain waves by a Lanczos-low-pass filter which passes periods smaller than 36 h and vertical wavelengths less than 7 km to separate the estimated inertia gravity waves with ver-tical wavelengths of about 4–5 km in order to derive the wind perturbations u′, v′, w′. In the direct method, the vertical fluxes of zonal and meridional momentum are estimated by averaging of the product u′w′ and v′w′ over a defined time interval.
In the symmetric-beam method of Vincent and Reid (1983) the momentum flux in a vertical plane is obtained using two radial radar beams pointing at symmetric zenith angles +θ and −θ : u′w′|sym= υE2 − υ2 W 2 sin 2θ , (5) v′w′| sym= υN2 − υ2 S 2 sin 2θ , (6)
where υN,υS,υE,υW represent radial perturbations velocities
in the north, south, east and west directions, respectively. Another approach, the hybrid method, was proposed by Worthington and Thomas (1996) and is based on measure-ments of the vertical wind perturbations directly and the hor-izontal winds using a pair of radial beams:
u′w′| hyb= w(υE− υW) 2 sin θ , (7) v′w′| hyb= w(υN− υS) 2 sin θ . (8) 4.4.2 Flux estimates
From the winds measured by the ALWIN radar at Andenes we calculated vertical fluxes of horizontal momenta. Figure 8 presents the time development of vertical fluxes of zonal (up-per panel) and meridional (lower panel) momenta derived by direct approach (black), symmetric-beam (red) and hybrid (blue) methods at altitudes between 4–10 km corresponding the appearance of the strongest wave activity, as e.g. demon-strated with the wavelet spectra (Fig. 6).
The symmetric-beam, the hybrid methods and the direct method provide similar amplitudes of the momentum fluxes. The time dependence of the vertical flux of zonal momen-tum shows an increase of flux magnitude on 25 January from 12:00–24:00 UT between 6 and 8 km. During this period, the strongest inertia gravity wave activity has been used to derive the wave parameters (Table 2) as described in Sect. 4.3. Note that the amplitudes are smaller in comparison to the results of gravity wave momentum fluxes recently derived by Dutta et al. (2005b), probably caused by the used filter routine.
Following Fritts and Alexander (2003) and relations (40), (41) therein, the vertical flux of horizontal momentum is pro-portional to the vertical group velocity and horizontal wave number (u′w′, v′w′) ∼ c gz E ˆ ω(k, l), (9)
were E denotes the energy of the gravity wave. This relation is used here for a discussion of the orientation of the waves and related fluxes. From our analyses (Table 2) we found on 25 January a negative horizontal wave number and negative vertical group velocity corresponding to a downward energy propagation result, so that we can explain the derived positive vertical flux of the horizontal momentum in the zonal direc-tion on 25 January from 12:00–24:00 UT between 6 and 8 km with the obtained wave parameters. To separate the influence
-0.08 -0.04 0 0.04 0.08 u'w' (m2/s2) 4 6 8 10 he ight (k m ) averaged time 25 Jan 03, 12:00 - 24:00 UT -0.08 -0.04 0 0.04 0.08 v'w' (m2/s2) 4 6 8 10 he ight (k m ) -0.08 -0.04 0 0.04 0.08 u'w' (m2/s2) 4 6 8 10 he ight (k m ) averaged time 24 Jan 03, 12:00 - 24:00 UT -0.08 -0.04 0 0.04 0.08 v'w' (m2/s2) 4 6 8 10 he ight (k m ) -0.08 -0.04 0 0.04 0.08 u'w' (m2/s2) 4 6 8 10 he ight (k m ) averaged time 25 Jan 03, 00:00 - 12:00 UT -0.08 -0.04 0 0.04 0.08 v'w' (m2/s2) 4 6 8 10 he ight (k m ) -0.08 -0.04 0 0.04 0.08 u'w' (m2/s2) 4 6 8 10 he ight (k m ) averaged time 26 Jan 03, 00:00 - 12:00 UT -0.08 -0.04 0 0.04 0.08 v'w' (m2/s2) 4 6 8 10 he ight (k m )
Fig. 8. Vertical fluxes of zonal (upper panel)and meridional (lower panel) momenta derived from the radar measurements at Andenes in January 2003 using direct approach (black), symmetric-beam (red) and hybrid (blue) methods.
of both observed mountain and jet induced gravity waves on the total flux, future investigations are still necessary.
For comparisons between vertical fluxes of horizontal mo-menta derived from ALWIN radar measurements and the MM5 model data, the direct approach method has been ap-plied on the model simulations due to missing off-zenith ra-dial wind perturbations in the model data. Here the same re-moval of the running averages over 36 h has been used to get wind perturbations u′, v′, w′. However, the averaged abso-lute amplitudes of vertical fluxes of the horizontal momenta from MM5 model data are approximately half the amplitudes of fluxes derived from ALWIN radar measurements. This confirms the smaller peaks in the rotary spectrum from MM5 model data (Fig. 7).
5 Discussion
5.1 Mountain and jet generated waves
Detailed analysis of the rotary spectra from the ALWIN radar measurements and MM5 simulations (Fig. 5) indicate the ap-pearance of both mountain and jet generated waves. The up-ward propagating wave with a vertical wavelength of ∼10 km could be attributed to a nearly stationary mountain wave sat-isfying the relevant condition, e.g. (Smith, 1989)
2π/|m| ∼ 2π U /N ∼ 10 km (10)
with U =20 ms−1. Waves with the detected shorter vertical wavelength of (∼5 km) are related to the upper tropospheric jet due to their upward propagation in the stratosphere and their downward propagation in the troposphere. Note, that the Scandinavian mountain ridge is oriented to the north-east and mountain waves would align perpendicular to the ridge.
A detailed study of jet generated waves revealed their ma-jor propagation was to north-west. Furthermore, the momen-tum flux was in nearly the same direction and transported momentum in flow direction away from the jet. The waves did not propagate straight upstream but slightly distorted. Such a distortion has also been observed in analyses of jet generated waves over Northern Germany in December 1999 (Z¨ulicke and Peters, 2006). A possible explanation would be the regulation of the angular momentum of the curved jet streak by inertia gravity waves. Hence, this question requires further investigation.
In this study we compared radar observations and model simulations at the position of Andenes. The occurrence of both mountain and jet-induced inertia gravity waves, as proved in Sect. 4.2 offers a possibility for a study of both wave types. The rotary spectra of the MM5 data (Fig. 5) suggest that the energy of the mountain waves is five times higher than the energy of jet generated waves. This results is different to a study of inertia gravity waves in the German lowlands (Z¨ulicke and Peters, 2006), where orographically generated waves had similar energy as jet induced waves.
Insofar, the position of Andenes was clearly dominated by mountain waves with additional contributions from jet gen-erated waves. The joint analysis with observations at Kiruna at the downstream side of the Scandinavian ridge (see the companion paper Part I, Hoffmann et al., 2006, Fig. 8) shows the pregnant modification of the wave properties. The anal-ysis of the relevant processes in the synoptic situation of a poleward breaking Rossby wave is matter of future studies.
5.2 Radar observation
Due to its ability to measure continuously 3-D winds using height and time resolutions adapted to gravity wave param-eters, ALWIN VHF radar has been used to identify gravity waves, to consider their height and time dependencies, and to separate simultaneously existing waves. The main charac-teristics of jet induced gravity waves have been determined using rotary and Stokes-parameter spectra and evaluating the dispersion and polarization equations. As results, an intrin-sic period of gravity wave in the order of 5.6 h, a horizontal wavelength of 231 km, and a vertical wavelength of ∼ 4.6 km have been determined. The horizontal and vertical wavenum-bers are negative and positive, respectively, reflecting the dis-cussed upstream and downward propagation of the jet in-duced wave packet. The obtained wave propagation direc-tions away from the jet are similar to those obtained in pre-vious studies by Peters et al. (2003) and Serafimovich et al. (2005) based on observations in Northern Germany.
Furthermore, the radar measurements have been used to estimate the vertical fluxes of the horizontal momenta. Three methods have been applied to derive the momentum flux. All they revealed similar results. The estimation of variances from averaged time series revealed detailed information on the height dependence of fluxes. In order to investigate the impact of the jet induced inertia gravity waves (Table 2) on the momentum fluxes, we restricted our analysis to the height range 4–10 km and reduced possible influences of the back-ground winds and of the mountain waves by filtering meth-ods. As noted in Sect. 4.3, the parameters of the inertia grav-ity wave with a vertical wavelength of 4–5 km (Table 2) have been derived from the radar data during the period of the strongest wave activity on 25 January, resulting in a down-ward energy propagation. The derived positive vertical flux of the horizontal momentum in the zonal direction on 25 Jan-uary from 12:00–24:00 UT between 6 and 8 km corresponds to the obtained wave parameters so that we found indications that the derived vertical fluxes of horizontal momentum is mainly determined by the jet induced inertia gravity waves. However, the results are relatively weak and concentrated only to restricted altitudes and periods, probably caused by the additional influence of convection and frontal passages. The separation of the influence of mountain waves and of jet-induced gravity waves on the total flux, remains matter of future studies.
5.3 Model simulations
The inertia gravity waves simulated with the MM5 model showed reasonable agreement with radar observations. This confirms that a vertical resolution of 250 m is sufficient to resolve mountain and jet generated gravity waves.
A detailed analysis of timing and location of the wave event showed that it appeared over Andenes 6 h later than observed. This might be attributed to the internal dynamics of the model, which is forced with 6 hourly ECMWF analy-ses at the lateral boundaries 1440 km away from the domain center. Hence, a realistic background could well be slightly deformed at such a distance.
Another finding is that the amplitudes of model-derived fluxes are approximately half the amplitudes of fluxes de-rived from ALWIN radar measurements. This difference can be attributed to damping by the model internal diffu-sion as analyzed by Z¨ulicke and Peters (2006). Hence, a further increase of model resolutions could reveal more real-istic wind amplitudes. The diagnosed difference in wave di-rection could be attributed to the different background wind (see Fig. 2). During the time window (00:00–24:00 UT at 24 January 2003) the wind direction changed abruptly. Further, the timing of the strongest wind and associated wave activity was different by 6 h. Hence, a perfect agreement of the time series can not be expected.
6 Conclusions
Inertia gravity waves were found in the upper tropo-sphere/lower stratosphere during the winter MaCWAVE campaign. Significant portions of waves could be attributed to mountains and the tropospheric jet. Hence, both types of waves are present in situations with strong westerly winds in troposphere and lower stratosphere and require considera-tion.
Inertia gravity wave properties such as wavelength, ampli-tudes, propagation and associated momentum flux could be coherently diagnosed in ALWIN radar and the MM5 model data. Consequently, both observation and modelling have proved their capability for the analysis of such processes.
Another question is how the wave spectrum looks down-stream the mountain ridge and how the mountain and jet generated waves contribute to the vertical flux of horizontal momentum. VHF radar measurements give a good opportu-nity to investigate gravity waves due to the used high tem-poral and vertical resolutions, whereas the model analyses support these studies to get more insight in the atmospheric processes.
The shown consistency of the results derived from both, the mesoscale model simulations and the radar measure-ments, allows to combine their advantages in future detailed investigations, e.g. to separate pure standing mountain waves identified by the analysis of vertical winds and to investigate
their possible interactions with jet induced inertia gravity waves near the Scandinavian mountain ridge.
Acknowledgements. The authors thank their colleagues for the
sup-port to operate the VHF radars, additionally supsup-ported by an “Ac-cess to the ALOMAR research infrastructure” project CT-2003-506208 of the European Community. The MM5 user support at NCAR is acknowledged as well as the data supply from ECMWF via the German Meteorological Service “Deutscher Wetterdienst” (DWD).
Topical Editor U.-P. Hoppe thanks P. Chilson and another ref-eree for their help in evaluating this paper.
References
Alexander, M. J. and Holton, J. R.: On the spectrum of vertically propagating gravity waves generated by a transient heat source, Atmos. Chem. Phys., 4, 923–932, 2004,
http://www.atmos-chem-phys.net/4/923/2004/.
Buss, S., Herzog, A., Hostettler, C., Bui, T. P., L¨uthi, D., and Wernli, H.: Analysis of a jet stream induced gravity wave associated with an observed stratospheric ice cloud over Greenland, Atmos. Chem. Phys., 4, 1183–1200, 2004,
http://www.atmos-chem-phys.net/4/1183/2004/.
Chimonas, G. and Nappo, C. J.: A thunderstorm bow wave, J. At-mos. Sci., 44, 533–541, 1987.
Dudhia, J.: A nonhydrostatic version of the Penn State-NCAR mesoscale model: Validation tests and simulation of an atlantic cyclone and cold front, Mon. Wea. Rev., 121, 1493–1513, 1993. Dutta, G., Bapiraju, B., Rao, P. V., Sheeba, A. I., Kumar, M. C. A., Balasubrahmanyam, P., and Basha, H. A.: Comparison of grav-ity wave momentum fluxes estmated by different methods us-ing mesosphere-stratosphere-troposphere radar, Radio Sci., 40, RS4009, doi:10.1029/2004RS003031, 2005a.
Dutta, G., Rao, P. V., Kumar, M. C. A., Kumar, P. V., Basha, H. A., Anandan, V. K., and Ghosh, A. K.: On the optimum time of in-tegration for estimation of momentum flux from VHF radar data, Geophys. Res. Lett., 32, L15811, doi:10.1029/2005GL023777, 2005b.
Eckermann, S. and Vincent, R.: Falling sphere observations grav-ity waves motions in the upper stratosphere over Australia, Pure Appl. Geophys., 130, 509–532, 1989.
Fritts, D. C.: Gravity wave saturation in the middle atmosphere: A review of theory and observations, Rev. Geophys. Space Phys., 22, 275–308, 1984.
Fritts, D. C.: A review of gravity wave saturation processes, effects, and variability in the middle atmosphere, Pure Appl. Geophys., 130, 343–317, 1989.
Fritts, D. C. and Alexander, M. J.: Gravity wave dynamics and effects in the middle atmosphere, Rev. Geophys., 41(1), 1003, doi:10.1029/2001RG000106, 2003.
Fritts, D. C. and VanZandt, T. E.: Spectral estimates of gravity wave energy and momentum fluxes. Part I: Energy dissipation, accel-eration and constraints, J. Atmos. Sci., 50, 3685–3694, 1993. Fukao, S., Sato, T., Tsuda, T., Kato, S., Inaba, M., and Kimura, I.:
VHF Doppler radar determination of the momentum flux in the upper troposphere and lower stratosphere: Comparison between the three- and four-beam methods, J. Atmos. Ocean. Technol., 5, 57–69, 1988.
Gavrilov, N. M., Fukao, S., Nakamura, T., Tsuda, T., Yamanaka, M. D., and Yamamoto, M.: Statistical analysis of gravity waves observed with the middle and upper atmosphere radar in the mid-dle atmosphere 1. Method and general characteristics, J. Geo-phys. Res., 101(D23), 29 511–29 521, 1996.
Goldberg, R., Fritts, D., Williams, B., L¨ubken, F.-J., Rapp, M., Singer, W., Latteck, R., Hoffmann, P., M¨ullemann, A., Baum-garten, G., Schmidlin, F., She, C.-Y., and Krueger, D.: The MaCWAVE/MIDAS rocket and ground-based measurements of polar summer dynamics: Overview and mean state structure, Geophys. Res. Lett., 31, L24S02, doi:10.1029/2004GL019411, 2004.
Goldberg, R., Fritts, D., Schmidlin, F., Williams, B., Croskey, C., Mitchell, J., Friedrich, M., III, J. R., Blum, U., and Fricke, K.: The MaCWAVE program to study gravity wave influences on the polar mesosphere, Ann. Geophys., 24, 1159–1173, 2006, http://www.ann-geophys.net/24/1159/2006/.
Grell, G., Dudhia, J., and Stauffer, D. R.: A description of the fifth-generation Penn-State/NCAR mesoscale model (MM5), Techni-cal Report TN-398+IA, NCAR, 1994.
Grell, G. A.: Prognostic evaluation of assumptions used by cumulus parameterizations, Mon. Wea. Rev., 121, 764–787, 1993. Guest, F. M., Reeder, M. J., Marks, C. J., and Karoly, D. J.:
Inertia-gravity waves observed in the lower stratosphere over Macquarie Island, J. Atmos. Sci., 57, 737–752, 2000.
Hertzog, A. and Vial, F.: A study of the dynamics of the equa-torial lower stratosphere by use of ultra-long-duration balloons 2. Gravity waves, J. Geophys. Res., 106(D19), 22 745–22 761, 2001.
Hertzog, A., Vial, F., D¨ornbrack, A., Eckermann, S. D., Knud-sen, B. M., and Pommereau, J.-P.: In situ observations of grav-ity waves and comparison with numerical simulations during the SOLVE/THESEO 2000 campaign, J. Geophys. Res., 107(D20), 8292, doi:10.1029/2001JD001025, 2002.
Hines, C. O.: Tropopausal mountain waves over Arecibo: A case study, J. Atmos. Sci., 46, 476–488, 1989.
Hoffmann, P., Serafimovich, A., Peters, D., Dalin, P., Goldberg, R., and Latteck, R.: Inertia gravity waves in the upper tropo-sphere during the MaCWAVE winter campaign, Part I: Obser-vations with collocated radars, Ann. Geophys., 24, 2851–2862, 2006,
http://www.ann-geophys.net/24/2851/2006/.
Holton, J. R.: The role of gravity wave induced drag and diffusion in the momentum budget of the mesosphere, J. Atmos. Sci., 39, 791–799, 1982.
Hong, S.-Y. and Pan, H.-L.: Nonlocal boundary layer vertical dif-fusion in a medium-range forecast model, Mon. Wea. Rev., 124, 2322–2339, 1996.
Latteck, R., Singer, W., and Bardey, H.: The ALWIN MST radar – technical design and performance, in: Proceedings of the 14th ESA Symposium on European Rocket and Balloon Programmes and Related Research, Potsdam, Germany (ESA SP-437), edited by: Kaldeich-Sch¨urmann, B., pp. 179–184, ESA Publications Division, 1999.
Lilly, D. K. and Kennedy, P. J.: Observations of a stationary moun-tain wave and its associated momentum flux and energy dissipa-tion, J. Atmos. Sci., 30, 1135–1152, 1973.
Lindzen, R. S.: Turbulence and stress owing to gravity wave and tidal breakdown, J. Geophys. Res., 86, 9707–9714, 1981.
Nastrom, G. D., Peterson, M. R., Green, J. L., Gage, K. S., and van Zandt, T. E.: Sources of gravity wave activity seen in the vertical velocities observed by the Flatland VHF radar, J. Appl. Meteorol., 29, 783–792, 1990.
Pavelin, E. and Whiteway, J.: Gravity wave interactions around the jet stream, Geophys. Res. Lett., 29(21), 2024, doi:10.1029/2002GL015783, 2002.
Peters, D. and Waugh, D. W.: Influence of barotropic shear on the poleward advection of upper-tropospheric air, J. Atmos. Sci., 53, 3013–3031, 1996.
Peters, D., Hoffmann, P., and Alpers, M.: On the appearance of inertia gravity waves on the north-easterly side of an anticyclone, Meteor. Z., 12, 25–35, 2003.
Plougonven, R., Teitelbaum, H., and Zeitlin, V.: Inertia gravity wave generation by the tropospheric midlatitude jet as given by the Fronts and Atlantic Storm-Track Experiment, J. Geophys. Res., 108(D21), 4686, doi:10.1029/2003JD003535, 2003. R¨ottger, J.: ST radar observations of atmospheric waves over
moun-tainous areas: A review, Ann. Geophys., 18, 750–765, 2000, http://www.ann-geophys.net/18/750/2000/.
R¨uster, R.: VHF radar observations of nonlinear interactions in the summer polar mesosphere, J. Atmos. Terr. Phys., 56, 1289–1299, 1994.
Serafimovich, A., Hoffmann, P., Peters, D., and Lehmann, V.: In-vestigation of inertia-gravity waves in the upper troposphere / lower stratosphere over Northern Germany observed with collo-cated VHF/UHF radars, Atmos. Chem. Phys., 5, 295–310, 2005, http://www.atmos-chem-phys.net/5/295/2005/.
Smith, R. B.: Hydrostatic air flow over mountains, Adv. Geophys., 31, 1–38, 1989.
Thomas, L., Worthington, R., and McDonald, A. J.: Inertia-gravity waves in the troposphere and lower stratosphere, Ann. Geophys., 9, 115–121, 1999,
http://www.ann-geophys.net/9/115/1999/.
Thompson, R. O. R. Y.: Observation of inertial waves in the strato-sphere, Quart. J. Roy. Meteorol. Soc., 104, 691–698, 1978. Torrence, C. and Compo, G. P.: A practical guide to wavelet
analy-sis, Bull. Amer. Meteorol. Soc., 79, 61–78, 1998.
Vincent, R. and Fritts, D.: A climatology of gravity wave motions in the mesopause region at Adelaide, Australia, J. Atmos. Sci., 44, 748–760, 1987.
Vincent, R. A. and Reid, I. M.: HF Doppler Measurements of Meso-spheric Gravity Wave Momentum Fluxes, J. Atmos. Sci., 40, 1321–1333, 1983.
Worthington, R. and Thomas, L.: The measurement of gravity waves momentum flux in the lower atmosphere using VHF radar, Radio Sci., 31, 1501–1517, 1996.
Zhang, F.: Generation of mesoscale gravity waves in upper-tropospheric jet-front-systems, J. Atmos. Sci., 61, 440–457, 2004.
Zink, F. and Vincent, R.: Wavelet analysis of stratospheric grav-ity wave packets over Macquarie Island, J. Geophys. Res., 106, 10 275–10 288, 2001.
Z¨ulicke, C. and Peters, D.: Inertia-gravity waves driven by a pole-ward breaking Rossby wave, J. Atmos. Sci., in press, 2006.