HAL Id: inserm-00483879
https://www.hal.inserm.fr/inserm-00483879
Submitted on 17 May 2010
HAL is a multi-disciplinary open access
archive for the deposit and dissemination of
sci-entific research documents, whether they are
pub-lished or not. The documents may come from
teaching and research institutions in France or
abroad, or from public or private research centers.
L’archive ouverte pluridisciplinaire HAL, est
destinée au dépôt et à la diffusion de documents
scientifiques de niveau recherche, publiés ou non,
émanant des établissements d’enseignement et de
recherche français ou étrangers, des laboratoires
publics ou privés.
moleculare interneurons to operate at theta frequency.
Miri Goldin, Jérôme Epsztein, Isabel Jorquera, Alfonso Represa, Yehezkel
Ben-Ari, Valérie Crépel, Rosa Cossart
To cite this version:
Miri Goldin, Jérôme Epsztein, Isabel Jorquera, Alfonso Represa, Yehezkel Ben-Ari, et al.. Synaptic
kainate receptors tune oriens-lacunosum moleculare interneurons to operate at theta frequency..
Jour-nal of Neuroscience, Society for Neuroscience, 2007, 27 (36), pp.9560-72.
�10.1523/JNEUROSCI.1237-07.2007�. �inserm-00483879�
Cellular/Molecular
Synaptic Kainate Receptors Tune Oriens-Lacunosum
Moleculare Interneurons to Operate at Theta Frequency
Miri Goldin, Je´roˆme Epsztein, Isabel Jorquera, Alfonso Represa, Yehezkel Ben-Ari, Vale´rie Cre´pel, and Rosa Cossart
Institut de Neurobiologie de la Me´diterane´e, Inserm, Unite´ 29, Universite´ de la Me´diterrane´e, Parc Scientifique de Luminy, 13273 Marseille cedex 9, FranceGABAergic interneurons of the hippocampus play an important role in the generation of behaviorally relevant network oscillations.
Among this heterogeneous neuronal population, somatostatin (SOM)-positive oriens-lacunosum moleculare (O-LM) interneurons are
remarkable because they are tuned to operate at theta frequencies (6 –10 Hz)
in vitro and in vivo. Recent studies show that a high
proportion of glutamatergic synapses that impinge on O-LM interneurons are mediated by kainate receptors (KA-Rs). In the present
study, we thus tested the hypothesis that KA-Rs transmit afferent inputs in O-LM neurons during synaptic stimulation at theta frequency.
We combined multibeam two-photon calcium imaging in hippocampal slices from SOM– enhanced green fluorescent protein (EGFP)
mice, to record the activity of SOM cells as well as hundreds of neurons simultaneously, and targeted electrophysiological recordings and
morphological analysis to describe the morphofunctional features of particular cells. We report that EGFP-positive O-LM neurons are the
only subtype of interneuron that reliably follows synaptic stimulation of the alveus in the theta frequency range. Electrophysiological
recordings revealed the crucial contribution of KA-Rs to the firing activity and to the glutamatergic response to theta stimuli in O-LM cells
compared with other cell types. The reliable activation of O-LM cells in the theta frequency range did not simply result from the longer
kinetics of KA-R-mediated postsynaptic events (EPSP
KA) but presumably from a specific interaction between EPSP
KAand their intrinsic
active membrane properties. Such preferential processing of excitatory inputs via KA-Rs by distally projecting GABAergic microcircuits
could provide a key role in theta band frequency oscillations.
Key words: kainate; O-LM; theta; imaging; interneuron; network
Introduction
GABAergic cells control the generation of network oscillations
(Cobb et al., 1995; Freund and Buzsa´ki, 1996; Whittington et al.,
1997; McBain and Fisahn, 2001; Klausberger et al., 2003;
Whit-tington and Traub, 2003; Somogyi and Klausberger, 2005). A
central issue is to understand how different GABAergic circuits
integrate ongoing activity to generate behaviorally relevant
oscil-lations. Recent studies suggested that the integrative properties of
interneurons are strongly influenced by their synaptic inputs
(Pouille and Scanziani, 2004; Oren et al., 2006). Glutamatergic
synaptic transmission is principally mediated by AMPA
recep-tors, but kainate receptors (KA-Rs) also play a central role
(Castillo et al., 1997; Vignes and Collingridge, 1997; Cossart et al.,
1998, 2002; Frerking et al., 1998; Bureau et al., 1999) although in
a manner that is remarkably cell specific (Ben Ari and Cossart,
2000; Lerma, 2003). Various types of interneurons express KA-Rs
(Cossart et al., 1998, 2002; Frerking et al., 1998; Mulle et al., 2000;
Ali, 2003; Lerma, 2003); however, the distribution of
KA-R-operated synaptic transmission among GABAergic cells is still
unknown. This is important in view of the slower kinetics of
KA-versus AMPA-R-mediated EPSCs (Frerking et al., 1998; Cossart
et al., 2002), which could enable the generation of oscillations
with different dominating frequencies (Frerking and
Ohliger-Frerking, 2002). Therefore, the KA-R subtype is well suited to
mediate cell-specific temporal information processing in
inter-neurons, but its functional distribution and precise conditions of
activation remain to be determined.
We addressed this issue using multibeam two-photon
micros-copy, on-line analysis, and electrophysiology, to record
electri-cally evoked network dynamics and describe the distribution of
active cells (Cossart et al., 2005). We concentrated on CA1
somatostatin-expressing stratum oriens interneurons and
specif-ically on oriens-lacunosum moleculare (O-LM) cells, the
pre-dominant horizontal cell type in this layer (Ali and Thomson,
1998; Maccaferri, 2005). These neurons participate in
hippocam-pal theta activity in vivo (Buzsaki, 2002; Klausberger et al., 2003)
and in vitro (Pike et al., 2000; Gillies et al., 2002; Hajos et al., 2004;
Gloveli et al., 2005). They also receive a large input mediated by
KA-Rs (Cossart et al., 2002). To target this subpopulation, we
used transgenic mice expressing enhanced green fluorescent
pro-tein (EGFP mice) in a subset of somatostatin-containing
inter-neurons [EGFP-positive (EGFP
⫹)] that mostly comprise O-LM
cells in the CA1 stratum oriens (Oliva et al., 2000). We report that
O-LM neurons reliably follow theta stimulation (TS) of the
Received Oct. 11, 2006; revised June 25, 2007; accepted June 26, 2007.
This work was supported by grants from Inserm, the Ville de Marseille and Region Provence Alpes Coˆte d’Azur, and Fondation pour la Recherche sur le Cerveau. R.C. and A.R. were supported by Centre National de la Recherche Scientifique. M.G. was supported by Fondation pour la Recherche Me´dicale and the Marie Curie Fellowship. We thank L. Sasportas and C. Alle`ne for their participation in Neurolucida reconstructions. We thank D. Aronov for designing the imaging data analysis software.
Correspondence should be addressed to Dr. Rosa Cossart, Institut de Neurobiologie de la Me´diterrane´e, Inserm, Unite´ 29, Parc Scientifique de Luminy, Boıˆte Postale 13, 13273 Marseille cedex 9, France. E-mail: cossart@inmed.univ-mrs.fr.
DOI:10.1523/JNEUROSCI.1237-07.2007
alveus, an effect selectively mediated by KA-R synaptic activation.
Stratum oriens interneurons that did not follow theta stimulation
via KA-R activation were perisomatic (O-P), bistratified (O-Bi),
or septum/back-projecting (O-S/BP) cells but not O-LM
neu-rons. Electrophysiological recordings from EGFP-positive/
O-LM neurons showed that postsynaptic KA-Rs contribute to
action potential firing at 10 Hz during theta stimulations.
Short-term facilitation or summation of the postsynaptic response in
O-LM cells were not observed in the theta frequency range. The
reliable activation of O-LM cells by theta frequency stimulations
did not simply result from the longer kinetics of KA-R-operated
synaptic transmission but presumably from a specific interaction
between the postsynaptic response and intrinsic membrane
properties. These findings should support the recruitment of
O-LM cells during hippocampal theta activity and provide a
syn-aptic framework for the mechanisms driving theta rhythms.
Materials and Methods
Slice preparation and two-photon imaging. Transverse hippocampal slices (350m thick) were prepared from 12- to 17-d-old transgenic mice expressing EGFP in somatostatin-containing neurons (Oliva et al., 2000) using a Microm (Walldorf, Germany) tissue slicer (Microtome HM 650V) with ice-cold oxygenated modified artificial CSF (ACSF) (0.5 mM
CaCl2and 7 mMMgSO4and in which NaCl was replaced by an equimolar
concentration of choline). Slices were then transferred for rest (⬃1 h) at room temperature in oxygenated regular ACSF containing the following (in mM): 126 NaCl, 3.5 KCl, 1.2 NaH2PO4, 26 NaHCO3, 1.3 MgCl2, 2.0
CaCl2, and 10D-glucose, pH 7.4. For AM loading, slices were incubated
in a small vial containing 2.5 ml of oxygenated ACSF with 25l of a 1 mM
fura-2 AM solution (in 100% DMSO; Invitrogen, Carlsbad, CA) for 20 –30 min. Slices were incubated in the dark, and the incubation solu-tion was maintained at 35–37°C. Experiments were performed at 30 – 32°C with regular ACSF and continuously aerated with 95% O2/5% CO2.
Imaging was performed with a multibeam two-photon LASER scanning system (Trimscope; La Vision Biotec, Bielefeld, Germany) coupled to an Olympus Optical (Hamburg, Germany) microscope. This system is based on a patented beam splitter that splits up the incoming femtosec-ond LASER beam (provided by a titanium:sapphire LASER source; Cha-meleon; Coherent, Santa Clara, CA), into 64 beamlets, which are scanned simultaneously in the slice. This results in 64 times higher image acqui-sition rates compared with conventional multiphoton scanning micro-scopes. Images were acquired through a CCD camera (Imager 3QE; La Vision Biotec). Acquisition frequency was between 150 and 210 ms per frame. Slices were imaged using a low-magnification, high numerical aperture (NA) objective (20⫻, NA 0.95; Olympus Optical). The size of the imaged field was typically⬃430 ⫻ 380 m2. Calcium and GFP
fluorescence signals were separated by the excitation wavelength of the LASER source (780 and 900 nm, respectively).
Electrical stimulation. Axons of CA1 pyramidal cells were stimulated via a custom-made bipolar NiCh electrode (model 762000; A-M Systems, Sequim, WA) placed⬃100m from the imaged region in the alveus (intensity of 5–10A, 50 s). A Grass Instrument (Qunicy, MA) stimu-lation unit was used (model SIU5B). The TS protocol included 10 stimuli delivered at a frequency of 10 Hz every 30 s. Action potential firing triggered by antidromic activation resulting from the direct stimulation of the cell membrane by the electrode was discarded from the analysis. Antidromically evoked calcium events, i.e., events that were not blocked by antagonists of ionotropic GABAergic and glutamatergic transmission, were also systematically discarded.
Analysis. Analysis was performed with custom-made software in Mat-lab (MathWorks, Natick, MA) written by D. Aronov (Massachusetts Institute of Technology, Cambridge, MA). We developed a program aimed at the automatic identification of loaded hippocampal cells and at measuring their fluorescence as a function of time. This program is an improved version of the previously designed software for cortical slices analysis (Cossart et al., 2003). We encountered two major problems for an automatic identification of cells in an image: (1) variations in
back-ground fluorescence, which precluded the use of a uniform threshold value throughout the image, and (2) the inability of a simple thresholding procedure to separate nearby cells. The latter problem was especially severe in the dense pyramidal cell layer of the hippocampus. As before (Cossart et al., 2003), we solved the problem of background variations by normalizing each pixel by the average fluorescence in its vicinity. We also convolved the image with a two-dimensional Gaussian ( ⫽ 6 m), which emphasized circular neuronal shapes and partially separated nearby neurons. A threshold (usually top 10 percentile of the overall pixel fluorescence distribution) was applied to the image to separate cell con-tours from the background. To complete the separation of nearby cells, we measured a circularity threshold for every contour, defined as c⫽ P2/(4 A), where P is the perimeter and A is the area of a contour. High
values of c (usually⬎4) identified highly noncircular shapes usually in-dicative on unseparated cell contours. Local fluorescence maxima were identified within such contours, and the contours were separated into a corresponding number of concave shapes. All image processing was per-formed on time averages of recorded movies. The calcium signal of each cell was the average fluorescence within the contour of that cell, mea-sured as a function of time. Signal processing algorithms from the Mini-Analysis software (Synaptosoft, Decatur, GA) were used to detect auto-matically the onsets and offsets (time of half-amplitude decay) of calcium signals within the traces of individual cells. Calcium changes below 5% DF/F were discarded because calibration of the imaging system showed that, on average, a single action potential will produce a fluorescence change always above this value (average DF/F, 6.5⫾ 0.5%). The entire procedure could be performed on-line sufficiently quickly to identify cells for targeted patch-clamp recordings. However, fluorescence traces were also visually scanned off-line to correct for the detection of false positives. A signifi-cant calcium response to a TS is an event that passed the threshold for detection within a 400 ms time window after the time of the stimuli. The analysis was performed separately for each hippocampal layer, with the borders between layers drawn manually.
Electrophysiology. Slices from EGFP mice were prepared as for imaging except that a few recordings were also performed in 1-month-old ani-mals (n⫽ 3). Interneurons recorded for miniature glutamatergic activity analysis were visualized by infrared video microscopy using an upright Zeiss (Le Pecq, France) microscope equipped with a 40⫻ water immer-sion objective. Fluorescent interneurons were identified with a UV lamp (xenon, excitation filter 470/40) and recorded using a pipette solution containing: (1) in voltage-clamp mode, 120 mMCs-gluconate, 10 mM
MgCl2, 0.1 mMCaCl2, 1 mMEGTA, 5 mMNa2adenosine triphosphate, 10
mMHEPES, and 0.5% biocytin; (2) in current-clamp mode, 130 mM
K-methylSO4, 5 mMKCl, 5 mMNaCl, 10 mMHEPES, 2.5 mMMg-ATP,
0.3 mMGTP, and 0.5% biocytin. The osmolarity was 265–275 mOsm, pH
7.3. Microelectrodes had a resistance of 4 – 8 M⍀. Uncompensated series resistances were, on average, 14 M⍀.
Signals were fed to an EPC10 (HEKA Elektronik, Heidelberg, Ger-many), filtered (3 kHz), digitized (10 kHz) with a Labmaster interface card to a personal computer, and acquired using Axoscope 7.0 software (Molecular Devices, Union City, CA). Data was analyzed with Mini-Analysis 5.1 program (Synaptosoft). Spontaneous glutamatergic cur-rents were measured at⫺60 mV and miniature EPSC (mEPSCs) were recorded in the presence of TTX (1M), bicuculline (10M), andD-APV
(40M). Addition of GYKI 52466 [4-(8-methyl-9H-1,3-dioxolo
[4,5-h][2,3]benzodiazepin-5-yl)-benzenamine hydrochloride] (100M) or
2,3-dihydroxy-6-nitro-7-sulfonyl-benzo[f]quinoxaline (NBQX) (1M)
blocked AMPA-R-mediated-mEPSCs (mEPSCAMPA), and further
addi-tion of CNQX (50M) blocked all mEPSCs. Single and averaged events
(200 events per cell) were fully characterized: rise times (10 –90%), am-plitudes, and decay time constants were calculated.
Kinetic analysis. Identification of KA-R-mediated-mEPSCs (mEPSCKA)
and mEPSCAMPAwas based on their kinetics profile (Cossart et al., 2002). Briefly, spontaneous mEPSCAMPA/KA(in the presence of 1MTTX, 10
Mbicuculline, and 40M D-APV) were recorded from CA1 stratum
oriens interneurons, and each single event was fully characterized by the following parameters: rise time (10 –90%), amplitude, charge (area un-der EPSCs), and decay time constants. In control conditions, two types of mEPSCs could be distinguished based on the time course of their decay:
fast and slow. After 10 min application of AMPA-R antagonists (100M
GYKI 52466 or 1MNBQX), fast events were abolished and only
KA-R-mediated events with a slower time course and a small amplitude re-mained. Slow events were blocked by SYM 2081 [(2S,4 R)-4-methylglutamic acid], a functional antagonist for KA-Rs that required 15 min drug application. Decay times of slow events in control and mEP-SCKAleft after blocking mEPSCAMPAhad the same kinetics (n⫽ 17
interneurons; one-way ANOVA, p⬎ 0.05), demonstrating that slow kinetics events were KA-R mediated. To separate fast mEPSCAMPAfrom
slow mEPSCKA, a “kinetic limit” was determined. Events were
individu-ally fitted, and decay times were plotted versus rise times and versus amplitudes. Fast mEPSCAMPAand slow mEPSCKAclustered in two
dis-tinct areas of these scattered plots. Limits to segregate between the two populations of events were as follows: mEPSCAMPA, rise-time⬍1 ms and
decay time⬍4 ms; mEPSCKA, rise time⬎1 ms and decay time ⬎4 ms.
Pharmacology. Bicuculline, NBQX,D-APV, CNQX, GYKI 52466, and
SYM 2081 were purchased from Tocris (Ellisville, MO), TTX was from Latoxan (Valence, France), and CX546 [1-(1,4-benzodioxan-6-ylcarbonyl) piperidine] was from Sigma-Aldrich (Lyon, France).
Morphology. Slices were processed for the detection of biocytin-filled neurons according to a previously established procedure (Cossart et al., 2006). Briefly, slices were fixed overnight at 4°C in a solution containing 4% paraformaldehyde in 0.1Mphosphate buffer (PB), pH 7.4. After
fixation, slices were rinsed in PB, cryoprotected in sucrose (30% in PBS), and quickly frozen on dry ice. To neutralize endogenous peroxidase, slices were pretreated for 30 min in 1% H2O2. After several rinses in 0.01
MPBS, pH 7.4, slices were incubated for 24 h at room temperature, in
1:100 avidin– biotin peroxidase complex (Vector Laboratories, Burlin-game, CA) diluted in PBS containing 0.3% Triton X-100. After 30 min rinses in PBS, slices were processed with 0.04% 3–3 ⬘-diaminobenzidine-HCl (Sigma, St. Louis, MO) and 0.006% H2O2diluted in PBS.
Seventy-eight biocytin-filled interneurons were identified. Among these 78 inter-neurons, we could obtain both a complete characterization of mEPSCs/ EPSPs and a complete axonal and dendritic labeling from 72 interneurons. Neurons were classified based on previously established morphological criteria. We classified as O-S/BP interneurons with ax-onal branches invading the CA3 region (stratum oriens and/or stratum radiatum) and possibly the dentate gyrus and/or axonal branches travel-ing through the alveus and reachtravel-ing the fimbria (see Figs. 3, 7). This population is likely to comprise at least two different cell types (i.e., septum and BP interneurons) that essentially differ by their septal inner-vation. We decided to group them because both were shown to innervate specifically GABAergic interneurons in the hippocampus (Gulyas et al., 2003) and because they are hardly morphologically differentiable in hip-pocampal slices: they display an axonal arborization that crosses subfield boundaries and sparsely spiny dendrites (a property that distinguishes them from O-LM cells with a cut axon). These interneurons were recon-structed for morphometric analysis with a computer-assisted system (Neurolucida; MicroBrightField, Williston, VT) attached to a Nikon (Tokyo, Japan) microscope.
Results
CA1 stratum oriens EGFP-positive cells are activated by
theta stimulation
We used multibeam two-photon imaging in hippocampal
slices from EGFP mice, loaded with a calcium indicator to
determine the network dynamics evoked by repetitive (30 s
interval) electrical TS (train of 10 stimuli at 10 Hz; see
Mate-rials and Methods). Stimulation electrodes were placed in the
alveus
⬃100
m away from the imaged area (Fig. 1). Activity
was monitored in hundreds of neurons simultaneously,
span-ning across all CA1 hippocampal layers. We performed
auto-mated signal processing with custom-made software to obtain
raster plots describing the activity of all neurons imaged as a
function of time (Figs. 1, 2). A 5% DF/F amplitude threshold
was chosen for calcium signal detection (more than five times
larger than the noise SD) because calibration of the imaging
system showed that a single action potential produced, on
average, a fluorescence change always above this value (Fig. 1)
(see Materials and Methods). Detected calcium events were
indeed dependent on action potential firing because they were
Figure 1. Imaging evoked network dynamics in the CA1 region from somatostatin–EGFP mice. A, Two-photon calcium fluorescence image of the CA1 region from an EGFP mouse hippocampal slice at postsynaptic day 13 (excitation wavelength, 780 nm; time resolution, 219 ms/frame). B, EGFP⫹ neurons were identified within the same slice (excitation wavelength, 900 nm). C, Automatically detected contours of the cells imaged above; green filled contours indicate EGFP⫹neurons. Dashed lines specify layer borders. o, Stratum oriens; r, stratum radiatum; p, stratum pyramidale. Scale bar, 100m.D,SchematicdrawingoftheexperimentalsetupindicatingtheimagedareainCA1(dashed), the positions of the recording patch pipette (in the oriens), and of the stimulating electrode (in the alveus, outside the field of the imaged frame); slices were activated with the TS protocol (trains of 10 stimuli at 10 Hz every 30 s). E, Trace of the average calcium fluorescence change in single EGFP⫺ (black) and EGFP⫹(green) cells during a TS protocol. Detected calcium responses correspond to relative fluorescence changes with amplitude above 5% DF/F as shown in the corresponding raster plots. Each arrow indicates a train of 10 stimuli at 10 Hz. F, Correlation between the amplitude of the calcium signal and evoked action potentials. Left graph plots the amplitude of the evoked calcium signal as a function of the number of action potentials evoked by depolarizing current steps in a CA1 stratumoriensinterneuron.Righttracesshowcurrent-clamprecordingsandsimultaneouslyrecorded calcium fluorescence changes (same imaging conditions as in A) resulting from one and two evoked actionpotentials.Thedashedlineindicatesthe5%DF/Fthresholdusedforautomaticeventdetection. Error bars indicate SEMs.
blocked by the sodium channel blocker TTX (1
M; n
⫽ 3
movies, 259 cells; data not shown). Evoked calcium events
could be triggered by either an EPSP or antidromic activation
producing action potential firing. Antidromic activation
re-sulted from the direct electrical stimulation of the cell
mem-brane and therefore was not blocked by antagonists of
iono-tropic synaptic transmission. Antidromically evoked calcium
events were discarded from the analysis (see Materials and
Methods). We quantified the response of imaged neurons to
TS protocols by calculating a “calcium response probability”
per imaged neuron that is the fraction of TS trains within the
course of the experiment that evoked a detected calcium event
in the cell (i.e., a calcium signal above the 5% DF/F detection
threshold). Cells that could never be activated during the TS
protocol were discarded. Such calcium response probability
thus indirectly quantifies the fraction of TS trains evoking at
least one action potential. We found that, in control
condi-tions, calcium response probability was 100
⫾ 0% in all
EGFP
⫹cells (n
⫽ 21) and 27 ⫾ 7% in EGFP-negative
(EGFP
⫺) cells (n
⫽ 884 neurons, 7 movies; p ⬍ 0.001) (Fig. 2).
Response probability in EGFP
⫺cells was not different
be-tween layers (39
⫾ 7% in stratum
pyra-midale vs 24
⫾ 11% in stratum oriens
and 28
⫾ 11% in stratum radiatum; p ⬎
0.1, Mann–Whitney test; n
⫽ 8 movies)
but was always significantly lower than
in EGFP
⫹cells, most of which were
lo-cated in stratum oriens. We next
per-formed targeted cell attached recordings
from EGFP
⫹cells to measure action
po-tential firing in these neurons. In
keep-ing with imagkeep-ing experiments, EGFP
⫹cells fired at least one action potential in
response to each TS train (99
⫾ 1% of
trains evoked at least one action
poten-tial; n
⫽ 98 trains, 10 EGFP
⫹neurons)
(Fig. 2). Furthermore, these experiments
showed that EGFP
⫹cells also reliably
followed every single stimulation within
trains because spike probability for the
first stimulus was 77
⫾ 25% and
re-mained stable during the train (spike
probability for the fifth stimulus was
84
⫾ 22%; n ⫽ 8 EGFP
⫹neurons; p
⫽
0.53, Mann–Whitney test). Spike latency
(measured as the delay between the
stim-ulus artifact and the action potential
on-set) was 11.2
⫾ 1.9 ms (n ⫽ 10 EGFP
⫹cells) (Fig. 2). The spike jitter was
rela-tively large, suggesting that the response
was driven by an EPSP with slow kinetics
(1.7 ms jitter; n
⫽ 8 EGFP
⫹cells) (Pouille
and Scanziani, 2004). We conclude that CA1
stratum oriens EGFP
⫹neurons respond to
synaptic stimulations at theta frequency.
This property distinguishes them from other
CA1 neurons. Because KA-Rs represent a
significant contribution to the glutamatergic
influx received by CA1 stratum oriens
inter-neurons (Cossart et al., 1998, 2002), we next
asked whether KA-Rs could mediate such
se-lective synaptically evoked response.
KA-Rs are major contributors to the spontaneous
glutamatergic currents received by O-LM cells
As a first step, we quantified the contribution of KA-Rs to
gluta-matergic transmission in different cell types without
pharmaco-logical manipulation. We performed whole-cell voltage-clamp
recordings of glutamatergic activity in 13 EGFP
⫹and 33 EGFP
⫺interneurons in the CA1 stratum oriens using biocytin-filled
elec-trodes. Six CA1 stratum oriens interneurons were also recorded
in wild-type mice (Table 1).
EPSC
KAcan be distinguished from EPSC
AMPAsolely on the
basis of their kinetics profile (Cossart et al., 2002; Epsztein et al.,
2005). We thus determined the kinetic properties of EPSCs and
focused on action potential-independent mEPSCs, which
repre-sent quantal events that are particularly suited for kinetic analysis
(Cossart et al., 2002; Epsztein et al., 2005). Miniature EPSCs were
recorded in the presence of the sodium channel blocker TTX (1
M) at the reversal potential for GABAergic currents (V
hold,
⫺60
mV). The rise and decay time constants were calculated for each
miniature event. mEPSCs amplitude, frequency, and charge were
also quantified (Table 2). We included only interneurons that
could be fully morphologically identified (Fig. 3) (n
⫽ 40): O-LM
Figure 2. EGFP-positive neurons preferentially respond to theta stimulation. A1, Raster plot of the activity from a movie; filled arrows mark the TS stimulation times. Each row represents the activity within a cell, and each dot represents the onset of a calcium transient. Antidromically activated neurons were discarded. A2, Contour plot of the neurons that fluorescence traces are shown in
A3 (black filled). Green filled contour indicates a EGFP⫹neuron. Scale bar, 100m. A3, Representative calcium fluorescence traces during a TS protocol in control conditions (green, EGFP⫹neurons; black, EGFP⫺neurons). Note the evoked responses to every stimulus in the EGFP⫹neuron. o, Stratum oriens; r, stratum radiatum; p, stratum pyramidale. B1, Targeted cell-attached recordings from an EGFP⫹cell in response to 10 alveus stimulations in control ACSF (2 consecutive trains of stimulation separated by 30 s; open arrows mark each stimulation within a TS train). Note that each stimulation within the train drove the cell to fire an action potential (1 spike is indicated by a large filled arrow; enlarged in B2). Average spike probability as a function of stimulus number is plotted on the bottom histogram. Error bars indicate SEMs. B2, Representative superimposed cell-attached recordings of action potentials evoked in response to a train of 10 consecutive alveus stimulations in an EGFP⫹cell (10 Hz). Latency histogram of the recorded cell is plotted below. C, Bar graphs of the mean calcium response probability (fraction of trains within a stimulation protocol that evoked a suprathreshold calcium response; antidromic stimulation was discarded) in response to TS protocol in EGFP⫹(dark green; n⫽ 21) and EGFP⫺(black; n⫽ 884) cells. Note that mean action potential probability (fraction of stimuli evoking an action potential) assessed by targeted cell-attached recordings in EGFP⫹cells (n⫽10;lightgreen)issimilar to the calcium response probability measured in the same cell population. The calcium response probability was significantly higher in EGFP⫹cells compared with EGFP⫺cells (Mann–Whitney test, ***p⬍ 0.001).
cells (n
⫽ 20); O-P cells (n ⫽ 11) (Harris et al., 1985; Kosaka et al.,
1985; Maccaferri et al., 2000; McBain and Fisahn, 2001), O-Bi
cells (n
⫽ 5) (Sik et al., 1995), and O-S/BP interneurons (n ⫽ 4)
(Sik et al., 1995; Gulyas et al., 2003) (see Materials and Methods).
As detailed in our previous studies (Cossart et al., 2002; Epsztein
et al., 2005), mEPSC
KAwere identified in each recording based on
their kinetics and pharmacological properties (Fig. 3) (see
Mate-rials and Methods) to determine their relative contribution to the
global miniature glutamatergic influx for each cell type. We
found that the decay time constants of averaged mEPSCs in
O-LM cells were slower (6.1
⫾ 0.2 ms; n ⫽ 20; p ⬍ 0.001) than
those in O-P (3.6
⫾ 0.5 ms; n ⫽ 11) and O-Bi (2.8 ⫾ 0.3 ms; n ⫽
5) interneurons. In O-S/BP interneurons, there was a larger
vari-ability of kinetics between cells (5.4
⫾ 1.3 ms; n ⫽ 4). The
differ-ence in decay times was unlikely to result from different KA-R or
AMPA-R subunit compositions between interneuron types
be-cause decay times for mEPSC
KAor mEPSC
AMPAwere not
signif-icantly different between cell types (Table 2).
We then determined the relative contribution of
KA-R-mediated synaptic currents in different types of interneurons. We
found that mEPSC
KAaccounted for a large majority of the total
quantal glutamatergic influx in the O-LM cell type as opposed to
other neurons. Thus, mEPSC
KArepresented 88
⫾ 2% (n ⫽ 20)
(Fig. 3) of the total quantal glutamatergic activity on O-LM
neu-rons but less than half (43
⫾ 6%, n ⫽ 11 and 38 ⫾ 6%, n ⫽ 5) (Fig.
3) of the activity in O-P and O-Bi interneurons, respectively. In
O-S/BP neurons, there was also less contribution of KA-R to
miniature activity (57
⫾ 7%; n ⫽ 4) although the values were
more variable most likely attributable to the weaker reliability of
the morphological characterization of this cell type (see above).
We conclude that synaptic KA-Rs are differentially distributed
among CA1 stratum oriens interneurons and represent the major
source of the ongoing glutamatergic influx received by O-LM
cells.
A selective processing of postsynaptic glutamatergic
responses evoked at theta via KA-Rs in O-LM cells
We next asked whether the differential distribution of KA-Rs
among interneuron subtypes could account for the reliable
acti-vation of EGFP
⫹cells during TS protocols. We first isolated
KA-R-mediated responses in the presence of NMDA and GABA
Areceptor antagonists (control conditions: response probability in
EGFP
⫹and EGFP
⫺cells was not significantly different from
drug-free saline), relying on their resistance to AMPA-R
antago-nists (GYKI 52466 at 100
Mor NBQX at 1
M) (Paternain et al.,
1995; Bureau et al., 1999) (see Materials and Methods) and
block-ade by the mixed AMPA/KA-R antagonist CNQX (50
M).
Im-aging experiments indicated that, in the presence of AMPA-R
antagonists, calcium response probability was significantly
higher in EGFP
⫹than EGFP
⫺neurons (58
⫾ 17 vs 9 ⫾ 6%,
respectively; n
⫽ 8 EGFP
⫹cells, n
⫽ 884 neurons imaged; p ⬍
0.05). Furthermore, blockade of AMPA-Rs significantly reduced
response probability in EGFP
⫺cells relative to control in all
lay-ers (reduction to 33
⫾ 4% of control; p ⬍ 0.05) (Fig. 4), whereas
probability in EGFP
⫹cells was also reduced but not significantly
(to 65
⫾ 18% of control; p ⬎ 0.05) (Fig. 4). However, relative
changes in probability resulting from AMPA-R blockade were
not significantly different when comparing EGFP
⫹and EGFP
⫺cells ( p
⫽ 0.3, Mann–Whitney test). Indeed, two subpopulations
of EGFP
⫹neurons could be distinguished in conditions in which
synaptic excitation was provided only by KA-Rs because calcium
response probability remained unchanged relative to control in
half of EGFP
⫹cells (n
⫽ 8 EGFP
⫹cells). The amplitude of the
evoked calcium transient in KA-R-responsive EGFP
⫹neurons
was reduced, but not significantly, in the presence of blockers, to
72
⫾ 29% of control values (n ⫽ 8 EGFP
⫹cells; p
⬎ 0.05),
suggesting that fewer action potentials were triggered when
blocking AMPA receptors and decreasing network excitability or
when KA-Rs were partially blocked by AMPA-R antagonists
(Castillo et al., 1997). Evoked calcium responses in
GYKI-responsive EGFP
⫹neurons were fully suppressed when KA-Rs
were blocked by further adding CNQX (50
M) to the perfusion
saline. Therefore, synaptically evoked responses presenting a
KA-R pharmacology (i.e., resistant to AMPA, NMDA, and
GABA
Ablockers but suppressed by CNQX) were selectively
present in the EGFP
⫹cell population.
Second, to determine the involvement of KA-Rs in more
physiological conditions, we used a functional antagonist for
KA-Rs (SYM 2081 at 10
M) (Zhou et al., 1997; Li et al., 1999;
DeVries, 2000; Cossart et al., 2002; Epsztein et al., 2005) that did
not affect the global level of spontaneous activity in the network
(fraction of active cells in control, 46
⫾ 5 vs 40 ⫾ 6% after SYM
2081; n
⫽ 899 imaged neurons; data not shown; p ⬎ 0.05). The
calcium response probability was not significantly affected by
SYM 2081 in EGFP
⫺neurons from all hippocampal layers (98
⫾
5% of control in the presence of SYM 2081; n
⫽ 899 neurons; p ⬎
0.05) (Fig. 4). In contrast, in the EGFP
⫹cell population, calcium
response probability was significantly decreased in the presence
of SYM 2081 (to 53
⫾ 14% of control after SYM 2081; n ⫽ 11
neurons; p
⬍ 0.05) (Fig. 4). This further confirmed that
approx-imately half of the EGFP
⫹cell population responds to the TS
through the activation of KA-Rs (KA-responsive EGFP
⫹cells:
EGFP
⫹neurons with
⬎80% calcium response probability in
GYKI 52466 and
⬍20% probability in SYM 2081, i.e., 51% of
EGFP
⫹cells), whereas the other half responds through AMPA-Rs
(AMPA-responsive EGFP
⫹cells: EGFP
⫹neurons with
⬍20%
calcium response probability in GYKI 52466 and
⬎80%
proba-bility in SYM 2081, i.e., 41% of EGFP
⫹cells; n
⫽ 25).
Table 1. Morphological distribution of EGFPⴙand EGFPⴚCA1 stratum oriens interneurons
All EGFP⫹ EGFP⫺ Wild type (% EGFP⫹)
O-LM 32 12 16 4 50 O-P 12 0 11 1 0 O-Tri 3 0 3 0 0 O-Bi 7 0 7 0 0 O-O 4 1 2 1 4 O-S/BP 14 11 3 0 46 Total 72 24 42 6
O-Tri, Stratum oriens interneurons with a trilaminar axonal arborization; O-O, stratum oriens interneurons with an axon innervating only the stratum oriens.
Table 2. Properties of mEPSCs, mEPSCKA, mEPSCAMPA, and fraction of mEPSCKAin
CA1 stratum oriens interneurons
O-LM O-P O-Bi O-S/BP mEPSC decay (ms) 6.1 3.6 2.8 5.4 mEPSCKAdecay (ms) 8.8 6.6 7.4 9.9
mEPSCAMPAdecay (ms) 2.4 2.4 2.9 3.0
mEPSCKA(%) 88.3 42.6 37.6 57.3
mEPSC frequency (Hz) 2.2 2.5 2.8 2.2 mEPSC amplitude (pA) 10.7 11.8 13.5 11.0 mEPSC charge (pA/ms) 90.7 67.7 68.7 81.8
n 20 11 5 4
To further confirm that 10 Hz
stimula-tion of the alveus specifically triggered a
suprathreshold KA-R-mediated synaptic
response
in
a
subpopulation
of
somatostatin-containing neurons, we
per-formed
current-clamp
recordings
in
EGFP
⫹neurons. In the presence of
AMPA, NMDA, and GABA
Areceptor
an-tagonists, an EPSP
KAcould be evoked by
TS in a majority of EGFP
⫹cells (71%)
with an amplitude decreased to 37
⫾ 10%
of control values (n
⫽ 14 EGFP
⫹cells).
Such EPSP
KAcould lead to action
poten-tial firing with a latency comparable with
that obtained in cell-attached recordings
(10.1
⫾ 2.3 ms; n ⫽ 5 cells) (see Fig. 7). We
specifically performed cell-attached
re-cordings to quantify KA-R-mediated
ac-tion potential probability in more reliable
experimental
conditions.
A
KA-R-mediated action potential firing could be
evoked in approximately half of EGFP
⫹neurons (40%), and action potential
prob-ability was 68
⫾ 21% (n ⫽ 10 EGFP
⫹cells)
(Fig. 5). Both current-clamp and
cell-attached responses were blocked by
fur-ther addition of CNQX (50
M),
validat-ing that they were mediated by KA-Rs. To
further confirm the role of KA-Rs in
evoked glutamatergic responses in EGFP
⫹neurons, we next performed
current-clamp and cell-attached recordings in
these cells in the presence of the KA-R
functional antagonist SYM 2081 (see
Ma-terials and Methods). Current-clamp
re-cordings in EGFP
⫹cells revealed that
ap-plication of SYM 2081 reduced the
amplitude of the evoked EPSP to 44
⫾
11% of control (n
⫽ 12; p ⬍ 0.05). The
effect of SYM 2081 on EPSP amplitude was
dependent on the EGFP
⫹cell type as
re-vealed by post hoc morphological
identifi-cation of recorded neurons. Indeed,
appli-cation of SYM 2081 completely abolished
the evoked EPSP in EGFP
⫹/O-LM
neu-rons (to 10
⫾ 10% of control; n ⫽ 5) (see
Fig. 7), whereas the response was relatively
preserved (to 73
⫾ 9% of control; n ⫽ 7;
p
⬍ 0.01) (see Fig. 7) in EGFP
⫹/non-O-LM neurons such as O-S/BP
interneu-rons. Remaining responses were fully
blocked by further addition of GYKI 52466
(100
M),
D-APV (40
M), and bicuculline
(10
M). Finally, application of SYM 2081
abolished evoked action potential firing
recorded in current-clamp mode in 66%
of EGFP
⫹neurons (n
⫽ 3 EGFP
⫹cells)
(see Fig. 7).
We conclude that KA-R activation
se-lectively provides a subpopulation of
EGFP
⫹cells that includes O-LM cells,
with the property to follow reliably theta
stimulation protocols. Finally, to further
Figure 3. Differential contribution of KA-Rs to glutamatergic transmission in different types of stratum oriens interneurons.
A1, Left, Neurolucida three-dimensional reconstruction of a biocytin-filled EGFP⫹/O-LM (green). The axon is indicated in color. o, Stratum oriens; p, stratum pyramidale; r, stratum radiatum; lm, stratum lacunosum moleculare. Scale bar, 100m. Inset, Averaged mEPSCs from an O-LM cell (color trace, control conditions, i.e., in the presence of TTX at 1M, bicuculline at 10M, and
D-APV at 40M; black, with AMPA-R antagonist GYKI 52466 at 100M; dashed, normalized traces). Middle, Voltage-clamp recordings (Vhof⫺60mV)ofminiatureEPSCsrecordedinthecellillustratedattheleftinthepresenceofTTXat1M, bicuculline
at 10M, andD-APV at 40M. mEPSCKAcan be isolated pharmacologically as events resistant to AMPA-R antagonists (GYKI 52466
at 100M) and blocked by the AMPA/KA-R antagonist (CNQX at 50M; data not shown). In control conditions, two types of mEPSC can be distinguished based on the time course of their decay: fast and slow (*) EPSCs. mEPSCKAcorrespond to slow events
(*). Right, Cumulative probability plot of the distribution of individual mEPSC decays (n⫽ 200 events) in the illustrated cell in control conditions (color trace) and in the presence of GYKI 52466 (100M; black). Note that plots overlap in the O-LM cell. A2, Same as A1 for a EGFP⫺/O-P (red). A3, Same as A1 for an EGFP⫺/O-Bi (pink) interneuron. A4, Same as A1 for an EGFP⫹/O-S/BP neuron (blue). DG, Dentate gyrus. B, Cumulative probability plots of the distribution of the averaged fraction of mEPSCKAfor O-LM
(green; n⫽ 20), O-P (red; n ⫽ 11), O-Bi cells (pink), and O-S/BP (blue; n ⫽ 4) cells. Note that O-LM cells have the highest percentage of KA-R-mediated events.
determine the cell type specificity of
KA-R-responsive cells, we filled cells with
biocytin at the end of the imaging
experi-ments and histologically processed the
slices. We found that all KA-R-responsive
stratum oriens interneurons belonged to
the O-LM cell type (n
⫽ 4) (Fig. 6),
whereas
AMPA-R-responsive
stratum
oriens EGFP
⫹interneurons were O-S/BP
neurons (n
⫽ 5) (Fig. 6). Interestingly, we
recorded from a few EGFP
⫺cells that
fol-lowed TS through KA-Rs and found that
they all corresponded to O-LM neurons
(n
⫽ 3). This also confirms that EGFP
la-bels only a subset of O-LM cells as reported
previously (Oliva et al., 2000). However,
such EGFP
⫺/O-LM neurons are likely to
constitute a minority of imaged stratum
oriens EGFP
⫺neurons because the overall
response probability to TS of EGFP
⫺cells
in this region was not significantly
differ-ent from that in other layers. Finally, we
also recorded from EGFP
⫺interneurons
that did follow TS but not through KA-Rs;
these cells were either O-P or O-Bi
inter-neurons (n
⫽ 2) (Fig. 6). We conclude that
KA-R
activation
selectively
provides
O-LM cells with the ability to reliably
fol-low theta stimulation protocols. We next
asked for the cellular mechanisms
under-lying such specificity.
Efficient EPSP
KA–spike coupling in
O-LM cells stimulated at theta frequency
Several presynaptic and postsynaptic
mechanisms could drive O-LM cells to fire
at 10 Hz in response to afferent theta
in-puts, including, as previously reported, a
short-term facilitation of the
glutamater-gic drive impinging on this cell type (Ali
and Thomson, 1998; Maccaferri, 2005) or
a summation of slow EPSP
KA(Castillo et
al., 1997; Cossart et al., 1998; Frerking et
al., 1998; Frerking and Ohliger-Frerking,
2002).
To discriminate between these
hypoth-eses, because both phenomenon are
fre-quency dependent, we recorded evoked
EPSPs in EGFP
⫹neurons during a
se-quence of trains of 10 stimuli at 1, 3, 10, 50,
and 100 Hz, repeated once every 30 s.
Fre-quency facilitation was assessed by
mea-suring the amplitude ratio of the second
and the last (10th) EPSP relative to the first
one (EPSP
2–1and EPSP
10 –1) across all
fre-quencies while EPSP summation was
visu-ally inspected. At 10 Hz, the response of
EGFP
⫹/O-LM neurons was, on average,
stable between stimulation trials (10 Hz;
EPSP
2–1, 130
⫾ 19%; EPSP
10 –1, 130
⫾ 19%; n ⫽ 5; p ⬎ 0.05) (Fig.
7). We found a significant facilitation of the response only for
stimulation rates above 50 Hz in EGFP
⫹/O-LM cells, whereas
short-term facilitation could already be observed at 10 Hz in
non-O-LM/EGFP
⫹cells, including O-S/BP neurons (EPSP
2–1,
221
⫾ 19%; EPSP
10 –1, 172
⫾ 19%; n ⫽ 4; p ⬍ 0,05) (Fig. 7).
Accordingly, EPSP
KAs, recorded in the presence of GYKI 52466,
neither facilitated nor summated at 10 Hz (EPSP
2–1, 141
⫾ 14%;
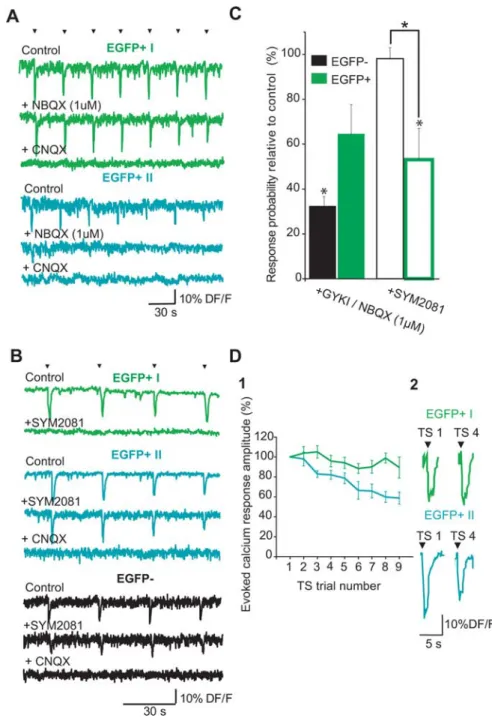
Figure 4. A selective processing of theta stimulation influx via KA-Rs in a subpopulation of EGFP⫹cells. A, Fluorescence traces in response to the TS protocol from representative examples of the two populations of EGFP⫹neurons (green, EGFP⫹I;blue,EGFP⫹II)in bicucullineat10MandD-APVat40M(control),whenaddingaKA-Rantagonist(NBQXat1M)andtheAMPA/KA-Rantagonist(CNQX
at 50M); arrows mark the stimuli. Note that the EGFP⫹ I neuron (green) responds to all stimuli in the presence of the AMPA-R
antagonist,whereastheEGFP⫹IIneuron(blue)respondsonlytothefirststimulus.B,SameasinAbutinaEGFP⫹I,EGFP⫹II,andEGFP⫺ interneuron (black), in drug-free ACSF (control), when adding a KA-R antagonist (SYM 2081 at 10M) and the AMPA/KA-R antagonist
(CNQX at 50M). Note that the response in the EGFP⫹I neuron (green) was significantly reduced in the presence of SYM 2081,
although it was not significantly affected in both other cell types. C, Bar histograms show the averaged changes in calcium response probability to the 10 Hz stimulation relative to control conditions (D-APV at 40Mand bicuculline at 10M), in
KA-R-mediated conditions (i.e., in the presence of GYKI52466 at 100Mor NBQX at 1M; filled bars), and in the presence of a
KA-R antagonist (SYM 2081 at 10M; open bars) in EGFP⫺(black) and EGFP⫹(green) cells. *p⬍0.01whencomparingrelative
change with control and between populations. D1, Graph illustrates the averaged amplitudes of the calcium responses evoked by nine successive TS protocols as a function of time (i.e., TS trial number) in KA-R-responsive EGFP⫹cells (EGFP⫹ I, green) and in AMPA-R responsive EGFP⫹neurons (EGFP⫹ II, blue). Error bars indicate SEMs. D2, Representative examples of the calcium responses evoked by the first and the fourth TS trial in an O-LM cell (green) and an O-S/BP cell (blue). Arrows indicate TS time.
EPSP
10 –1, 122
⫾ 14%; n ⫽ 7). Therefore, KA-Rs mediate a
con-stant and reliable postsynaptic response when activated at 10 Hz
in O-LM cells without significant facilitation or summation,
which are observed at higher stimulation rates (Fig. 7).
Interest-ingly, because O-S/BP neurons followed TS through a facilitating
AMPA-R-mediated response, we hypothesized that these
prop-erties would not enable this cell type to fire in a steady way across
different trains of stimulation. To test this hypothesis, we
com-pared the stability of the calcium response between successive TS
trials in KA-responsive and AMPA-responsive EGFP
⫹neurons
and found that the amplitude of the evoked calcium event
pro-gressively declined in AMPA- but not KA-responsive EGFP
⫹neurons (Fig. 4 D). The decrease started being significant for the
third trial. This indicated that the response to TS was more stable
across time for KA-responsive EGFP
⫹neurons than for
AMPA-responsive EGFP
⫹neurons.
Because modeling studies predict that the frequency of
net-work oscillations depends in part on the time course of synaptic
currents in interneurons (Traub et al., 1996; Wang and Buzsaki,
1996; Fuchs et al., 2001), we next hypothesized that the specific
EPSP
KAkinetics could partly provide the O-LM interneuron type
with their selective activation at theta. In keeping with this
hy-pothesis, the decay time constants of averaged EPSPs in O-LM
cells were indeed slower (40
⫾ 9 ms; n ⫽ 5; p ⬍ 0.05) than those
in EGFP
⫹/non-O-LM cells (22
⫾ 3 ms; n ⫽ 8; p ⬍ 0.05), whereas
input resistance was comparable in both cell types (139
⫾ 11 and
145
⫾ 10 M⍀, respectively; p ⬎ 0.1). There was no statistical
difference in the evoked EPSP decay time between control
con-ditions and after adding GYKI 52466 in O-LM neurons (38
⫾ 7
ms in GYKI 52466; n
⫽ 9 cells; p ⬎ 0.05) (Fig. 7). We indirectly
tested the hypothesis that slower EPSPs could drive any cell type
to fire at theta using a compound (CX546 at 200
M) that, as
reported previously (Pouille and Scanziani, 2004; Xia and Arai,
2005), slows the deactivation and desensitization of AMPA-Rs.
Responses to TS were monitored at the network level using
cal-cium imaging and at the cell level using current-clamp
record-ings. CA1 was surgically isolated from CA3 to avoid
contamina-tion from polysynaptic events that could be generated in the latter
region, and control conditions were recorded in the presence of
D
-APV (40
M) only in the ACSF. We confirmed that CX546
application significantly increased the decay time constant of
av-eraged evoked EPSPs in CA1 pyramidal cells and stratum oriens
interneurons (to 166
⫾ 19 and 208 ⫾ 51% of control values,
respectively; n
⫽ 5 pyramidal cells and 7 interneurons; p ⬍ 0.05)
(Fig. 8). Current-clamp recordings at resting membrane
poten-tial in the presence of CX546 showed that slower EPSPs tended to
summate (Fig. 8). This could increase the probability of action
potential firing because 48
⫾ 13 and 49 ⫾ 17% of TS trains could
evoke at least one spike in the presence of CX546 in pyramidal
cells (n
⫽ 5) and interneurons (n ⫽ 7), respectively, compared
with 6
⫾ 6 and 10 ⫾ 5% trains in control. However, firing was not
reliably evoked by each stimulation (as measured in O-LM cells)
because spike probability per train was 13
⫾ 4 and 30 ⫾ 20% in
the presence of CX546 in pyramidal cells (n
⫽ 5) and
interneu-rons (n
⫽ 7) compared with 1 ⫾ 2 and 2 ⫾ 1% in control
condi-tions. In keeping with this observation, we observed a small but
not significant increase in the amplitude of the evoked calcium
response to the TS in the presence of CX546 (to 125
⫾ 12% of
control values; n
⫽ 7 movies, 1245 cells; p ⬎ 0.5, Mann–Whitney
test) but no change in the fraction of cells displaying a 100%
calcium response probability (18
⫾ 3% in control vs 16 ⫾ 4% in
CX546; n
⫽ 7 movies, 1245 cells; p ⬎ 0.5, Mann–Whitney test)
(Fig. 8 A). We conclude that EPSP kinetics alone cannot account
for the ability of the O-LM cells to reliably follow theta
stimula-tion and that intrinsic properties specific to this particular cell
type (Maccaferri and McBain, 1996; Martina et al., 2000; Pike et
al., 2000; Saraga et al., 2003; Gloveli et al., 2005; Maccaferri, 2005;
Lawrence et al., 2006a,b,c) are likely to be involved in the reliable
EPSP
KA–spike coupling at 10 Hz. Future studies are required to
investigate the nature of this coupling.
In summary, these results show both at the cellular and
net-work level a specific and reliable processing of theta
glutamater-gic afferent inputs by KA-Rs in O-LM interneurons.
Discussion
Using fast two-photon imaging to analyze electrically evoked
cal-cium dynamics from hundreds of cells, we show that O-LM cells
Figure 5. Targeted cell-attached recordings show that EGFP⫹cells can respond to theta stimulation through KA-Rs. A, Cell-attached recordings from an EGFP⫹cell in response to 10 alveus stimulations at 10 Hz (open arrows) in the presence of bicuculline (Bic; 10M) andD-APV
(40M; green). Action potentials (large arrows, time-locked spikes) were still evoked when the
AMPA-R antagonist GYKI 52466 (100M; blue) was added but not in the presence of the KA-R
antagonist SYM 2081 (10M; pink) or the AMPA/KA-R antagonist CNQX (50M; gray). B,
Peristimulus time histograms (same recordings as in A; dashed line indicates time of stimula-tion) constructed from 10 series of 10 alveus stimulations at 10 Hz. C, Bar graphs of averaged spike probability in cell-attached recordings from EGFP⫹cells in control (n⫽10),inD-APV plus
bicuculline (n⫽ 10), and when adding GYKI 52466 (n ⫽ 4) and SYM 2081 (n ⫽ 3). Error bars indicate SEMs.
are the only stratum oriens interneuronal
subtype that processes glutamatergic
in-puts exclusively through KA-Rs. Relying
on the imaging data, we performed
elec-trophysiological recordings showing
un-equivocally that EGFP
⫹/O-LM neurons
are selectively activated by theta stimuli by
means of KA-R-mediated EPSPs.
Func-tionally, we show that this unique
postsyn-aptic property endows O-LM cells with the
ability to follow reliably input stimulation
at theta frequency.
Somatostatin-containing interneurons
are activated by theta frequency
stimulation protocols
In imaging experiments, we found that
ap-plying a TS protocol to the alveus resulted
in the preferential activation of stratum
oriens EGFP
⫹cells as opposed to
pyrami-dal or other interneurons in all layers of
the CA1 region. The detected calcium
re-sponse resulted from the opening of
voltage-gated calcium channels
attribut-able to synaptically mediated firing
be-cause of the following: (1) the fast kinetics
and small amplitude of the evoked signals
indicate calcium entry through action
po-tential firing rather than other
mecha-nisms for intracellular calcium
accumula-tion [such as calcium release from
intracellular stores (Rozas et al., 2003)];
(2) evoked calcium signals were abolished
by blocking synaptic transmission or
ac-tion potential firing; and (3) the TS
proto-col evoked action potential firing and
EP-SPs in EGFP
⫹cells.
An increase in membrane excitability
attributable to the inhibition of the slow
afterhyperpolarization currents (I
AHP) by
synaptically activated KA-Rs could also
contribute to the calcium signal
(Cheru-bini et al., 1990; Melyan et al., 2002; Ruiz et
al., 2005). However, such effect is unlikely
because (1) it should also involve CA1
py-ramidal cells (Ruiz et al., 2005), (2)
in-creased excitability would be abolished
within the time window of our TS protocol
(Ruiz et al., 2005), (3) current-clamp
re-cordings do not indicate an increase in the
firing of interneurons after repeated
stim-uli trials, and (4) the calcium response
am-plitude remained unchanged during TS in
EGFP
⫹/O-LM cells, indicating that the
number of spikes evoked was constant
(Smetters et al., 1999). We conclude that
the TS protocol used here induced
synapse-driven action potential firing in
EGFP
⫹cells.
Stratum oriens somatostatin-containing neurons comprise
O-LM (Katona et al., 1999), O-S/BP (Gulyas et al., 2003), and O-Bi
(Maccaferri et al., 2000; Martina et al., 2000; Losonczy et al., 2002)
neurons. Most biocytin-filled EGFP
⫹cells in our sample data were
O-LM cells (Oliva et al., 2000) but also included O-S/BP
interneu-rons (Maccaferri et al., 2000; Losonczy et al., 2002). The distinction
between O-S/BP and O-LM cells was unequivocal because, even
with a cut axon, an O-LM cell presents a characteristic spiny
den-dritic arbor. We have not isolated the type of fibers activated during
Figure 6. Kainate receptor-mediated calcium response in O-LM but not in other cells. Two-photon calcium imaging in the CA1 region from EGFP mouse hippocampal slices at postnatal day 14 (excitation wavelength, 780 nm; time resolution, 145 ms/frame). EGFP⫹neurons were identified within the same slice (excitation wavelength, 900 nm). Slices were stimulated (10 Hz stimulation protocol, TS) in control and in KA-R-mediated conditions (in the presence of AMPA-R, NMDA-R, and GABAA-R antagonists; GYKI
52466 at 100M,D-APV at 40M, and bicuculline at 10M). At the end of each experiment, targeted neurons were patched, filled with biocytin, and identified morphologically. A, Calcium fluorescence images superimposed with the EGFP image (in green or blue) indicate the presence of an EGFP⫹cell in the stratum oriens for each movie. These neurons were identified post hoc as an O-LM cell (left) and a septum/back-projecting neuron (O-S/BP neuron; right) as shown by the photomicrographs of the biocytin-filled cells. Arrows in the left photomicrograph indicate the O-LM cell axon. Scale bar, 100m.Bottomtracesareaveragedevoked calcium responses by the TS protocol in O-LM cells (n⫽ 4) and O-S/BP cells (n ⫽ 5), in control (Ct, black) and in KA-R-mediated conditions (i.e., in the presence of the AMPA-R antagonist GYKI 52466 at 100M; light green or blue). Responses were fully blocked in the presence of CNQX (dark green). Same scale in O-S/BP neuron as in O-LM neuron. B, Calcium fluorescence traces from an O-LM (green), an O-S/BP neuron (blue), and an EGFP⫺neuron (black, the illustrated cell is marked with a gray arrow in A) imaged in control [D-APV at 40Mand bicuculline (Bic) at 10M], in KA-R-mediated conditions (i.e., when adding GYKI 52466 at 100M), and in the presence of the AMPA/KA-R antagonist CNQX (50M). Note that all illustrated cells responded to the TS protocol in control, whereas only the O-LM cell showed responses in KA-R-mediated conditions that were blocked in CNQX. C, Left two-photon calcium fluorescence image: the EGFP⫺cell marked with a pink dot was identified post hoc as an O-Bi interneuron (photomicrograph illustrates the biocytin-filled cell; see also Neurolucida reconstruction below). Averaged evoked calcium re-sponses by the TS protocol in control (black) and in KA-R-mediated conditions (see B; same scale as in A). A small response remained in KA-R-mediated conditions (1 of 4 trains of 10 stimuli; pink). It was blocked by CNQX. Right, Two-photon calcium fluorescence image; the EGFP⫺cell marked with a red dot was identified post hoc as an O-P interneuron (photomicrograph illustrates the biocytin-filled cell; see also Neurolucida reconstruction below). Averaged evoked calcium responses by the TS protocol in control (Ct, black) and in KA-R-mediated conditions (GYKI 52466, red). Bottom, Neurolucida reconstructions of the O-P and O-Bi interneurons imaged above (axons in color: pink, O-Bi; red, O-P). Scale bar, 100m.D,BargraphsoftheKA-R-mediated response probability (see B) in EGFP⫺neurons (black; n⫽ 430), O-LM neurons (green; n ⫽ 4), and O-S/BP neurons (blue; n ⫽ 5). ***p⬍ 0.001 O-LM cells vs O-S/BP and EGFP⫺neurons.
stimulation. However, because the
stimula-tion electrode was placed in the alveus and
direct activation of dendrites was excluded, it
is likely that Schaffer or CA1 collaterals were
stimulated. For O-LM cells, the latter
alter-native is more probable because these cells
are exclusively innervated by CA1 collaterals
(Wittner et al., 2006) and because direct
an-tidromic stimulation of CA1 pyramidal cells
could be verified while imaging.
Cellular basis for the selective activation
of O-LM/EGFP
ⴙinterneurons at theta
stimulation frequencies
O-LM cells are remarkably tuned to operate
at theta frequencies spontaneously
(Maccaf-erri and McBain, 1996), during current
in-jections (Pike et al., 2000),
pharmacologi-cally induced oscillations in vitro (Hajos et
al., 2004; Gloveli et al., 2005), as well as
dur-ing local theta oscillations in vivo
(Klaus-berger et al., 2003). We established the
uniqueness of this property in the CA1
re-gion by imaging all neurons simultaneously
and morphologically identifying reliably
re-sponsive cells. Although intrinsic
conduc-tances, muscarinic receptor activation, and
slow membrane time constants (Maccaferri
and McBain, 1996; Ali and Thomson, 1998;
Martina et al., 2000; Pike et al., 2000;
Loson-czy et al., 2002; Saraga et al., 2003; Pouille
and Scanziani, 2004; Gloveli et al., 2005;
Maccaferri, 2005; Lawrence et al., 2006a,b,c)
are also involved in the intrinsic resonance
peak of O-LM cells at theta frequencies, the
activation of postsynaptic KA-Rs is
instru-mental to their ability to follow theta
synap-tic stimulation. First, the selective blockade
of KA-Rs by SYM 2081 (Zhou et al., 1997; Li
et al., 1999; DeVries, 2000; Cossart et al.,
2002; Epsztein et al., 2005) specifically blocks
the calcium response to TS in O-LM/EGFP
⫹neurons. Second, TS reliably evoked a GYKI
52466-resistant/CNQX-blocked calcium
re-sponse in O-LM cells. Third, activation of
KA-Rs in EGFP
⫹neurons drives
postsynap-tic depolarization and action potential firing;
both responses were blocked by SYM 2081
only in O-LM/EGFP
⫹. Fourth, almost 90%
of mEPSCs recorded in O-LM cells were
KA-R mediated; voltage-clamp experiments
provide a quantification of the involvement
of KA-Rs in the absence of pharmacological
manipulation. It is difficult to isolate a
KA-R-mediated process based solely on
pharma-cological agents because specific antagonists
for AMPA-Rs also partially block KA-Rs
(Castillo et al., 1997), whereas the functional
KA-R antagonist SYM 2081 works in a
use-dependent manner (DeVries, 2000). Finally,
current-clamp recordings showed that
blocking AMPA-Rs did not affect the decay
of the EPSPs in O-LM cells.
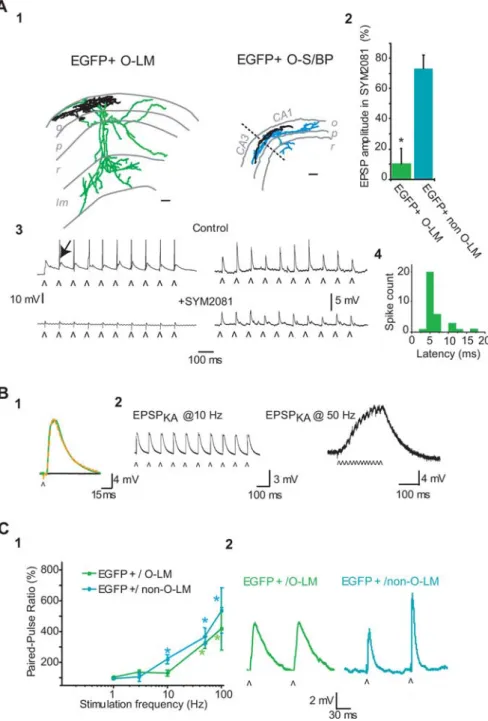
Figure 7. Frequency- and cell-type-dependent plasticity of the evoked EPSP in EGFP⫹neurons. A1, Neurolucida reconstructions of two typical EGFP-positive neurons, one O-LM cell (left, green axon) and one O-S/BP interneuron (right, axon in blue). o, Stratum oriens; p, stratum pyramidale; r, stratum radiatum; lm, stratum lacunosum moleculare. Scale bar, 100m.A2,Current-clamprecordingsatresting membrane potential (I⫽0pA),fromthetwocelltypesillustratedinA1,showingtheEPSPsevokedby10successiveelectricalstimuli(ˆ, 10 Hz) in control conditions (i.e., inD-APV at 40Mand bicuculline at 10M) and in the presence of the functional antagonist for KA-Rs
(SYM 2081 at 10M). Note that the EPSPs evoked in control in the EGFP⫹/O-LM cell were suprathreshold (arrow indicates an action
potential), whereas spikes could not be evoked in the illustrated O-S/BP neuron. A3, Evoked EPSPs are blocked in the presence of SYM 2081 in EGFP⫹/O-LM cells (n⫽ 5; green bar; *p ⬍ 0.05), indicating that they are KA-R mediated, whereas they are only partially affected in non-O-LM/EGFP⫹cells (n⫽ 5). EPSP amplitude is measured relative to control values. Error bars indicate SEMs. A4, Latency histogram of the spikes evoked in current clamp in the EGFP⫹/O-LM cell illustrated in A3. B1, Example of an evoked EPSP recorded in current clamp (Vrest, I⫽ 0 pA) in an O-LM/EGFP⫹cell in the presence ofD-APV (40M) and bicuculline
(10M; green) and when adding GYKI 52466 (100M; dashed orange). Both traces overlap, indicating that the evoked EPSP in
control conditions was KA-R mediated (EPSPKA). The EPSPKAwas blocked after addition of CNQX (50M; black). B2, EPSPKAs are
not plastic for repetitive 10 Hz stimulation (left traces) but show a significant summation/facilitation for shorter stimulation intervals (50 Hz; right), as illustrated by the current-clamp recordings in the presence of AMPA-R, NMDA-R, and GABAA-R
antag-onists (GYKI 52466 at 100M,D-APV at 40M, and bicuculline at 10M). ˆ indicates the time of stimulation. C1, Graph illustrates
paired-pulse ratio (fraction of the EPSP amplitudes evoked by 2 successive stimuli) as a function of stimulation frequency in EGFP⫹/O-LM cells (green) and in EGFP⫹/non-O-LM cells (blue). *p⬍ 0.05, significant facilitation of the response. C2, Repre-sentative current-clamp recordings from EPSPs evoked by 10 Hz stimulation in the two EGFP⫹populations mentioned in C1. Note the difference in EPSP kinetics in EGFP⫹/O-LM cells and non-O-LM cells. The open arrow indicates time of stimulation.