HAL Id: hal-02613775
https://hal.sorbonne-universite.fr/hal-02613775
Submitted on 20 May 2020
HAL is a multi-disciplinary open access archive for the deposit and dissemination of sci-entific research documents, whether they are pub-lished or not. The documents may come from teaching and research institutions in France or abroad, or from public or private research centers.
L’archive ouverte pluridisciplinaire HAL, est destinée au dépôt et à la diffusion de documents scientifiques de niveau recherche, publiés ou non, émanant des établissements d’enseignement et de recherche français ou étrangers, des laboratoires publics ou privés.
evolutionary information, physico-chemical and
geometrical properties
Flavia Corsi, Richard Lavery, Elodie Laine, Alessandra Carbone
To cite this version:
Flavia Corsi, Richard Lavery, Elodie Laine, Alessandra Carbone. Multiple protein-DNA interfaces unravelled by evolutionary information, physico-chemical and geometrical properties. PLoS Computa-tional Biology, Public Library of Science, 2020, 16 (2), pp.e1007624. �10.1371/journal.pcbi.1007624�. �hal-02613775�
Multiple protein-DNA interfaces unravelled by
evolutionary information, physico-chemical
and geometrical properties
Flavia Corsi1,2, Richard LaveryID3, Elodie LaineID1*, Alessandra CarboneID1,4*
1 Sorbonne Universite´ , CNRS, IBPS, UMR 7238, Laboratoire de Biologie Computationnelle et Quantitative (LCQB), 75005 Paris, France, 2 Sorbonne Universite´, CNRS, Institut des Sciences, du Calcul et des Donne´es (ISCD), 75005 Paris, France, 3 Lyon University, CNRS, IBCP, UMR 5086, Molecular Microbiology and Structural Biochemistry, 69367 Lyon, France, 4 Institut Universitaire de France, 75005 Paris, France
*elodie.laine@upmc.fr(EL);alessandra.carbone@lip6.fr(AC)
Abstract
Interactions between proteins and nucleic acids are at the heart of many essential biological processes. Despite increasing structural information about how these interactions may take place, our understanding of the usage made of protein surfaces by nucleic acids is still very limited. This is in part due to the inherent complexity associated to protein surface deform-ability and evolution. In this work, we present a method that contributes to decipher such complexity by predicting protein-DNA interfaces and characterizing their properties. It relies on three biologically and physically meaningful descriptors, namely evolutionary conserva-tion, physico-chemical properties and surface geometry. We carefully assessed its perfor-mance on several hundreds of protein structures and compared it to several machine-learning state-of-the-art methods. Our approach achieves a higher sensitivity compared to the other methods, with a similar precision. Importantly, we show that it is able to unravel ‘hidden’ binding sites by applying it to unbound protein structures and to proteins binding to DNA via multiple sites and in different conformations. It is also applicable to the detection of RNA-binding sites, without significant loss of performance. This confirms that DNA and RNA-binding sites share similar properties. Our method is implemented as a fully automated tool,JET2
DNA, freely accessible at:http://www.lcqb.upmc.fr/JET2DNA. We also provide a
new dataset of 187 protein-DNA complex structures, along with a subset of 82 associated unbound structures. The set represents the largest body of high-resolution crystallographic structures of protein-DNA complexes, use biological protein assemblies as DNA-binding units, and covers all major types of protein-DNA interactions. It is available at:http://www. lcqb.upmc.fr/PDNAbenchmarks.
Author summary
Protein-DNA interactions are essential to living organisms and their impairment is asso-ciated to many diseases. For these reasons, they have become increasingly important ther-apeutic targets. Experimental structure determination has revealed different binding
a1111111111 a1111111111 a1111111111 a1111111111 a1111111111 OPEN ACCESS
Citation: Corsi F, Lavery R, Laine E, Carbone A
(2020) Multiple protein-DNA interfaces unravelled by evolutionary information, physico-chemical and geometrical properties. PLoS Comput Biol 16(2): e1007624.https://doi.org/10.1371/journal. pcbi.1007624
Editor: Bert L. de Groot, Max Planck Institute for
Biophysical Chemistry, GERMANY
Received: September 13, 2019 Accepted: December 20, 2019 Published: February 3, 2020
Peer Review History: PLOS recognizes the
benefits of transparency in the peer review process; therefore, we enable the publication of all of the content of peer review and author responses alongside final, published articles. The editorial history of this article is available here:
https://doi.org/10.1371/journal.pcbi.1007624
Copyright:© 2020 Corsi et al. This is an open access article distributed under the terms of the
Creative Commons Attribution License, which permits unrestricted use, distribution, and reproduction in any medium, provided the original author and source are credited.
Data Availability Statement: The data underlying
the results presented in the study are available fromhttp://www.lcqb.upmc.fr/JET2DNAandhttp:// www.lcqb.upmc.fr/PDNAbenchmarks.
motifs and modes, associated to different functions. Yet, the available structural data gives us only a glimpse of the multiplicity and complexity of protein surface usage by DNA. In this work, we use a three-layer model to describe and predict DNA-binding sites at pro-tein surfaces. Given a propro-tein, we consider the way its residues are conserved through evo-lution, their physico-chemical properties and geometrical shapes to decrypt its surface. We are able to detect a large portion of interacting residues with good precision, even when they are ‘hidden’ by conformational changes. We highlight cases where one protein binds DNA via distinct regions to perform different functions. We are able to uncover the alternative binding sites and relate their properties with their specific roles. Our work can help guiding mutagenesis experiments and the development of new drugs specifically tar-geting one site while limiting possible side effects.
Introduction
Interactions between proteins and DNA play a fundamental role in essential biological pro-cesses [1] and their impairement is associated with human diseases [2,3]. Thus, they represent increasingly important therapeutic targets. The experimental determination of protein-DNA complexes is a costly and time consuming process (<5000 protein-DNA complex structures available in the Protein Data Bank [4], release 2019). This has motivated the development of a large number of computational methods, most of them based on machine learning, to predict DNA-binding residues [5–24]. Both sequence-based properties (conservation, amino acid type, predicted secondary structure, solvent accessibility and disorder) and structural proper-ties (electrostatic potential, dipole moment, surface shape and curvature, structural motifs, sec-ondary structure, amino acid microenvironment, solvent accessibility and hydrogen-bonding potential) have been considered. Among those, amino acid composition is one of the most powerful feature. Indeed, positively charged and polar amino acids are largely over-repre-sented in DNA-binding sites, in order to counterbalance the excess of negative charge coming from the DNA phosphate groups [25]. Methods using a large body of features can achieve very high accuracy on known binding sites but generally lack interpretability.
Our understanding of protein-DNA interactions is hampered by the fact that protein sur-faces are complex dynamical objects which may interact with several DNA molecules at the same time or at different moments but via the same region [26–28], accommodate indiffer-ently DNA and RNA [29] and undergo substantial conformational changes upon binding [30]. A protein may harbour multiple DNA-binding sites on its surface, each of which may have a different role with a different level of importance in the accomplishment of the protein’s func-tion [28,31] and thus display particular properties. The relatively small amount of available structural data gives us only a glimpse of the many ways nucleic acid molecules use protein surfaces. This calls for the development of tools able to comprehensively identify and charac-terize protein-DNA interfaces and help decipher protein surface complexity.
Here, we presentJET2DNA, a new method for predicting DNA-binding sites at protein
sur-faces based on a few biologically and physically meaningful parameters. Specifically, we use evolutionary conservation, physico-chemical properties and local/global geometry. These descriptors recently proved useful to identify and characterize protein-protein interfaces [32,
33].JET2DNApredicts surface patches following thesupport-core-rim model for experimental
protein-protein interfaces, where interacting residues are classified based on their structural role in the interaction [34]. This three-layer model comes from a reexamination of the previ-ously proposedcore-rim one, which proved useful in dissecting protein-protein [35,36] and Funding: This work was funded by LabEx
CALSIMLAB (public grant ANR-11-LABX-0037-01 constituting a part of the "Investissements d’Avenir" program - reference: ANR-11-IDEX-0004-02) (FC) and the Institut Universitaire de France (AC). The funders had no role in study design, data collection and analysis, decision to publish, or preparation of the manuscript.
Competing interests: The authors have declared
protein-DNA interfaces [37] and in understanding their properties. To the best of our knowl-edge, this is the first time that the three-layersupport-core-rim model is used for analyzing
and predicting protein-DNA interfaces.JET2
DNAimplements three different scoring strategies,
aimed at detecting different types of protein-DNA interfaces and different subregions of a given interface.
We assessedJET2
DNAperformance on two new representative benchmarks of
high-resolu-tion structures, comprised of 187 protein-DNA complexes (HR-PDNA187) and 82 associated bound-unbound pairs (HOLO-APO82), and on an independent test set of 82 nucleic acid binding proteins (TEST-NABP82), taken from [18]. We show thatJET2
DNApredictions are very
accurate and robust to protein conformational and stoichiometry changes associated to DNA binding. Moreover, the predictive performances are equivalent for both DNA- and RNA-bind-ing sites, showRNA-bind-ing that these sites share similar properties. In addition, rigorous comparison with three established machine learning based methods, namely DISPLAR [7], multiVORFFIP [15] and DRNApred [18] demonstrates the better predictive power ofJET2DNAon all datasets.
Specifically,JET2
DNAis able to significantly detect more interacting residues while retaining
similar precision and to unravel ‘hidden’ alternative binding sites. We show how one can learn about the origins and specificities of different types of protein-DNA interfaces through direct interpretation ofJET2
DNApredictions. With this work, we pave the way to the discovery of yet
unknown binding sites, opening up new perspectives for drug design.
We provide the structures and the experimentally known DNA-binding sites for our two newly created datasets, HR-PDNA187 and HOLO-APO82 at:http://www.lcqb.upmc.fr/ PDNAbenchmarks/. These datasets represent the largest body of non-redundant known high-resolution crystallographic protein-DNA complex structures. They were manually curated to ensure quality and biological relevance. They can be used as benchmark sets for evaluating DNA-binding site predictors and DNA-protein docking methods. The code ofJET2DNAis
avail-able at:http://www.lcqb.upmc.fr/JET2DNA.
Materials and methods
Datasets
HR-PDNA187. The complete list of 1257 protein-double strand DNA complexes
deter-mined by X-ray crystallography with a resolution better than 2.5Å was downloaded from the Nucleic Acid Database [38] (February 2016 release). This list was filtered using PISCES sequence culling server [39] to define a set of 222 protein-DNA complexes non-redundant at 25% sequence identity, with an R-factor lower than 0.3 and with at least one protein chain lon-ger than 40 amino acids. The complexes’ 3D structures were downloaded from the PDB [4].
Subsequently, the dataset was manually curated to ensure its good quality. We removed entries where: (1) the asymmetric unit did not contain at least one biological unit or (2) the DNA molecule was single-stranded or contained less than 5 base pairs or (3) only Cα atoms were present. Moreover, only chains with more than one contact with the DNA were retained. When the biological unit contained multiple copies of the protein-DNA complex, only one copy was kept. The structure 4hc9 was excluded because it displays different DNA-binding sites in the asymmetric and biological units. The complex 4aik was substituted with the 100% homolog 4aij, where the DNA-binding site is twice bigger. Finally, we removed the only anti-body present in the dataset (3vw3), since this class of proteins have very peculiar characteristics and should be treated separately. In total, we retained 187 complexes (Table A inS1 File).
HR-PDNA187 covers all major groups of DNA-protein interactions according to Lus-combeet al. classification [1]: helix-turn-helix (HTH), zinc-coordinating, zipper type, other
α-helical,β-sheet, β-hairpin/ribbon, other. It spans a wide range of functional classes: it com-prises 100 enzymes, 78 regulatory proteins, 7 structural proteins, 1 protein with other function and 1 unclassified protein (Table A inS1 File).
HOLO-APO82. We collected all available X-ray structures of the APO forms of the
pro-teins from HR-PDNA187. We used the blastp program from the BLAST+ package [40] from NCBI with a threshold of 95% for seq. id., 10−3for the E-value, a percentage of coverage � 70% and a percentage of gaps � 10% with respect to the query protein chain. Among the struc-tures matching these criteria, only the ones having the same UniProt code [41] or belonging to the same organism as the query sequence were retained. If several structures passed all filters, only the closest one to the query or the one with the highest resolution was chosen. We found unbound forms for 81 complexes. For the complex 2isz, the unbound protein was found as a monomer and also as a dimer in two different PDB structures. Both structures were retained as they were both reported as present in equilibrium [42]. The resulting list comprises a total of 82 HOLO(bound)-APO(unbound) pairs. Within each pair, the APO form may be in the same oligomeric state as the HOLO form or may have fewer chains (Table A inS1 File).
TEST-NABP82. We used an additional recent dataset [18] of 82 proteins bound to nucleic acids, with a resolution better than 2.5Å. Among these, 49 proteins were solved bound to DNA (TEST-DBP49) and 33 to RNA (TEST-RBP33). Among the 49 DNA-binding proteins, 25 share more than 30% sequence identity with proteins from HR-PDNA187. To fairly assess JET2
DNAperformance, they were removed from the dataset and the remaining 24 were used as
non-redundant test set of DNA-binding proteins (TEST-DBP24). The list of the 24 complexes present in TEST-DBP24, annotated with the reasons they were excluded from HR-PDNA187 despite their good (<2.5Å) resolution, is reported in Table B inS1 File.
Definition of interface residues
For each bound form from HR-PDNA187, we calculated the residues relative accessible sur-face areas in presence (rasaDNA) and absence (rasafree) of DNA, using NACCESS 2.1.1 [43] with a probe size of 1.4Å. Interface residues were defined as those being more buried in the presence of DNA than in the free form (Δrasa > 0). They were classified in three structural components [34]:support residues are buried both in presence (rasaDNA<25%) and absence of
DNA (rasafree<25%);core residues are exposed in absence of DNA (rasafree�25%) and become buried upon binding (rasaDNA<25%);rim residues are exposed in presence (rasaDNA�25%) and in absence (rasafree�25%) of DNA (Fig 1a).
The interfaces for TEST-NABP82 were directly taken from [18]. They were defined from the PDB entries comprised in the dataset and also PDB structures of identical or similar com-plexes (seq. id.�80% and TM-score�0.5) [44,45]. This allows to account for interface variabil-ity coming from molecular flexibilvariabil-ity. Nevertheless, we should stress that these interfaces were defined using a very stringent distance criterion of 3.5Å, and hence they are substantially smaller than those we defined from HR-PDNA187. We used them to fairly assessJET2
DNA
per-formance on an independent dataset, not created by us, and to fairly compareJET2 DNAwith
DRNApred [18], which was evaluated on them.
Residue descriptors
Evolutionary conservation. Conservation levels are computed using the Joint
Evolution-ary Trees (JET) method [46]. This measure is inspired but different from the evolutionary trace introduced in [47,48]. Briefly, the algorithm performs a PSI-BLAST search [49] to retrieve a set of sequences homologous to the query. These sequences are then sampled by a Gibbs-like approach and from each sample a phylogenetic tree is constructed [32,46]. From
each tree, atree trace is computed for each position in the query sequence: it corresponds to
the tree level where the amino acid at this position appeared and remained conserved thereaf-ter [32,46].Tree traces are averaged over all trees to get more statistically significant values,
denoted as TJET, which vary in the interval [0, 1].
Physico-chemical properties. Propensities specific to every amino acid to be located at a
protein-DNA interface (PCDNA) were taken from [50] (see Fig. A inS2 File, in red). The origi-nal values, ranging from 0 to 2.534, were scaled between 0 and 1.
Circular variance. The circular variance (CV) is a geometrical measure of the vectorial
distribution of a set of neighboring points localized around the center of a three dimensional sphere of radiusrc[51,52]. The CV value of an atomi is computed as:
CVðiÞ ¼ 1 1 ni X j6¼i;ri�rc ~ rij k~rijk � � � � � � � � � � ð1Þ
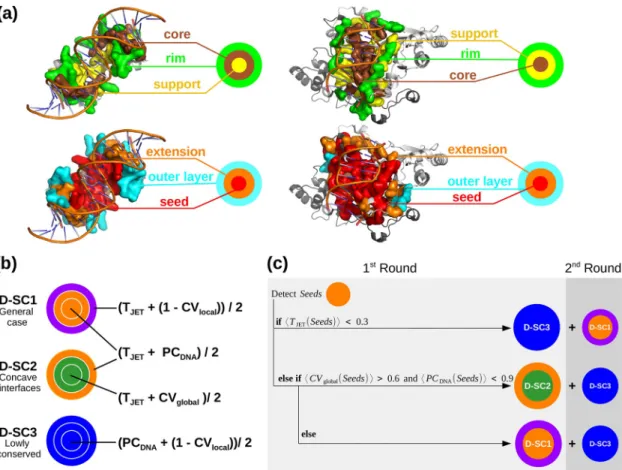
whereniis the number of all individual atoms distant by less thanrcÅ from atom i. The CV value of a residue is then computed as the average of the atomic CVs, over all its atoms. Fig 1. Experimental interface definition,JET2
DNAscoring schemes and complete automated clustering procedure. (a) Top, sections of two experimental interfaces (on the left, PDB code: 1JE8; on the right, PDB code: 1D02). Bottom, the corresponding JET2
DNAprediction using D-SC2. The experimental and predicted interface residues are displayed in opaque surfaces:support, core andrim are in yellow, brown and green, respectively; cluster seed, extension and outer layer are in red, orange and cyan, respectively;
(b) Schematic representation of the three scoring schemes provided inJET2
DNA. TJET: conservation level, PCDNA: protein-DNA interface propensities, CVlocaland CVglobal: local and global circular variance computed with a radius of 12Å and 100 Å, respectively. Different colors correspond to different combinations of properties used to predict interface residues in the three steps of the clustering procedure. (c) Schematic representation of the complete automatedJET2
DNAclustering procedure.
Given a residue, its CV value reflects the protein density around it. A low CV value (close to 0) indicates that a residue is located in a protruding region of the protein surface, while a high value (close to 1) indicates it is buried within the protein. By consequence, the complement measure (1- CV) shows low values for buried residues and high values for protruding ones. As described in the following, since the algorithm clusters together highly scored residues, the CVglobalmeasure is then used to detect globally buried residues, while (1− CVlocal) is used to detect locally protruding ones.
Varying the radius cutoffrcallows describing the local (CVlocal,rc= 12Å) and the global
(CVglobal,rc= 100Å) geometry of the surface. The values of rcfor CVlocaland CVglobalare the same ones we already used in [32] to predict protein-protein interfaces. In [32], we showed that thresholds in the range 10-14Å for CVlocalwould not change the results. On the other hand, a CVglobalvalue of 100Å ensures the inclusion of essentially all protein atoms in the cal-culation. Setting the threshold to a value larger than the standard protein size does not affect the efficiency nor the outcome of the calculation.
JET
2DNA
workflow
TheJET2DNAmethod requires as input a protein query sequence for which three-dimensional
(3D) structural coordinates are available in the PDB. It computes TJET, PCDNA, CVglobaland CVlocalvalues and it combines them to assign a score to each residue. Different combinations are implemented in three different scoring schemes (D-SC inFig 1b) designed to detect differ-ent types of protein-DNA interfaces (seeResults). The computed scores are used to rank, select and cluster protein residues. The clustering algorithm is adapted from the protein-protein interface prediction method JET/JET2[32,46]. First, highly scored residues proximal in 3D space are clustered together to formseeds. Then, the seeds are extended by progressively adding
highly scored neighboring residues. At this stage, if two predicted patches are in contact, they will be merged. Finally, the prediction is completed with anouter layer of residues. The seed, extension and outer layer (Fig 1a, in red, orange and cyan, respectively) approximate the sup-port, core and rim (Fig 1a, in yellow, brown and green, respectively) detected in experimental interfaces. For a more detailed description of the three-steps clustering procedure see Table C inS1 File.JET2
DNAimplements an automated procedure to choose the most appropriate scoring
scheme for the studied system (Fig 1c; see alsoAutomated clustering procedure). Alternatively,
the user can manually choose a scoring scheme. The user has the possibility to complement the predictions with another round of the clustering procedure using a complementary scoring scheme (Fig 1c; see alsoComplete clustering procedure). To get more robust predictions, several
iterations ofJET2DNAcan be run (iJET 2
DNA; see alsoIterative mode). A schematic representation
of theJET2
DNApipeline is reported in Fig. B inS2 File. In the following, we explain in details the
new criteria and new procedures implemented inJET2
DNA, compared to JET
2 [32].
Modification of the expected size of the interface. At each step of the clustering
proce-dure,JET2DNAuses two thresholds, namelyscore
layer
res andscore layer
clus , that respectively determine which residues should be considered as candidates for the predicted patches and when the process of growing each patch should be stopped. The set up of these threshold is based on the expected relative size of a protein-DNA interface,fDNA
intfracðxÞ. fintfracDNAðxÞ was determined by plotting the percentage of interface residues versus the total number of surface residues for HR-PDNA187 (Fig. C inS2 File, circles). The function that best approximates our data is
fDNA
intfracðxÞ ¼ ð2:66= ffiffiffi
x
p
Þ þ 0:03 (Fig. C inS2 File, solid line), wherex is the number of protein
surface residues. Compared to protein-protein interfaces [32], DNA-binding sites cover a larger portion of the protein surface (Fig. C inS2 File, compare dotted and solid lines).
Dynamic set up of the residue and cluster thresholds. Contrary to JET2algorithm, wherescorelayer
res andscore layer
clus thresholds were fixed at the beginning of the clustering procedure and could not be changed, inJET2DNAwe decided to initially fix them more stringently and
relax them in a second stage, if the prediction is smaller than two thirds (<70%) of the expected size (Fig. B inS2 File, in red). This dynamic set up limits false positives in cases where surface regions outside but close to the interface display a detectable signal. It should be noted that the thresholds inJET2
DNA, even relaxed, remain stricter than the ones in JET
2
. Details about thresh-old values used inJET2
DNAare given in Table D inS1 File.
Avoiding small-ligand binding pockets. Like protein-protein interactions, protein-DNA
interactions are often mediated or regulated by small ligands. As a result, a significant number of protein-protein and protein-DNA interfaces are close to or overlapping small ligand-bind-ing pockets. These pockets are generally very conserved (e.g. active sites of enzymes) [32] and may thus confound the prediction. In JET2, we resolved the issue by designing a specific scor-ing scheme exploitscor-ing the fact that small ligand-bindscor-ing pockets are more deeply buried than protein-protein interfaces (see SC2 in Fig. 2 from [32]). The specific detection of protein-DNA interfaces is more difficult, as these interfaces are more concave than protein-protein interfaces (compare (1-CV) boxplots inFig 2e–2g). To tackle the problem, we implemented a procedure inJET2
DNAthat redefinesseeds when they are too buried. Specifically, if a seed comprises a
sig-nificant proportion (>20% for D-SC1, >30% for D-SC2) of highly buried residues, then the clustering procedure restarts avoiding such residues (Fig. B inS2 File, in blue). The procedure does not apply to D-SC3 as this scoring scheme specifically selects protruding/exposed resi-dues. Residues were considered as highly buried if their CVlocalwas higher than CVlocalhigh= 0.9. They represent less than 3% of the protein surface (Fig. D inS2 File).
Filtering out putative false positive clusters. In JET2, small patches were filtered out based on the comparison between their size and the size distribution of randomly generated patches [46] after theseed or extension steps, depending on the scoring scheme used. In the
case of protein-DNA interfaces, we observed that this procedure removed too many true posi-tives. Hence, we modified it inJET2DNA. Namely, we first detect all possibleseeds and extend
them. Then, if the patches represents more than two thirds (>70%) of the expected size of the interface, we iteratively filter them starting from the smallest one (Fig. B inS2 File, in green). To eliminate aberrant predictions, clusters composed of 1 or 2 residues are still systematically filtered out.
Automated clustering procedure
The implemented algorithm is described inFig 1cand Table E inS1 File. By default,JET2 DNA
first detectsseeds using D-SC1 (TJET+ PCDNA). If these display a very low conservation signal (average TJET<0.3) then the strategy is to exploit the other two descriptors and look for locally protruding residues that satisfy expected physico-chemical properties (D-SC3). Otherwise, the algorithm analyses the physico-chemical and the geometrical properties of the detectedseeds.
If theseeds are in a very concave region (average CVglobal>0.6) and do not display highly favor-able physico-chemical properties (average PCDNA<0.9), then the algorithm switches from D-SC1 to D-SC2, where CVglobalis employed to accurately detect an “enveloping” (concave) interface. Otherwise, physico-chemical properties are considered the driving force for an accu-rate prediction of the interface.
Selecting residues with a CVglobal>0.6 allows to well define globally concave protein regions, giving a good compromise between too small and too large ones (see Fig. E(a) and Fig. E(b) inS2 File, on top).
Complete clustering procedure
A complete procedure is available for both manual and automated clustering procedure and is described inFig 1cand Table E inS1 File(see also Fig. B inS2 File, in yellow). It consists in complementing the main clusters predicted in the first round by secondary clusters detected by another scoring scheme. D-SC3 will be used in the second round if D-SC1 or D-SC2 were chosen as main scoring schemes. D-SC1 will be the complementary one when D-SC3 is used in the first round.
Iterative mode
MultipleJET2
DNAruns may lead to slightly different predictions, due to the Gibbs sampling of
the sequences. To get more robust predictions,JET2
DNAcan be run in an iterative mode of the
program, which we calliJET2DNA. In this way, we can compute the number of times a given
Fig 2. Signals detected in experimental interfaces. The calculations in (a)-(f) were performed on the HR-PDNA187 dataset. The
plot in (g) was taken from Fig. 1a in [32]. Thesupport, core and rim are in yellow, brown and green, respectively. Atomic contacts are
defined by an atomic distance < 5Å. (a) Total number of atomic contacts between protein interface residues, divided in support, core andrim, and DNA backbone atoms (plain color) and DNA base atoms (diagonal hatching). (b) Distributions of the proportion of
residues comprised insupport, core and rim. (c) Distributions of the average number of atomic contacts per interface residue.
Interface residues are divided insupport, core and rim. One outlier point, reaching a value of 206, was removed in the boxplot of the
distribution ofcore residues. (d) Distributions of the proportion of atomic contacts established by support, core and rim residues with
DNA backbone atoms and DNA base atoms. (e-g) Distributions of the proportion of interface residues, divided insupport, core and rim, having values above the median value computed over the entire protein. TJET: conservation level, PCDNA: protein-DNA interface propensities, PCprot: protein-protein interface propensities, CVlocaland CVglobal: local and global circular variances computed with a radius of 12Å and 100Å, respectively. Distributions are computed on: (e) all protein-DNA interfaces from HR-PDNA187, (f) all polymerases interfaces from HR-PDNA187, (g) all the 176 protein-protein interfaces in PPDBv4 (see Fig. 1a in [32]).
residue is detected in a cluster divided by the total number of runs. The result will be a number comprised between 0 and 1 and it reflects the probability of the given residue to be at an interface.
Evaluation of performances
We used six standard measures of performance:
Sens ¼ TP TP þ FN; PPV ¼ TP TP þ FP; Spe ¼ TN TN þ FP; Acc ¼ TP þ TN TP þ FN þ TN þ FP; F1 ¼2 �Sens � PPV Sens þ PPV ; MCC ¼ TP � TN FP � FN ffiffiffiffiffiffiffiffiffiffiffiffiffiffiffiffiffiffiffiffiffiffiffiffiffiffiffiffiffiffiffiffiffiffiffiffiffiffiffiffiffiffiffiffiffiffiffiffiffiffiffiffiffiffiffiffiffiffiffiffiffiffiffiffiffiffiffiffiffiffiffiffiffiffiffiffiffiffiffiffiffiffiffiffiffiffi ðTP þ FPÞðTP þ FNÞðTN þ FPÞðTN þ FNÞ p
where TP (true positives) are the number of residues correctly predicted as interacting, TN (true negatives) are the number of residues correctly predicted as non-interacting, FP (false positives) are the number of non-interacting residues incorrectly predicted as interacting and FN (false negatives) are the number of interacting residues incorrectly predicted as non-inter-acting. Thus, in our case,Sensitivity (Sens) measures the proportion of true interface residues
that were correctly predicted as interacting with respect to the total number of interface resi-dues; thePositive Predictive Value (PPV) measures the proportion of true interface residues
that were correctly predicted as interacting with respect to the total number of predicted resi-dues; theSpecificity (Spe) measures the proportion of true non-interface residues that were
cor-rectly predicted as non-interacting with respect to the total number of non-interface residues;
Accuracy (Acc) measures the proportion of correctly predicted residues (interacting and
non-interacting) with respect to the total number of residues;F1 score is a weighted average,
specif-ically the harmonic mean, betweenSensitivity and PPV, measuring the balance between these
two;Matthew’s Correlation Coefficient (MCC) is a correlation coefficient between observed
and predicted residues. TheMCC is the only measure varying in the range [-1, 1], where 0
rep-resents a prediction no better than random. All the other measures return values in the range [0, 1]. We multiplied by 100 all the statistical values reported in tables and figures, representing them in percentages varying in the range [-100, 100] for theMCC, and [0, 100] for the other
measures.
To assess the statistical significance of the differences in performance between each pair of methods, we relied on the pairedt-test when the distributions were normal and on the
Wil-coxon signed-rank test [53] otherwise. To verify if the data were normally distributed we used the Anderson-Darling test [54]. The difference was considered significant when the p-value was lower than 0.05.
Choice of the other methods
To compareJET2
DNAperformance, we considered a large set of popular DNA-binding site
pre-dictors [5–18,20–24,55,56]. Among those, we discarded BindN [8], BindN+ [9], BindN-RF [12], MetaDBsite [55], PreDs [21], DBindR [13], PreDNA [10], DBD-Hunter [23], RBscore [20,56] and PDNAsite [16] as their web servers are no longer available or do not work. We finally retained three methods with a relatively short runtime, namely DISPLAR [7], multi-VORFFIP [15] and DRNApred [18]. DISPLAR was reported to show better performance than DP-Bind [11] and is more recent than DBS-Pred [6] and DBS-PSSM [5]. multiVORFFIP was chosen because it showed good performance on protein-protein interfaces prediction [32]. DRNApred is a very recent predictor that uses only sequence information and which aims at specifically detecting DNA-binding residues, discriminating them from RNA-binding resi-dues. We ran the three tools with the default parameters. Since multiVORFFIP does not
provide binary prediction results (binding versus non-binding residues), predicted residues were defined by those with a normalized score (probability) > 0.5.
Results
Support-Core-Rim vs Core-Support-Rim model for protein-DNA
interactions
To identify characteristic features of protein-DNA interfaces, we analysed the non-redundant set of protein structures bound to DNA available in the PDB. This dataset, HR-PDNA187, comprises 187 high-resolution crystallographic structures, covers all major types of DNA-interactions and spans a wide range of protein functions (seeMaterials and methods). Inter-face residues were classified based on thesupport-core-rim model (Fig 1a, on top) proposed for protein-protein interfaces [34]. Thesupport (in yellow) comprises residues buried both in
presence and absence of DNA, thecore (in brown) comprises residues exposed in absence of
DNA and becoming buried upon binding, and therim (in green) comprises residues exposed
both in presence and absence of DNA (seeMaterials and methods). In protein-protein inter-faces, the three components are spatially organized in concentric layers, with thesupport at the
center, thecore in an intermediate position and the rim on the external border (see Fig. 2 in
[32]). In protein-DNA interfaces, in addition to this spatial organization (Fig 1a, on top left), we also observe an organization where thesupport and the core switch positions (Fig 1a, on top right). This variety reflects the different ways a protein may bind to DNA.
However,support, core and rim residues seem to play the same role during the DNA
bind-ing in both structural organizations described above. Overall,core residues establish the
major-ity of the atomic contacts (defined by an atomic distance<5Å) (Fig 2a and 2c) with both DNA backbone and DNA base atoms (Fig 2a), despite a comparable number ofsupport, core and rim residues in HR-PDNA187 (Fig 2b) (support: 2501, core: 2958, rim: 2891). More than 75%
of protein-DNA base contacts involvecore residues (Fig 2a and 2d), whilesupport and rim
resi-dues prevalently establish contacts with DNA backbone atoms (Fig 2a and 2d).
Characteristics of protein-DNA interfaces
To characterize experimental protein-DNA interfaces, we relied on evolutionary conservation (TJET), DNA-binding propensity (PCDNA) and local and global burial degree (CVlocaland CVglobal) (Materials and methodsfor precise definitions of the descriptors). Specifically, for each complex we computed the percentage of residues located in thesupport, core and rim,
dis-playing higher values than the median computed over the entire protein (Fig 2e and 2f). The resulting distributions were compared with those obtained for the 176 protein-protein com-plexes of the Protein-Protein Docking Benchmark version 4 (PPDBv4) [57] (Fig 2g), already reported in Fig. 1a in [32].
DNA binding sites, especially thesupport and the core, are significantly more conserved
than the rest of the entire protein (Fig 2e, TJET). This conservation signal is stronger than in protein-protein interfaces (compareFig 2e and 2g). Residues with high DNA-binding propen-sities tend to be located in thecore and rim (Fig 2e, PCDNA). By contrast, residues displaying physico-chemical properties favourable to protein-protein binding are mainly found in the
support, and to a lesser extent in the core, of protein-protein interfaces (Fig 2g, PCprot). These different geometrical distributions reflect differences between the two PC scales (Fig. A inS2 File). Protein-DNA interfaces are enriched in positively charged and polar residues, which tend to prefer regions exposed to the solvent. By contrast, protein-protein interfaces are enriched in hydrophobic residues, which prefer to be located towards the interior of the
interface. Regarding the surface geometry, thecore and rim of protein-DNA interfaces are
enriched in locally protruding residues (Fig 2e, (1-CVlocal)), as observed for protein-protein interfaces (Fig 2g). When looking at the status of the interface with respect to the global shape of the protein surface (1-CVglobal), we found that the enzymes, and in particular the polymer-ases and some nuclepolymer-ases, display a very specific profile (compareFig 2e and 2f). All three inter-face components, especially thesupport and the core, are located in concave protein regions
(Fig 2f), indicating that these proteins bind to DNA by “enveloping” it.
Overall, this analysis showed that protein-DNA interfaces encode signals that can be described by a few residue-based features and that the way these signals are distributed can be described using thesupport-core-rim model. It also confirmed that protein-DNA interfaces are
more conserved than protein-protein interfaces, as reported in [37,58,59]. They display spe-cific physico-chemical and geometrical characteristics that vary depending on the type of pro-tein-DNA interaction considered. Hence, the correct detection of these interfaces requires the development of adapted scoring strategies.
Three strategies to detect protein-DNA interfaces
Following thesupport-core-rim model (Fig 1a, on top), we use a predictive model comprising three components (Fig 1a, on bottom), namely theseed (in red), the extension (in orange) and
theouter layer (in cyan). JET2
DNAimplements different algorithms and scores to detect each
one of these components (seeMaterials and methods). To be able to predict a wide range of protein-DNA interfaces, we devised three scoring schemes (see D-SC1-3,Fig 1b). Each D-SC combines TJET, PCDNA, CVlocaland CVglobalin a different way. As thesupport and the core may exchange their positions, the same combination is used forseed detection and extension
in all D-SC (Fig 1b, same color for the two first layers). Specifically,
• D-SC1 first detects highly conserved residues with good physico-chemical properties (high values of (TJET+ PCDNA)) and completes the prediction with conserved locally protruding residues (high values of (TJET+ (1− CVlocal))). It aims at detecting generic DNA-binding sites.
• D-SC2 clusters together conserved residues located in highly concave regions (high values of (TJET+ CVglobal)); then, the prediction is completed by adding anouter layer of conserved residues displaying good physico-chemical properties (high values of (TJET+ PCDNA)). It is designed to specifically detect interfaces characteristic of the “enveloping” binding mode dis-played by polymerases.
• D-SC3 leaves out conservation, focusing on locally protruding residues displaying good phy-sico-chemical properties (high values of (PCDNA+ (1− CVlocal))). It is intended to deal with cases where no evolutionary information is available or the whole protein displays a homo-geneous conservation signal. Moreover, it is useful to complete predictions of the previous two scoring schemes, when some residues are less or no conserved than the rest of the bind-ing site, sometimes because they are DNA sequence specific for a subfamily of the DNA-binding protein (seeFig 3, bottom panel, andDiscovery of alternative DNA-binding sites).
Examples of predictions are shown onFig 3. D-SC1 is particularly suited for double-headed interfaces stacking in the DNA grooves and some single-headed interfaces. These binding modes are often adopted by transcription factors, regulatory proteins and some glycosilases. The “enveloping” mode captured by D-SC2 is found in many polymerases and nucleases. D-SC3 deals with cases where physico-chemical and geometrical properties have a better dis-criminative power than conservation. By default,JET2DNAwill automatically determine the
scoring scheme the most suited to the protein being analyzed (Fig 1c). In Fig. E inS2 File, we report five examples of predictions byJET2
DNAautomated clustering procedure. In the first
three cases, the protein concave regions coincide with the respective DNA-binding sites and theJET2
DNAautomated clustering procedure is able to correctly choose, for the first and third
cases, the D-SC2 scoring scheme designed to accurately predict these types of protein-DNA interfaces (Fig. E(a) inS2 File, on bottom). Concerning the second case of Fig. E(a) inS2 File, theJET2DNAautomated clustering procedure chose D-SC1, likely due to the physico-chemical
properties of this region. However, the predicted region by D-SC1 mostly overlap with the D-SC2 one. In the other two cases, the concave regions are distant from the respective DNA-binding sites and theJET2
DNAautomated clustering procedure is able to avoid them and predict
the correct DNA-binding sites by choosing D-SC1 (Fig. E(b) inS2 File, on bottom), likely because the conservation and physico-chemical properties of the concave regions do not match with the ones expected for DNA-binding sites. Alternatively, the user can apply the scoring scheme of his/her choice.
Some DNA-binding sites may be comprised of several regions exhibiting different signals. To correctly detect those,JET2
DNAimplements acomplete procedure where patches predicted in
Fig 3. Examples of DNA-binding sites predicted byiJET2
DNA. In the first column, the experimental complexes formed between the proteins of interest (greyscaled colored chains) and the DNA (orange) are represented as cartoons. In second and third columns, the experimental and predicted DNA-binding sites are displayed as opaque surfaces, respectively. The experimental interface residues are colored according to conservation levels (TJETvalues) computed byiJET2
DNA.iJET 2
DNApredictions, obtained from a consensus of 2 runs out of 10, are colored according to the scoring scheme: D-SC1 in orange, D-SC2 in dark green and D-SC3 in blue. Statistical performance values are given in percentages.
a first round are complemented by patches predicted in a second round and using a comple-mentary scoring scheme (Fig 1c). An example of prediction is given inFig 3(bottom panel). It may also happen that the DNA-binding site is overlapping or in close proximity to a small ligand binding pocket.JET2
DNAimplements a procedure to specifically avoid these pockets (see
Materials and methods). The impact of such procedure can be appreciated on Fig. F inS2 File.
Overall assessment of
JET
2DNAperformance
We report results obtained using the iterative mode ofJET2
DNA(iJET 2
DNA, seeMaterials and
methods), with a consensus of 2 and 8 iterations out of 10. For each protein, the best predicted patch or combination of patches among the three scoring schemes was retained for the evalua-tion.iJET2DNAreaches an average F1-score of 61% on HR-PDNA187 and of 58-59% on a subset
of 82 proteins (HOLO-APO82) for which unbound forms are available (Table F inS1 File
andFig 4, on top). The performance is similar on bound and unbound forms, indicating that JET2
DNAis robust to conformational changes associated with DNA-binding. For the vast
major-ity of proteins (82%), the sensitivmajor-ity attained on the unbound form is at least as high as 90% of the sensitivity on the bound form, and in some cases it is even higher than 100%. Hence, JET2
DNAis able to detect interacting residues even when they are ‘hidden’ by conformational
changes. Moreover, the extent of the conformational change is not correlated with the differ-ence in performance (Fig. G-I inS2 File). The predictions are also robust to stoichiometry changes (Table G inS1 File). Varying the consensus threshold enables shifting the balance between sensitivity (Sens) and precision (or predictive positive value, PPV), such that the lower threshold (2/10) yields more extended predictions while the higher threshold (8/10) yields more precise ones. Theseeds on their own cover about a third of the experimental
Fig 4. Comparison ofiJET2
DNA, DISPLAR, multiVORFFIP and DRNApred performance. ForiJET
2
DNA, consensus predictions were obtained from 2 (in light green) and 8 (in dark green) runs out of 10. Statistical performance values are given in percentages.
Top panel. HR-PDNA187 and APO82. To fairly assess DISPLAR, multiVORFFIP and DRNAPred performances, the proteins used
for training these methods were removed from HR-PDNA187. We used a sequence identity cutoff of 95% and ended up with 106 (�), 87 (� �) and 42 (� � �) proteins, respectively. Bottom panel. TEST-NABP82 and its subsets. TEST-DBP49 and TEST-DBP24 contain only DNA-binding sites, while TEST-RBP33 contains only RNA-binding sites. TEST-DBP24 and TEST-RBP33 contain only proteins sharing less than 30% sequence identity with proteins from HR-PDNA187 (seeMaterials and methods). DRNApred and multiVORFFIP were evaluated on their RNA-specific algorithms for the RNA-binding proteins, and on their DNA-specific ones for the DNA-binding proteins.iJET2
DNAand DISPLAR, which do not have a specific algorithm to predict RNA-binding sites, were evaluated on the same algorithm for both DNA- and RNA-binding proteins.
interfaces and contain very few positives (Table H inS1 File). On an independent test set comprising both DNA- and RNA-binding sites (TEST-NABP82),iJET2
DNAachieves an average
F1-score of 45 (Table I inS1 FileandFig 4, on bottom). The sensitivity is roughly the same as for HR-PDNA187 but the precision (PPV) is lower. This can be explained by the fact that the experimental reference interfaces are defined using a much more stringent distance cutoff (see
Materials and methods).iJET2
DNAdetects equally well DNA- and RNA-binding sites (Fig 4, on
bottom, compare TEST-DBP49/24 and TEST-RBP33).
Discovery of alternative DNA-binding sites
The complete and/or automated mode(s) ofJET2
DNAproduce patches that do not match the
experimental interfaces present in our datasets (Table J inS1 File). Due to the relatively small number of protein-DNA complexes available in the PDB, it is difficult to systematically assess the pertinence of these additional predictions. Nevertheless, we could identify several cases where the protein binds to DNA via two completely distinct binding sites. We report four such cases in the following (Fig 5and see Table K inS1 Filefor F1 values).
1. RNA polymerase from bacteriophage T7. This protein first binds the DNA promoter via its recognition site [26,60] (site 1,Fig 5a, left), then undergoes a large conformational change and starts the transcription at its catalytic active site [27] (site 2,Fig 5b, left), where a short strand of RNA is paired to the DNA strand. We considered the ensemble of nucleic acid binding residues as experimental interface. In both structures, D-SC1 (and D-SC2 with comparable values) correctly detected the catalytic active site (Fig 5a and 5b, right, in orange) while D-SC3 predicted the recognition site and some DNA-binding residues flank-ing the active site (Fig 5a and 5b, right, in blue). The fact that the two sites are detected by two different D-SC indicates that they are characterized by different properties, which cor-relate with their respective functions. Indeed, the active site is generic while the recognition site is specific of this protein family [26]. The very high conservation signal of the former masks the weaker signal of the latter (compare colors inFig 5a and 5b, left), which is still detectable based on the other properties.
2. N-terminal domain of the adeno-associated virus replication protein. This protein con-tains three distinct DNA-binding sites [61]: a stem loop sequence specific binding site (site 1,Fig 5c, left), a tetranucleotide repeat recognition site (site 2,Fig 5d, left), and the Tyr153 active site (no PDB structure). D-SC1 and D-SC3 lead to accurate predictions ofsite 1 and site 2 (Fig 5c and 5d), which both display rather low conservation signal and are mostly pro-truding/exposed.
3. Modification-dependent restriction endonuclease. In the original structure from HR-PDNA187 (Fig 5e, left), the DNA is bound only to the winged-helix domain binding site [62] (site 1), while the catalytic domain (site 2) is partially disordered. In the alternative
structure (Fig 5f, left), both DNA-binding sites are occupied. Although the relative domain orientations differ drastically between the two structures,JET2DNAaccurately identified the
two binding sites by combining D-SC1 with D-SC3 (Fig 5e and 5f, right, in orange and in blue). The fact that a combination of D-SC is required reflects the heterogeneity of the con-servation signal within each site (Fig 5e and 5f, left, colored by conservation level). D-SC3 enables rescuing lowly conserved subregions that D-SC1 is not able to detect.
4. Cyclic GMP-AMP synthase. DNA binding to this protein is associated to a catalytic reac-tion producing a cyclic dinucleotide from ATP and GTP. The protein was solved bound to DNA both in monomeric (Fig 5g, left [63]) and dimeric (Fig 5h, left [28]) forms. Since the
Fig 5. Prediction of multiple DNA-binding sites byiJET2
DNA. For each protein (each row), the experimental complex present in HR-PDNA187 and another experimental complex displaying a distinct DNA-binding site are shown on the first and third columns, respectively. For each structure, the ‘main’ DNA-binding site is colored according to TJETvalues and the site coming from the other structure is mapped and displayed in transparent grey. TheiJET2
DNApredictions computed on each experimental structure are displayed on the second and fourth columns, respectively, and colored according to the scoring scheme. (a-b) RNA polymerase from bacteriophage T7 (PDB: 1CEZ and 1MSW); (c-d) N-terminal domain of the adeno-associated virus replication protein (1UUT and 1RZ9); (e-f) R.DpnI modification-dependent restriction endonuclease (4ESJ and 4KYW); (g-h) Cyclic
small ligand-binding active site is much more conserved than the DNA-binding sites, this case is particularly difficult. In the monomeric form, only D-SC3 is able to identify the two DNA-binding sites (Fig 5g, right, in blue). Upon dimerization, the interface geometry changes such that the two sites form a large concave region (Fig 5h, left), detected by D-SC2. Complementing the prediction with D-SC3 further improves the prediction (Fig 5h, right, in dark green and in blue).
These examples illustrate the different usages ofJET2
DNAmultiple scoring schemes and how
one can learn about each DNA-binding site properties fromJET2
DNApredictions. Specifically,
different D-SC may target different binding sites (recognition or catalytic), or different regions of the same binding site (conservedcore or protruding rim), or even yield overlapping
predic-tions. In all cases,JET2
DNAdetection proved to be robust to extensive conformational changes
and stoichiometry changes.
Comparison with other tools
We comparedJET2
DNAwith three other state-of-the-art machine learning based predictors,
namely DISPLAR [7], multiVORFFIP [15] and DRNApred [18] (seeMaterials and methods). iJET2
DNAachieves �20% higher sensitivity and similar accuracy compared to DISPLAR and
multiVORFFIP on all the datasets (Table F and Table I inS1 FileandFig 4). The predictions are slightly less precise (by �5-10%) than those of multiVORFFIP on HR-PDNA187��and
APO82, but equally or more precise than DISPLAR and multiVORFFIP on the other datasets (Table F and Table I inS1 FileandFig 4). This results in �5-10% higher F1 values and most of the times �5-10% higher MCC values compared to both tools (Table F and Table I inS1 File
andFig 4). Compared to DRNApred,iJET2
DNA’s detection is at least twice more sensitive and
at least �10% more precise on all the datasets (Table F and Table I inS1 FileandFig 4). We should stress that DRNApred was designed to specifically discriminate DNA- from RNA-binding residues, which is not the purpose ofJET2
DNA. In particular,JET 2
DNAperforms much
better than the three other tools on the RNA-binding proteins of TEST-RBP33 (Table I inS1 FileandFig 4). Moreover, when looking at the four above mentioned cases of multiple DNA-binding sites,JET2DNAproved more powerful to detect alternative binding sites compared to the
three other tools (Fig. J-L inS2 Fileand Table K inS1 File).
Comparison with other benchmarks
We compared HR-PDNA187 and HOLO-APO82 with the most popular benchmarks, namely PDNA62 [6,64], DBP374 [13], MetaDBsite316 [55], Displar264 [7], PDDB1.2 [65], DBP206 [66], PDNA224 [10] and DNABINDPROT54 [24]. Contrary to our datasets, most of them comprise only single chains, even if the functional biological unit of the protein in complex with DNA is annotated as a multimer. Moreover, when applying to them the PISCES criteria used to construct HR-PDNA187, the number of resulting complexes was systematically smaller than 187 (Table L inS1 File). Finally, very few of them provide the APO forms of the proteins.
Robustness of the results to parameter changes
JET2DNAparameters were set empirically based on our previous experience with JET and JET
2 , our intuition and our analysis of the properties encoded in the experimental interfaces from
GMP-AMP synthase (cGAS) (4K98 and 4LEY).iJET2
DNApredicted patches were obtained from a consensus of 2, for (a-b) and (e-f), or 5, for (c-d) and (g-h), runs out of 10. See Fig. J-L inS2 Fileand Table K inS1 Filefor comparison with other tools.
HR-PDNA187. However, we should stress that we did not use machine learning to infer them. Hence, HR-PDNA187 is not a training setper se. Moreover, JET2
DNAparameters are few,
physi-cally explained and biologiphysi-cally intuitive. To validate our choices, we conducted a thorough analysis of the impact of varying parameters on the predictions (Fig. M-W inS2 File). In total, we ran about 220 000 additionalJET2
DNAcalculations to assess the influence of seven
parame-ters. These include the thresholds (% of residues and CVlocal) used in the detection of small ligand pockets (Fig. Q-W inS2 File), the residue and cluster thresholds used to detect and grow patches (Fig. M-P inS2 File) and the confidence threshold used to filter out small patches (Fig. N-P inS2 File). This analysis showed that our choice of parameters is relevant, as the per-formances obtained with our default values are close to the best one can expect within the JET2
DNAframework. Moreover, we found that our default values are consistent with the
inter-vals/regions they fall in and that there are no abrupt changes in performance within these regions. Hence, our predictions are stable to small parameter changes.
Discussion
We have collected and carefully curated 187 high resolution protein-DNA complexes repre-sentative of all known types of protein-DNA interactions. This new dataset, supplemented by the 82 available protein unbound conformations, could serve as a reference benchmark for the community. Based on the analysis of the evolutionary and structural properties of the DNA-binding sites from this dataset, we have proposed an original method to predict them. Impor-tantly, we do not estimate interacting probabilities for individual residues, but we predict ensembles of residues proximal in 3D space, in other words “patches”. Predictions based on patches are justified by the fact that residues being conserved or displaying specific physico-chemical properties at protein-DNA interfaces tend to cluster together [58,67,68]. Moreover, we propose a “discretized model” of interfaces describing the role of each predicted residue in the interface. This model is inspired by thesupport-core-rim model defined for protein-protein
interfaces. We have shown that it is also useful for protein-DNA interfaces, where thesupport
and thecore may switch their positions. We have defined three archetypal protein-DNA
inter-faces, namely conserved generic, conserved enveloping and not conserved, and have devised three scoring schemes to detect them.
We have thoroughly assessed our method’s performance on bound and unbound protein forms and on an independent dataset.JET2
DNAcompares favorably with machine learning
based state-of-the-art methods. Specifically, the predictions are more sensitive and remarkably robust to extensive conformational changes and to stochiometry changes. Moreover, we have highlighted several cases where the same complex was solved in different conditions or the same protein was able to bind DNA via different locations.JET2
DNAwas able to detect the
‘alter-native’ binding sites despite major conformational changes between the different structures bound to DNA. A single crystallographic structure may reveal only one site or may even com-prise a truncated or misplaced DNA, resulting in a “partial” associated binding site. In this context,JET2
DNAcan be used as a mean to get a more realistic description of known binding
sites, when those are only partially covered experimentally, and to discover yet unknown bind-ing sites.
Beyond predicting DNA-binding sites,JET2DNAprovides a unique way to understand the
origins and properties of these sites and interpret those in light of their functions. Transcrip-tion factors typically display single- or double-headed binding modes [69], with one or two highly conserved binding sites, which are well detected by D-SC1. Enzymes usually have larger interfaces to accommodate an exposed recognition site, detected by D-SC3, and a highly con-served active site, detected by D-SC1, or highly segmented protein-DNA interfaces, where the
protein interacts with the DNA through multidomain units in addition to their active site [25,
69,70]. Moreover,JET2
DNAis useful to unravel the heterogeneity of signals comprised within
given binding sites and to partition them in subregions displaying coherent properties. The predictions can help designing or repurposing small molecules to target protein-DNA inter-faces in an intelligent way,e.g. specifically targeting the non-conserved subregions to avoid
side effects.
There is growing experimental evidence that protein surfaces are used in many different ways by many partners. For example, for protein-protein interactions, it is now clear that sev-eral proteins can use the same region at the surface of a partner, possibly in different confor-mations, that binding sites can be overlapping and that different binding site properties relate to different interaction “types” or “functions” [33]. For protein-DNA interactions, the available structural data is much smaller. Still, the examples we showed let us envision a much larger complexity in the usage of protein surfaces by DNA than expected. Our work is inscribed in an effort to decipher such complexity.
Finally, we found thatJET2
DNAcan be successfully applied to the prediction of RNA-binding
sites. This is in line with the growing body of evidence showing that proteins that bind DNA are also likely to bind RNA. Indeed, although DNA-binding proteins used to be considered as functionally different from RNA-binding proteins and studied independently, this view has become outdated [29]. There are many examples of proteins binding both nucleic acids either via the same region at different times or simultaneously via distinct regions. Some crystallo-graphic structures of complexes between proteins and hybrid D/RNA molecules are also avail-able in the PDB. Hence, discriminating DNA- from RNA-binding residues is very challenging. The DRNApred method [18] represents a recent effort to address this issue. We found that it predicts very few residues, compared toJET2DNA. A future development forJET
2
DNAcould be to
include some RNA-specific features toward a better prediction of RNA-binding sites. It could be advantageous to include disorder information, an electrostatic potential in addition or replacing the residue propensities and/or restricting the calculation of the evolutionary conser-vation to the subfamily associated to the query protein. This could help in identifying family-or even protein-specific interfaces.
Supporting information
S1 File. Supplementary tables.(PDF)
S2 File. Supplementary figures.
(PDF)
Acknowledgments
We thank Chloe´ Dequeker for sharing her scripts, N. Fernandez-Fuentes for indicating good practice for using the multiVORFFIP method and DISPLAR’s authors for helping us in run-ning the tool.
Author Contributions
Conceptualization: Richard Lavery, Elodie Laine, Alessandra Carbone. Data curation: Flavia Corsi.
Methodology: Elodie Laine, Alessandra Carbone. Software: Flavia Corsi, Elodie Laine.
Supervision: Elodie Laine, Alessandra Carbone. Validation: Flavia Corsi.
Writing – original draft: Flavia Corsi, Elodie Laine, Alessandra Carbone.
References
1. Luscombe NM, Austin SE, Berman HM, Thornton JM. An overview of the structures of protein-DNA complexes. Genome Biology. 2000; 1(1):reviews001–1. https://doi.org/10.1186/gb-2000-1-1-reviews001PMID:11104519
2. Bullock AN, Fersht AR. Rescuing the function of mutant p53. Nature Reviews Cancer. 2001; 1(1):68.
https://doi.org/10.1038/35094077PMID:11900253
3. Chen-Plotkin AS, Lee VMY, Trojanowski JQ. TAR DNA-binding protein 43 in neurodegenerative dis-ease. Nature Reviews Neurology. 2010; 6(4):211.https://doi.org/10.1038/nrneurol.2010.18PMID:
20234357
4. Berman HM, Westbrook J, Feng Z, Gilliland G, Bhat TN, Weissig H, et al. The protein data bank. Nucleic Acids Research. 2000; 28(1):235–242.https://doi.org/10.1093/nar/28.1.235PMID:10592235
5. Ahmad S, Sarai A. PSSM-based prediction of DNA binding sites in proteins. BMC Bioinformatics. 2005; 6(1):33.https://doi.org/10.1186/1471-2105-6-33PMID:15720719
6. Ahmad S, Gromiha MM, Sarai A. Analysis and prediction of DNA-binding proteins and their binding resi-dues based on composition, sequence and structural information. Bioinformatics. 2004; 20(4):477–486.
https://doi.org/10.1093/bioinformatics/btg432PMID:14990443
7. Tjong H, Zhou HX. DISPLAR: an accurate method for predicting DNA-binding sites on protein surfaces. Nucleic Acids Research. 2007; 35(5):1465–1477.https://doi.org/10.1093/nar/gkm008PMID:17284455
8. Wang L, Brown SJ. BindN: a web-based tool for efficient prediction of DNA and RNA binding sites in amino acid sequences. Nucleic Acids Research. 2006; 34(suppl_2):W243–W248.https://doi.org/10. 1093/nar/gkl298PMID:16845003
9. Wang L, Huang C, Yang MQ, Yang JY. BindN+ for accurate prediction of DNA and RNA-binding resi-dues from protein sequence features. BMC Systems Biology. 2010; 4(1):S3.https://doi.org/10.1186/ 1752-0509-4-S1-S3PMID:20522253
10. Li T, Li QZ, Liu S, Fan GL, Zuo YC, Peng Y. PreDNA: accurate prediction of DNA-binding sites in pro-teins by integrating sequence and geometric structure information. Bioinformatics. 2013; 29(6):678– 685.https://doi.org/10.1093/bioinformatics/btt029PMID:23335013
11. Hwang S, Gou Z, Kuznetsov IB. DP-Bind: a web server for sequence-based prediction of DNA-binding residues in DNA-binding proteins. Bioinformatics. 2007; 23(5):634–636.https://doi.org/10.1093/ bioinformatics/btl672PMID:17237068
12. Wang L, Yang MQ, Yang JY. Prediction of DNA-binding residues from protein sequence information using random forests. BMC Genomics. 2009; 10(1):S1.https://doi.org/10.1186/1471-2164-10-S1-S1
PMID:19594868
13. Wu J, Liu H, Duan X, Ding Y, Wu H, Bai Y, et al. Prediction of DNA-binding residues in proteins from amino acid sequences using a random forest model with a hybrid feature. Bioinformatics. 2008; 25 (1):30–35.https://doi.org/10.1093/bioinformatics/btn583PMID:19008251
14. Nimrod G, Schushan M, Szila´gyi A, Leslie C, Ben-Tal N. iDBPs: a web server for the identification of DNA binding proteins. Bioinformatics. 2010; 26(5):692–693.https://doi.org/10.1093/bioinformatics/ btq019PMID:20089514
15. Segura J, Jones PF, Fernandez-Fuentes N. A holistic in silico approach to predict functional sites in pro-tein structures. Bioinformatics. 2012; 28(14):1845–1850.https://doi.org/10.1093/bioinformatics/bts269
PMID:22563069
16. Zhou J, Xu R, He Y, Lu Q, Wang H, Kong B. PDNAsite: identification of DNA-binding site from protein sequence by incorporating spatial and sequence context. Scientific reports. 2016; 6:27653.https://doi. org/10.1038/srep27653PMID:27282833
17. Zhu X, Ericksen SS, Mitchell JC. DBSI: DNA-binding site identifier. Nucleic acids research. 2013; 41 (16):e160–e160.https://doi.org/10.1093/nar/gkt617PMID:23873960
18. Yan J, Kurgan L. DRNApred, fast sequence-based method that accurately predicts and discriminates DNA-and RNA-binding residues. Nucleic acids research. 2017; 45(10):e84–e84.https://doi.org/10. 1093/nar/gkx059PMID:28132027
19. Miao Z, Westhof E. Prediction of nucleic acid binding probability in proteins: a neighboring residue net-work based score. Nucleic acids research. 2015; 43(11):5340–5351.https://doi.org/10.1093/nar/ gkv446PMID:25940624
20. Miao Z, Westhof E. RBscore&NBench: a high-level web server for nucleic acid binding residues predic-tion with a large-scale benchmarking database. Nucleic acids research. 2016; 44(W1):W562–W567.
https://doi.org/10.1093/nar/gkw251PMID:27084939
21. Tsuchiya Y, Kinoshita K, Nakamura H. PreDs: a server for predicting dsDNA-binding site on protein molecular surfaces. Bioinformatics. 2004; 21(8):1721–1723.https://doi.org/10.1093/bioinformatics/ bti232PMID:15613393
22. Chen YC, Wright JD, Lim C. DR_bind: a web server for predicting DNA-binding residues from the pro-tein structure based on electrostatics, evolution and geometry. Nucleic Acids Research. 2012; 40(W1): W249–W256.https://doi.org/10.1093/nar/gks481PMID:22661576
23. Gao M, Skolnick J. DBD-Hunter: a knowledge-based method for the prediction of DNA–protein interac-tions. Nucleic Acids Research. 2008; 36(12):3978–3992.https://doi.org/10.1093/nar/gkn332PMID:
18515839
24. Ozbek P, Soner S, Erman B, Haliloglu T. DNABINDPROT: fluctuation-based predictor of DNA-binding residues within a network of interacting residues. Nucleic Acids Research. 2010; 38(suppl_2):W417– W423.https://doi.org/10.1093/nar/gkq396PMID:20478828
25. Wodak SJ, Janin J. Structural basis of macromolecular recognition. Advances in Protein Chemistry. 2002; 61:9–73.https://doi.org/10.1016/s0065-3233(02)61001-0PMID:12461820
26. Cheetham GM, Jeruzalmi D, Steitz TA. Structural basis for initiation of transcription from an RNA poly-merase–promoter complex. Nature. 1999; 399(6731):80.https://doi.org/10.1038/19999PMID:10331394
27. Yin YW, Steitz TA. Structural basis for the transition from initiation to elongation transcription in T7 RNA polymerase. Science. 2002; 298(5597):1387–1395.https://doi.org/10.1126/science.1077464PMID:
12242451
28. Li X, Shu C, Yi G, Chaton CT, Shelton CL, Diao J, et al. Cyclic GMP-AMP synthase is activated by dou-ble-stranded DNA-induced oligomerization. Immunity. 2013; 39(6):1019–1031.https://doi.org/10.1016/ j.immuni.2013.10.019PMID:24332030
29. Hudson WH, Ortlund EA. The structure, function and evolution of proteins that bind DNA and RNA. Nat Rev Mol Cell Biol. 2014; 15(11):749–760.https://doi.org/10.1038/nrm3884PMID:25269475
30. Andrabi M, Mizuguchi K, Ahmad S. Conformational changes in DNA-binding proteins: Relationships with precomplex features and contributions to specificity and stability. Proteins: Structure, Function, and Bioinformatics. 2014; 82(5):841–857.https://doi.org/10.1002/prot.24462
31. Mierzejewska K, Siwek W, Czapinska H, Kaus-Drobek M, Radlinska M, Skowronek K, et al. Structural basis of the methylation specificity of R. DpnI. Nucleic Acids Research. 2014; 42(13):8745–8754.
https://doi.org/10.1093/nar/gku546PMID:24966351
32. Laine E, Carbone A. Local geometry and evolutionary conservation of protein surfaces reveal the multi-ple recognition patches in protein-protein interactions. PLoS Computational Biology. 2015; 11(12): e1004580.https://doi.org/10.1371/journal.pcbi.1004580PMID:26690684
33. Dequeker C, Laine E, Carbone A. Decrypting protein surfaces by combining evolution, geometry and molecular docking. Proteins: Structure, Function, and Bioinformatics. 2019; 87(11):952–965.https:// doi.org/10.1002/prot.25757
34. Levy ED. A simple definition of structural regions in proteins and its use in analyzing interface evolution. Journal of Molecular Biology. 2010; 403(4):660–670.https://doi.org/10.1016/j.jmb.2010.09.028PMID:
20868694
35. Chakrabarti P, Janin J. Dissecting protein–protein recognition sites. Proteins: Structure, Function, and Bioinformatics. 2002; 47(3):334–343.https://doi.org/10.1002/prot.10085
36. Bahadur RP, Chakrabarti P, Rodier F, Janin J. Dissecting subunit interfaces in homodimeric proteins. Proteins: Structure, Function, and Bioinformatics. 2003; 53(3):708–719.https://doi.org/10.1002/prot. 10461
37. Biswas S, Guharoy M, Chakrabarti P. Dissection, residue conservation, and structural classification of protein-DNA interfaces. Proteins: Structure, Function, and Bioinformatics. 2009; 74(3):643–654.https:// doi.org/10.1002/prot.22180
38. Berman HM, Olson WK, Beveridge DL, Westbrook J, Gelbin A, Demeny T, et al. The nucleic acid data-base. A comprehensive relational database of three-dimensional structures of nucleic acids. Biophysi-cal Journal. 1992; 63(3):751–759.https://doi.org/10.1016/S0006-3495(92)81649-1PMID:1384741