HAL Id: hal-01456234
https://hal.archives-ouvertes.fr/hal-01456234
Submitted on 4 Feb 2017HAL is a multi-disciplinary open access archive for the deposit and dissemination of sci-entific research documents, whether they are pub-lished or not. The documents may come from teaching and research institutions in France or abroad, or from public or private research centers.
L’archive ouverte pluridisciplinaire HAL, est destinée au dépôt et à la diffusion de documents scientifiques de niveau recherche, publiés ou non, émanant des établissements d’enseignement et de recherche français ou étrangers, des laboratoires publics ou privés.
Optic Radiations Microstructural Changes in Glaucoma
and Association With Severity: A Study Using
3Tesla-Magnetic Resonance Diffusion Tensor Imaging
Laury Tellouck, Muriel Durieux, Pierrick Coupé, Audrey Cougnard-Grégoire,
Joy Tellouck, Thomas Tourdias, Fanny Munsch, Arnaud Garrigues, Catherine
Helmer, Florence Malet, et al.
To cite this version:
Laury Tellouck, Muriel Durieux, Pierrick Coupé, Audrey Cougnard-Grégoire, Joy Tellouck, et al.. Optic Radiations Microstructural Changes in Glaucoma and Association With Severity: A Study Using 3Tesla-Magnetic Resonance Diffusion Tensor Imaging. Investigative Ophthalmology & Visual Science, Association for Research in Vision and Ophthalmology, 2016, 57, pp.6539 - 6539. �10.1167/iovs.16-19838�. �hal-01456234�
OPTIC RADIATIONS MICROSTRUCTURAL CHANGES IN
1GLAUCOMA AND ASSOCIATION WITH SEVERITY: A STUDY USING
23TESLA-MAGNETIC RESONANCE DIFFUSION TENSOR IMAGING
34 5 6
Laury Tellouck1,2,3, Muriel Durieux 4, Pierrick Coupé 5,6, Audrey Cougnard-Grégoire2,3, 7
Joy Tellouck1, Thomas Tourdias 2,4,7, Fanny Munsch 4; Arnaud Garrigues 1, Catherine 8
Helmer 2,3, Florence Malet8, Jean-François Dartigues 2,3, Vincent Dousset 2,4,7, Cécile 9
Delcourt2,3, Cédric Schweitzer1,2,3 10
11 12 13
1: CHU de Bordeaux, Service d’Ophtalmologie, F-33000 Bordeaux, France. 14
2: Univ. Bordeaux, F-33000 Bordeaux, France. 15
3: INSERM, U1219 - Bordeaux Population Health Research Center, F-33000 16
Bordeaux, France. 17
4: CHU de Bordeaux, Service de Neuro-Imagerie, F-33000 Bordeaux, France. 18
5: Université de Bordeaux, LaBRI, UMR 5800, PICTURA, F-33400 Talence, France. 19
6: CNRS, LaBRI, UMR 5800, PICTURA, F-33400 Talence, France. 20
7 : INSERM U1215, Neurocentre Magendie, F-33000 Bordeaux, France. 21
8: Centre d’Ophtalmologie Point Vision, F-33000 Bordeaux, France. 22
23 24 25
Corresponding author/reprint request: Cécile Delcourt, Inserm U1219, ISPED, 146 26
rue Léo Saignat, 33076 Bordeaux Cedex. Tel: + 33 557 57 11 91. Email: 27 [email protected] 28 29 Word count: 4089 30
Financial support: This study received financial support from UNADEV (Bordeaux, 31
France). UNADEV did not participate in the design of the study, the collection, 32
management, statistical analysis and interpretation of the data, nor in the 33
preparation, review or approval of the present manuscript. 34
35 36 37
ABSTRACT 38
39
Purpose: 40
To compare microstructural changes along the optical radiations and brain structure 41
volumes between glaucoma and control subjects using in vivo magnetic resonance 42
imaging and to analyze their association with severity of the disease. 43
44
Methods: 50 open-angle glaucoma subjects and 50 healthy age- and sex-matched 45
controls underwent detailed ophthalmological examinations (including visual field 46
testing (VF), funduscopy and Spectral-Domain Optical Coherence Tomography) as 47
well as Diffusion tensor imaging (DTI) using a 3.0-Tesla MRI. Fractional anisotropy 48
(FA), Mean Diffusivity, Radial Diffusivity (RD) and Axial Diffusivity (AD) were 49
quantified semi-automatically along the optical radiations. DTI parameters and 50
volumes of specific brain structures were compared between cases and controls 51
using conditional logistic regression. Association between DTI metrics and the 52
severity of the disease was studied using linear mixed regression analyses. 53
Results: In glaucoma subjects, optic radiations FA was significantly lower (0.57 vs 54
0.59; p= 0.02) and RD was significantly higher (52.78 10-5 mm2/s vs 49.74 10-5 55
mm2/s; p= 0.03) than in controls. Optic radiations FA was significantly correlated with 56
homolateral functional and structural damage of glaucoma (mean deviation of VF 57
(p=0.03), retinal nerve fiber layer thickness (p=0.03), vertical cup/disc ratio 58
(p=0.0007)). Volume and DTI parameters of other brain structures (including 59
hippocampus) were not significantly different between glaucoma and controls. 60
Conclusion: We evidenced microstructural modifications along visual pathways of 61
glaucoma patients and these alterations were correlated with disease severity. The 62
association of glaucoma with other neurodegenerative alterations would need further 63
exploration and a prospective follow-up of our cohort of subjects. 64
65
Keywords: glaucoma, fractional anisotropy, 3T MRI, optic radiations, DTI 66
68
INTRODUCTION 69
70 71
Glaucoma affects 64 million people and is the first cause of irreversible blindness, 72
worldwide1,2. It encompasses a group of disorders characterized by progressive 73
degeneration of the optic nerve head, loss of retinal ganglion cells and a 74
corresponding pattern of visual field loss3. Primary open-angle glaucoma (POAG) is 75
the predominant form of glaucoma in Western countries. Although some risk factors 76
for POAG have been identified (high intraocular pressure, age, high myopia, ethnicity 77
and heredity), several aspects of its pathophysiology remain unclear. As the disease 78
could also affect intra-cerebral visual pathways in addition to optic nerve head 79
degeneration, a neurodegenerative hypothesis raises concerns4,5 80
Central visual pathway degeneration in glaucoma was first suggested in experimental 81
and histological studies, which have evidenced that glaucoma is not strictly limited to 82
the optic nerve6,7. In an animal model of ocular hypertension, brain changes were 83
observed in the lateral geniculate nucleus and superior colliculus, in parallel with 84
retinal ganglion cells loss8. In another study, grey matter of glaucoma patients was 85
reduced compared to healthy subjects, in the approximate retinal lesion projection 86
zones in the visual cortex9. Moreover, a clinicopathological case in humans 87
highlighted a neural degeneration in intracranial optic nerve, lateral geniculate 88
nucleus and visual cortex10. This paradigmatic shift is further supported by several 89
other small-sized clinical studies using brain magnetic resonance imaging, showing 90
reduced volume of all the visual pathways (optic tracts, optic chiasm, lateral 91
geniculate nucleus, optic radiations) measured at 1.5T11–13 or 3T field strength14,15. 92
Some other experimental studies may help understand the pathogenesis of the 93
disease. Using in vivo MRI studies is a way to study metabolic and spatiotemporal 94
changes in glaucoma16–18. 95
In addition, epidemiological studies have also suggested that glaucoma might be 96
associated with other neurodegenerative disorders, in particular Alzheimer’s 97
disease19,20, and a few studies have found a reduced volume of brain structures, 98
beyond the visual pathways − particularly in the hippocampus − which is well known 99
to be affected in Alzheimer’s disease14,21,22. These data have nevertheless been 100
collected in patients with long standing disease. Whether subtle alterations 101
suggestive of associated neurodegenerative disease can be captured from the early 102
stage of glaucoma, prior to atrophy, is unknown. 103
Recent improvements in neuroimaging techniques allow more accurate evaluation of 104
brain structure volumes and intra-cerebral microstructural damage. By quantifying 105
microscopic movements of water molecules, Diffusion Tensor Imaging (DTI) − a 106
functional MRI technique − provides a sensitive evaluation of underlying brain 107
microstructural changes even prior to atrophy23. Therefore, this technique appears 108
particularly promising in the documentation of intra-cerebral damage in glaucoma. 109
The most commonly assessed DTI parameters include fractional anisotropy (FA, 110
which reflects the degree of cellular structural alignment within fiber tracts and the 111
structural integrity of the fiber tracts) and mean diffusivity (MD, which measures the 112
average motion of water molecules independently of fiber directionality). 113
114
Several case-control studies have already shown that FA of the optic radiations is 115
decreased and MD increased in glaucoma patients24,25, and some others have 116
suggested that these changes may be progressive with increasing axon loss of the 117
optic nerve26. Whereas these studies provide new insights in the understanding of 118
glaucoma disease, they were limited in sample size and mainly included advanced 119
glaucoma patients. 120
121
Therefore, our study aimed at exploring the potential neurodegenerative hypothesis 122
associated with glaucoma and whether subtle changes could be measurable at the 123
early stage of the disease. Thus we analyzed both the microstructural changes of the 124
visual pathway, in relation with glaucoma severity, as well as changes beyond the 125
visual pathway, in particular in regions affected in neurodegenerative pathologies. 126 127 128 METHODS 129 130 Patient Population 131
This study is an observational case-control study performed at the University Hospital 132
of Bordeaux. Fifty patients with POAG (20 men, 30 women, mean age 61.9 +/- 6.9 133
years) and 50 age- and sex-matched controls (20 men, 30 women, mean age 61.9 +/- 134
7.0 years) were prospectively included. 135
This research followed the tenets of the Declaration of Helsinki. Participants gave 136
written consent for the participation in the study. The design of this study was 137
approved by the Ethical Committee of Bordeaux (Comité de Protection des Personnes 138
Sud-Ouest et Outre-Mer III) in March 2012. This study was registered on the website 139 http://clinicaltrials.gov/ (identifier NCT01621841). 140 141 Ophthalmological Examination 142
All participants underwent a complete ophthalmic examination including measurement 143
of best-corrected visual acuity, intraocular pressure (IOP) using Goldmann aplanation 144
tonometry, gonioscopy, slit-lamp biomicroscopy and optic disc examination by 145
funduscopy. Central corneal thickness and anterior chamber depth were assessed 146
using interferometry (OCT Visante, Carl Zeiss Meditec, Inc., Dublin, CA, USA), and 147
axial length measurement using IOL Master (Carl Zeiss Meditec, Inc., Dublin, CA, 148
USA). All participants underwent a visual field testing (Octopus 101, Haag-Streit, Inc., 149
Bern, Switzerland) and only reliable tests (false-positive errors <15%, false negative-150
errors <15%, loss fixations <20%) were included. In addition, visual fields (VF) were 151
reviewed and excluded in the presence of artefacts, such as eyelid or rim artifacts, 152
fatigue effects, inattention, or inappropriate fixation. 153
A measurement of peripapillary Retinal Nerve Fiber Layer (RNFL) thickness was 154
performed using Spectral-Domain optical coherence tomography (SD-OCT) (Cirrus, 155
Carl Zeiss Meditec, Inc., Dublin, CA, USA). All images were acquired and reviewed by 156
specially trained technicians of the study to control the quality of signal strength and 157
accurate centration and segmentation of the RNFL circle scan acquisition. Signal 158
strength lower than 6 or acquisitions with artifacts were excluded from the analysis. 159
Glaucoma subjects and controls received a questionnaire requesting for 160
cardiovascular risk factors, familial history of glaucoma, ophthalmological diseases 161
and current medications. Each participant underwent Mini Mental State Examination 162
(MMSE)27. 163
164
Primary open-angle glaucoma was defined by the following criteria: the presence of 165
glaucomatous optic neuropathy (defined as a loss of neuroretinal rim with a vertical 166
cup-to-disc ratio [VCDR] of >0.7 or an intereye asymmetry of >0.2, with or without 167
notching attributable to glaucoma) associated to compatible VF loss. This VF loss was 168
defined as the presence of at least 3 contiguous non edge test points within the same 169
hemifield on the pattern deviation probability plot at P < 0.05, with at least 1 point P < 170
0.01, excluding points directly above and below the blind spot, and the presence of 171
glaucomatous hemifield test results outside normal limits. Iridocorneal angle opening 172
was graded 3 or 4 on gonioscopy using Schaeffer classification. 173
Controls were defined as normal optic disc without notching or abnormal thinning of 174
the neuroretinal rim, no visual field defects, IOP measurement < 21 mmHg and no 175
family history of glaucoma. 176
Exclusion criteria included any diseases that could affect the visual field, secondary 177
glaucoma including exfoliative and pigmentary glaucoma, diabetes mellitus, any 178
neurological or psychiatric disorders, and a score <26 on the MMSE for global 179
cognition. We also excluded participants according to standard MRI exclusion criteria 180
such as claustrophobia, ferromagnetic implants or pacemakers, and inability to lie still 181
for the MRI acquisition time. 182
Stage of severity of glaucoma was classified according to the Hodapp-Parrish-183
Anderson classification28. The different stages are: 184
• Stage 0: no or minimal defect 185
• Stage 1: MD ≥ -6.0 dB (early defect) 186
• Stage 2: -12.0 ≥ MD ≥ -6.0 dB (moderate defect) 187
• Stage 3: -20 ≥ MD ≥ -12.0 dB (advanced defect) 188
• Stage 4: MD ≥ - 20.0 dB (severe defect) 189
• Stage 5: End-stage disease 190
191 192
MRI Data Acquisition 193
MRI examinations were performed on a 3-T Discovery MR750w scanner (GE Medical 194
Systems, Milwaukee, WI, USA) using a 32-channel phased array head coil within 30 195
days following the ophthalmologic examinations. The protocol included a DTI 196
sequence to look for microstructural alterations along and beyond the optic radiations, 197
a 3D-T1-wi sequence to look for global or focal atrophy. The parameters of 198
acquisitions were as follows. The DTI sequence consisted in dual echo-planar 199
imaging: 40 axial slices; repetition time, 12000 ms; echo time, 100.9 ms; slice 200
thickness, 3.5 mm; matrix, 160x160; field of view, 24 cmx24 cm; b values, 0 and 1000 201
s/mm² applied in 32 non-collinear directions. The 3D-T1 was an inversion recovery 202
gradient echo sequence: 288 slices; repetition time, 11.4 ms; echo time, 4.3 ms; 203
inversion time, 400 ms; flip angle, 15°; slice thickness, 0.8 mm; matrix, 384x384; field 204 of view, 25 cmx25 cm. 205 206 Image Processing 207
Measurement of DTI metrics along the optic radiations 208
From the DTI data, the distortions induced by eddy currents were first corrected, then 209
a diffusion tensor model was fitted at each voxel using Olea Medical® software to 210
generate fractional anisotropy (FA) maps and to investigate the microstructural 211
integrity of the optic radiations. The optic radiations were identified using deterministic 212
tractography between two seed-regions of interest (ROIs) over the proximal and distal 213
optic radiations according to previously published method and landmarks29. The 214
proximal ROI was placed near the lateral geniculate nuclei, while the distal ROI was 215
placed just anterior to its termination in the visual cortex. Fiber tract propagation was 216
terminated for FA<0.2 and angle<35° based on agreed-upon thresholds. ROIs were 217
placed by a specialized neuroradiologist symetrically, based on color-coded FA maps 218
and trace DTI images on the anterior and posterior part of the expected pathway of the 219
optic radiations (green boxes on Figure 1). Fibers whose directions did not correspond 220
to the optic radiations based on anatomic knowledge and DTI-derived atlas were 221
excluded by adding additional ROIs and a logical “not” function30 (red boxes on Figure 222
1). Only fibers that connected the anterior and posterior regions of interest were 223
selected for further analysis. The analysis was independently repeated for a subset of 224
cases (n=25 out of the 100 cases) by a specialized ophthalmologist with an inter-225
reader agreement of 0.88. 226
The median FA and its sub-component (axial and radial diffusivity, AD and RD 227
respectively) as well as the mean diffusivity were measured along the reconstructed 228
optic radiations (green streamlines on Figure 1). Decreased FA and increased MD 229
values is usually considered as a proxy of axonal disruption31. 230
None of the people participating in FA measurements had any access to the 231
case/control status of the participants, nor to any other clinical data. 232
233
MRI volumetric measurements 234
For volumetric analyses, T1-weighted images were processed using the volBrain 235
system (http://volbrain.upv.es). After denoising32, images were affine-registered33 into 236
the Montreal Neurological Institute space and the total brain volume was estimated 237
using the Nonlocal Intracranial Cavity Extraction method34. Hippocampus was 238
segmented using patch-based multi-template approach35 following the international 239
consortium from the EADC-ADNI Harmonized Protocol for anatomical definitions of the 240
hippocampus36. To control variations in head size between subjects, total brain 241
volumes and hippocampal volumes were scaled using the volumetric scaling factor 242
determined through the affine registration to the MNI brain template. 243
244
For DTI analysis within the hippocampus masks, an in-house pipeline (dtiBrain) was 245
used to process diffusion-weighted images. First, diffusion-weighted images were 246
affine-registered to the T1w MRI in the MNI space32. Then, to compensate for EPI 247
distortion, a non-rigid registration was performed. Finally, a diffusion tensor model was 248
fitted at each voxel using FSL 5.031 (fmrib.ox.ac.uk/fsl), generating FA and MD maps. 249
Mean FA and MD were measured within the hippocampal masks previously generated 250
on anatomical T1-weighted MRI. 251
252
Statistical analysis 253
Statistical analysis was performed using SAS 9.3 (SAS Institute Inc, Cary, NC). 254
Differences of MRI characteristics between glaucoma subjects and healthy controls 255
were tested using logistic conditional analyses, for parameters both along optic 256
radiations and outside the visual pathway (globally for white and grey matter and in 257
hippocampal and amygdala structures). Additionally, within the group of patients with 258
glaucoma, we used mixed linear regression analyses, adjusted for sex and age (as a 259
continuous variable expressed in years), to test the associations between optic 260
radiation DTI parameters (FA, MD, AD, RD) and the parameters of severity of the 261
disease (VCDR, mean deviation of VF and RNFL). This type of analysis allows taking 262
into account both right and left sides of each patient, while taking into account the 263
intra-individual correlation between sides. In particular, this allowed studying the 264
associations of ocular parameters with homolateral (right optic radiation with right eye 265
and left with left eye) and contralateral (right optic radiation with left eye and vice 266
versa) optic radiations MRI parameters. In these regression analyses, both ocular and 267
brain parameters were entered as z-scores. In addition, for RNFL, we also adjusted for 268
axial length, which is strongly associated with RNFL37. 269
270
RESULTS 271
Demographic and ophthalmological characteristics 272
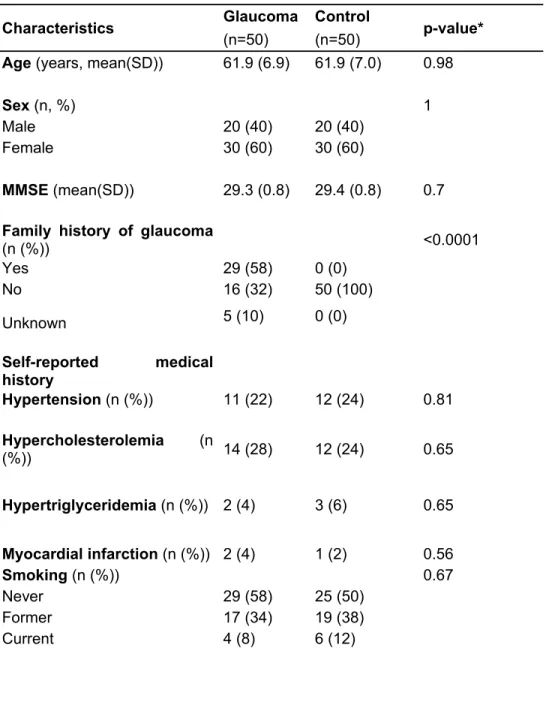
As shown in Table 1, cases and controls were similar for age, gender, history of 273
cardiovascular diseases or risk factors and MMSE. Family history of glaucoma was 274
reported by 58 % of glaucoma patients, and 0 % of controls (since this was an 275
exclusion criterion for controls). 276
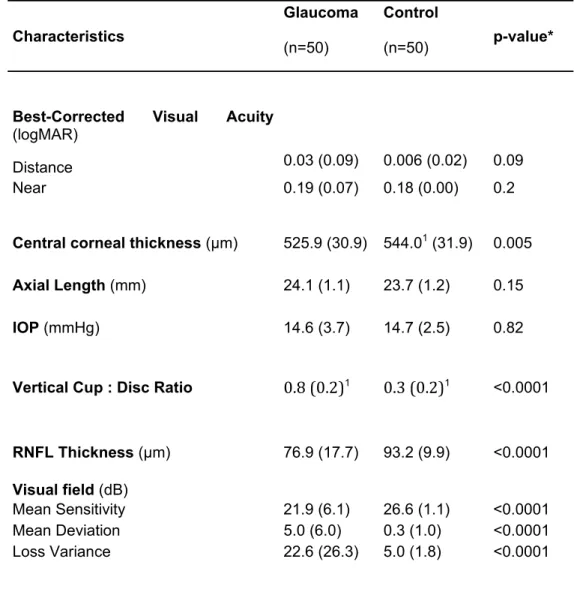
As shown in Table 2, cases and controls did not significantly differ for visual acuity 277
(distance and near), intraocular pressure and axial length. As expected, they were 278
significantly different for central corneal thickness, VCDR, RNFL thickness and visual 279
field parameters. Similar results were observed for the left eye (Table 3). 280
In our study, 70% of glaucoma patients had an early stage of the disease, 20% a 281
moderate stage and 10% an advanced or severe stage, according to the Hodapp-282
Parrish-Anderson classification. 283
284
Comparison of MRI parameters along optic radiations between glaucoma and 285
control subjects 286
One patient refused to do MRI examination and 3 MRI examinations were insufficient 287
quality for analysis, leaving 49 glaucoma patients and 47 controls for the comparison 288
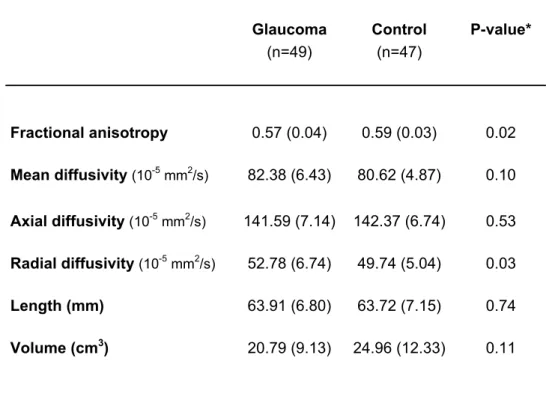
of MRI parameters (Table 4). The optic radiations were similarly reconstructed for 289
glaucoma and control subjects (similar length and volume and reconstructed 290
streamlines). Glaucoma patients showed significantly lower FA along the optic 291
radiations than controls (0.57 vs 0.59, p=0.02), which was driven by significant 292
increase in radial diffusivity (52.8 10-5 mm2/s vs 49.7 10-5 mm2/s, p=0.03) while axial 293
diffusivity was unchanged. Mean diffusivity tended to be slightly higher in glaucoma 294
patients, but this did not reach statistical significance (82.4 10-5 mm2/s vs 80.6 10-5 295
mm2/s p=0.10). 296
297 298
Associations of homo- and contralateral optic radiation parameters with the 299
severity of the disease in glaucoma patients 300
Table 5 shows the associations of optic radiation parameters (FA, MD, RD and AD) 301
with the ophthalmological parameters of glaucoma severity evaluated by visual field, 302
optic disc cupping and RNFL thickness, only among patients with glaucoma (n=50). 303
We tested associations of ophthalmological parameters with MRI parameters on the 304
homolateral (right eye – right optic radiation and left eye – left optic radiation) and 305
contralateral (right-left and left-right) sides. For the homolateral side, significant 306
associations were found between optic radiations FA and mean deviation of the visual 307
field (β= -0.22; p= 0.03), VCDR (β= -0.42; p= 0.0003) and RNFL (β= 0.22; p= 0.03). 308
The direction of the association is opposite for RNFL, since RNFL decreases with 309
higher severity of glaucoma, while other parameters increase with severity. Mean and 310
radial diffusivities increased with the severity of the disease measured by VCDR, 311
(p<0.006 and p<0.0008, respectively), but were not significantly associated with mean 312
deviation of VF or RNFL thickness. By contrast, axial diffusivity, as well as length and 313
volume of optic radiations were not significantly associated with any of the severity 314
parameters. 315
With regard to the contralateral side, associations of MRI parameters with glaucoma 316
severity parameters were much weaker, and reached statistical significance only for 317
the association of FA and RD with VCDR (p=0.01 and p=0.02, respectively). 318
319
Brain volumes analyses between cases and controls 320
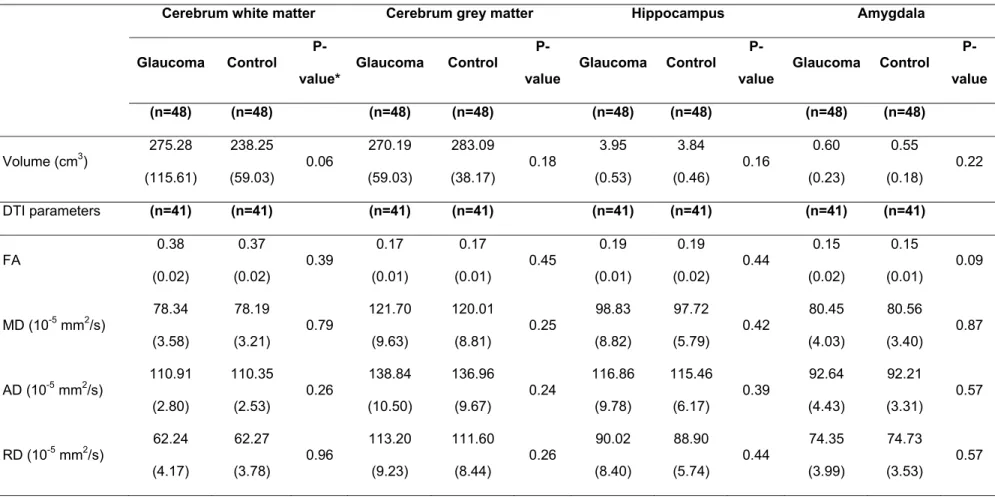
Finally, we did not evidence any statistically significant difference between glaucoma 321
subjects and controls for volumes and DTI parameters of cerebrum white and grey 322
matters, hippocampus and amygdala (Table 6). 323
324 325
DISCUSSION 326
Our study demonstrates microstructural changes of the optic radiations in glaucoma, 327
as evaluated by lower FA driven by higher RD, and a correlation between the level of 328
structural modifications and disease severity. 329
Using MRI at 1.5T38 or 3T25,26,39 a few case-control studies have also reported such 330
modifications of diffusion parameters in optic radiations of glaucoma patients. All these 331
studies found significantly lower FA in glaucoma patients compared with control 332
patients. In the present study, which included 70 % of early stages of glaucoma, FA 333
differences between cases and controls are numerically small (about 0.02 for a mean 334
of about 0.60, i.e about 3.3 %). However, the standard deviation is also small (about 335
0.04), showing low inter-individual variability in this parameter, and the difference is 336
substantial when related to the standard deviation (about 0.5 SD), suggesting a major 337
effect of glaucoma on this highly conserved parameter. In other studies, the 338
differences in FA of optic radiations observed between glaucoma patients and controls 339
were larger, but these studies generally included more severe cases. The study by 340
Engelhorn et al included 22 severe glaucoma cases, and observed a difference in FA 341
of optic radiations ranging from 17 % to 30 % according to the localization (anterior, 342
central, posterior)39. The study by Murai et al included 18 severe glaucoma cases, 9 343
moderate and only 2 mild, and observed a 14 % difference in FA of the optic 344
radiations38. The study by Garaci et al included 4 pre-perimetric glaucoma cases, 4 345
early, 4 moderate and 4 severe cases and observed a 36 % differences in FA of the 346
optic radiations25. Finally, the study by Chen et al included a majority of severe cases 347
(36 eyes with MD>9.5 dB out of 50) but did not report numerically the averages of 348
optic radiations FA26. 349
Furthermore, we observed higher RD value in glaucoma patients and its correlation 350
with disease severity whereas AD was not significantly different between glaucoma 351
and control patients. Although, AD and RD are the two components of FA, these 352
parameters have been scarcely analyzed in the literature and some studies have 353
already reported increasing RD in glaucoma subjects compared to controls24. 354
Even though the underlying pathological alterations are not specifically known, animal 355
studies have suggested that higher RD could mainly represent myelin loss while lower 356
AD could be a more specific marker of neuronal loss. However these considerations 357
were based on simplistic models and whether alterations of optic radiations truly 358
predominate on myelin or axon component cannot be formally ascertained for 359
glaucoma patients, for whom other modifications such as microglia activation may 360
confound the data. 361
Additionally, we observed a trend towards higher mean diffusivity value in the 362
glaucoma group without reaching statistical significance. However, we observed a 363
significant positive correlation between mean diffusivity and disease severity 364
measured with VCDR. Two studies also showed higher mean diffusivity in glaucoma 365
patients25,26. While FA measures the degree of cellular structural alignment within fiber 366
tracts and their structural integrity, mean diffusivity measures the average motion of 367
water molecules independently of fiber directionality and is considered as an additional 368
marker of axonal disruption. As these studies included patients with advanced 369
glaucoma, our findings might be explained by a lack of statistical power and a lower 370
grade of disease severity in our glaucoma group. Such converging evidence of loss of 371
fiber integrity in optic radiations in glaucoma cannot be measured in terms of length 372
and volume of the optic radiations, which were similar in both groups probably 373
because our measurements were made prior to fiber loss or major disorganization. 374
375
We also observed an association of diffusivity parameters (mainly FA and RD), with 376
the severity of glaucoma (assessed by mean deviation of the visual field, VCDR and 377
RNFL measured with SD-OCT), suggesting that microstructural changes to the optic 378
radiations is one of the components of the severity that could participate in the 379
clinical status of the patients and the alteration of the visual field. Although we mainly 380
included early and moderate glaucoma as defined by the Hodapp-Parrish-Anderson 381
classification, our findings are consistent with some previous studies, which included 382
more advanced cases26,38–40. All these studies also evidenced significant 383
associations of optic radiations FA with structural parameters of optic nerve head 384
degeneration evaluated with VCDR or time-domain RNFL thickness, as well as 385
functional visual field alterations. For example, Michelson et al. found a correlation 386
between FA and visual field40. Thus, all these results illustrate the fact that FA could 387
be a strong biomarker of glaucoma severity. 388
Our study also assessed the associations of glaucoma severity according to FA of 389
homolateral and contralateral optic radiations. Interestingly, glaucoma severity 390
parameters − in particular VCDR − were more strongly associated with homolateral 391
optic radiations diffusion parameters than with contralateral parameters. As chiasmatic 392
decussation of optic pathways results in approximately 50% crossing of axons on the 393
contralateral side41, we would expect similar associations of glaucoma severity 394
parameters with homolateral and contralateral diffusion parameters. However, our 395
findings might also be related to an increased vulnerability of some specific retinal 396
nerve fiber bundles of the optic nerve head resulting in an atrophy of optic radiations 397
more predominant on the homolateral side of the decussation than on the 398
controlateral. Indeed, several studies have demonstrated a specific vulnerability of the 399
temporal and temporal-inferior sides of the optic nerve head to glaucoma damage42–44. 400
Thus, we could expect an increased atrophy of the corresponding optic radiation 401
predominant on the homolateral side that could explain our findings. However, even if 402
temporal and temporal-inferior nerve fiber layers are more vulnerable to glaucomatous 403
damage, the meaning of our findings should be interpreted with caution and would 404
need further exploration to be confirmed and to identify the exact underlying 405
mechanism. Indeed, distribution of RNFL is not homogeneous around the optic nerve 406
head with superior and inferior sectorial RNFL thicker than nasal or temporal RNFL 407
sectors. Furthermore the mean optic disc-fovea angle deliminating superior and 408
inferior nerve fiber layers, is around 8°45. Thus the exact distribution of nerve fiber 409
layers of the retina that decussates to the contralateral optic tract or remains on the 410
ipsilateral optic tract and finally leads to a vertical delimitation through the fovea on the 411
hemivisual field test remains unclear. Hence, in our study, the corresponding optic 412
radiations in the homo or contralateral side could not be accurately matched to specific 413
sectors of the retina or the optic nerve head. 414
Although high intraocular pressure is the main risk factor of glaucoma, this disease is 415
increasingly considered as a neuro-ophthalmological and neurodegenerative 416
disease46. Furthermore, there are still controversies on the association between 417
glaucoma and some other neurodegenerative diseases as Alzheimer’s disease. In 418
particular, in a cohort of elderly subjects followed every 2 years, we observed an 419
association of POAG with incident dementia19. Volume changes beyond the visual 420
system in glaucoma patients have also been reported in several studies but with 421
inconsistent results. For instance, Frezzotti et al. reported that POAG patients had 422
brain atrophy in some grey matter regions and the visual cortex21. By contrast, 423
Williams et al. found five cerebral structures larger in the glaucoma group than in the 424
control group22. Chen et al. revealed both a decreasing grey matter volume in some 425
regions and an increasing grey matter volume in some others14. In the present study, 426
we analyzed brain globally and focused on brain regions that are well known to be 427
affected in the course of Alzheimer’s disease − particularly hippocampus − and did not 428
evidence any significant difference for any of the studied regions of interest, neither in 429
volume nor in parameters of diffusivity. However, as we included subjects with MMSE 430
≥26 at baseline, the risk of brain structures atrophy was probably limited. Regarding 431
the hippocampus, results have been particularly inconsistent, since Frezzotti et al. 432
reported decreased hippocampus volume in glaucoma patients21, while Williams et al. 433
reported no significant difference of hippocampus volume between glaucoma and 434
controls, but an increase in hippocampus volume with disease severity in patients with 435
glaucoma22. 436
Such differences between study results may be explained by differences in study 437
methodology, in particular regarding the selection of subjects and severity of the 438
disease, MRI sequences used or definition of regions of interest. For instance, in a 439
recent study by Frezzotti et al, only severe cases of glaucoma (but not early) showed 440
grey matter atrophy of the visual cortex and hippocampus47. The evolution of brain 441
volume in the course of glaucoma and its association with other neurodegenerative 442
diseases would need further investigation and prospective follow-up of subjects. 443
Finally, functional MRI may offer new insights into the brain modifications associated 444
with glaucoma, as suggested by two recent studies, showing functional modifications 445
of the visual cortex at the earliest stages of the disease47,48. 446
447 448
In conclusion, we confirmed microstructural changes of optic radiations in glaucoma 449
and its association with glaucoma severity. In accordance with several other studies, 450
DTI appears as an objective measurement for evaluating alterations of the visual 451
pathways in glaucoma and provides new insight in the pathophysiological process of 452
glaucoma. A prospective evaluation of our cohort of patients would be of interest to 453
observe the evolution of these microstructural modifications of optic radiations and to 454
analyze the evolution of brain volume in association with the evolution of glaucoma 455
disease. DTI could represent a future way to explore central nervous system of 456
glaucomatous subjects, leading to a better understanding of the pathophysiology and, 457
potentially, to help clinical trials evaluate new therapeutic strategies based on 458
neuroprotection or brain repair. 459 460 461 REFERENCES 462 463
1. Resnikoff S, Pascolini D, Etya’ale D, et al. Global data on visual impairment in 464
the year 2002. Bull World Health Organ. 2004;82(11):844-851. doi:/S0042-465
96862004001100009. 466
2. Tham Y-C, Li X, Wong TY, Quigley HA, Aung T, Cheng C-Y. Global 467
prevalence of glaucoma and projections of glaucoma burden through 2040: a 468
systematic review and meta-analysis. Ophthalmology. 2014;121(11):2081-2090. 469
doi:10.1016/j.ophtha.2014.05.013. 470
3. Weinreb RN, Khaw PT. Primary open-angle glaucoma. Lancet. 471
2004;363(9422):1711-1720. doi:10.1016/S0140-6736(04)16257-0. 472
4. O’Hare F, Rance G, McKendrick AM, Crowston JG. Is primary open-angle 473
glaucoma part of a generalized sensory neurodegeneration? A review of the 474
evidence. Clin Experiment Ophthalmol. 2012;40(9):895-905. doi:10.1111/j.1442-475
9071.2012.02812.x. 476
5. Gupta N, Yücel YH. Glaucoma as a neurodegenerative disease. Curr Opin 477
Ophthalmol. 2007;18(2):110-114. doi:10.1097/ICU.0b013e3280895aea.
478
6. Yucel YH, Gupta N. A framework to explore the visual brain in glaucoma with 479
lessons from models and man. Exp Eye Res. 2015;141:171-178. 480
doi:10.1016/j.exer.2015.07.004. 481
7. Yücel Y. Central nervous system changes in glaucoma. J Glaucoma. 2013;22 482
Suppl 5:S24-25. doi:10.1097/IJG.0b013e3182934a55. 483
8. Zhang S, Wang H, Lu Q, et al. Detection of early neuron degeneration and 484
accompanying glial responses in the visual pathway in a rat model of acute 485
intraocular hypertension. Brain Res. 2009;1303:131-143. 486
doi:10.1016/j.brainres.2009.09.029. 487
9. Boucard CC, Hernowo AT, Maguire RP, et al. Changes in cortical grey matter 488
density associated with long-standing retinal visual field defects. Brain J Neurol. 489
2009;132(Pt 7):1898-1906. doi:10.1093/brain/awp119. 490
10. Gupta N, Ang L-C, Noël de Tilly L, Bidaisee L, Yücel YH. Human glaucoma 491
and neural degeneration in intracranial optic nerve, lateral geniculate nucleus, and 492
visual cortex. Br J Ophthalmol. 2006;90(6):674-678. doi:10.1136/bjo.2005.086769. 493
11. Gupta N, Greenberg G, de Tilly LN, Gray B, Polemidiotis M, Yücel YH. 494
Atrophy of the lateral geniculate nucleus in human glaucoma detected by magnetic 495
resonance imaging. Br J Ophthalmol. 2009;93(1):56-60. 496
doi:10.1136/bjo.2008.138172. 497
12. Zhang YQ, Li J, Xu L, et al. Anterior visual pathway assessment by magnetic 498
resonance imaging in normal-pressure glaucoma. Acta Ophthalmol (Copenh). 499
2012;90(4):e295-302. doi:10.1111/j.1755-3768.2011.02346.x. 500
13. Zikou AK, Kitsos G, Tzarouchi LC, Astrakas L, Alexiou GA, Argyropoulou MI. 501
Voxel-based morphometry and diffusion tensor imaging of the optic pathway in 502
primary open-angle glaucoma: a preliminary study. AJNR Am J Neuroradiol. 503
2012;33(1):128-134. doi:10.3174/ajnr.A2714. 504
14. Chen WW, Wang N, Cai S, et al. Structural Brain Abnormalities in Patients 505
with Primary Open-Angle Glaucoma: A Study with 3T MR Imaging. Investig 506
Opthalmology Vis Sci. 2013;54(1):545. doi:10.1167/iovs.12-9893.
507
15. Dai H, Mu KT, Qi JP, et al. Assessment of lateral geniculate nucleus atrophy 508
with 3T MR imaging and correlation with clinical stage of glaucoma. AJNR Am J 509
Neuroradiol. 2011;32(7):1347-1353. doi:10.3174/ajnr.A2486.
510
16. Chan KC, Fu Q, Hui ES, So K, Wu EX. Evaluation of the retina and optic nerve 511
in a rat model of chronic glaucoma using in vivo manganese-enhanced magnetic 512
resonance imaging. NeuroImage. 2008;40(3):1166-1174. 513
doi:10.1016/j.neuroimage.2008.01.002. 514
17. Chan KC, So K, Wu EX. Proton magnetic resonance spectroscopy revealed 515
choline reduction in the visual cortex in an experimental model of chronic glaucoma. 516
Exp Eye Res. 2009;88(1):65-70. doi:10.1016/j.exer.2008.10.002.
517
18. Ho LC, Wang B, Conner IP, et al. In Vivo Evaluation of White Matter Integrity 518
and Anterograde Transport in Visual System After Excitotoxic Retinal Injury With 519
Multimodal MRI and OCT. Invest Ophthalmol Vis Sci. 2015;56(6):3788-3800. 520
doi:10.1167/iovs.14-15552. 521
19. Helmer C, Malet F, Rougier M-B, et al. Is there a link between open-angle 522
glaucoma and dementia?: The Three-City-Alienor Cohort. Ann Neurol. May 2013. 523
doi:10.1002/ana.23926. 524
20. Lin I-C, Wang Y-H, Wang T-J, et al. Glaucoma, Alzheimer’s disease, and 525
Parkinson’s disease: an 8-year population-based follow-up study. PloS One. 526
2014;9(9):e108938. doi:10.1371/journal.pone.0108938. 527
21. Frezzotti P, Giorgio A, Motolese I, et al. Structural and functional brain 528
changes beyond visual system in patients with advanced glaucoma. PloS One. 529
2014;9(8):e105931. doi:10.1371/journal.pone.0105931. 530
22. Williams AL, Lackey J, Wizov SS, et al. Evidence for widespread structural 531
brain changes in glaucoma: a preliminary voxel-based MRI study. Invest Ophthalmol 532
Vis Sci. 2013;54(8):5880-5887. doi:10.1167/iovs.13-11776.
533
23. Le Bihan D, Iima M. Diffusion Magnetic Resonance Imaging: What Water Tells 534
Us about Biological Tissues. PLoS Biol. 2015;13(7):e1002203. 535
doi:10.1371/journal.pbio.1002203. 536
24. El-Rafei A, Engelhorn T, Wärntges S, Dörfler A, Hornegger J, Michelson G. A 537
framework for voxel-based morphometric analysis of the optic radiation using 538
diffusion tensor imaging in glaucoma. Magn Reson Imaging. 2011;29(8):1076-1087. 539
doi:10.1016/j.mri.2011.02.034. 540
25. Garaci FG, Bolacchi F, Cerulli A, et al. Optic nerve and optic radiation 541
neurodegeneration in patients with glaucoma: in vivo analysis with 3-T diffusion-542
tensor MR imaging. Radiology. 2009;252(2):496-501. 543
doi:10.1148/radiol.2522081240. 544
26. Chen Z, Lin F, Wang J, et al. Diffusion tensor magnetic resonance imaging 545
reveals visual pathway damage that correlates with clinical severity in glaucoma. Clin 546
Experiment Ophthalmol. 2013;41(1):43-49. doi:10.1111/j.1442-9071.2012.02832.x.
547
27. Folstein MF, Folstein SE, McHugh PR. “Mini-mental state”. A practical method 548
for grading the cognitive state of patients for the clinician. J Psychiatr Res. 549
1975;12(3):189-198. 550
28. Maeda N, Klyce SD, Smolek MK, Thompson HW. Automated keratoconus 551
screening with corneal topography analysis. Invest Ophthalmol Vis Sci. 552
1994;35(6):2749-2757. 553
29. Reich DS, Smith SA, Gordon-Lipkin EM, et al. Damage to the optic radiation in 554
multiple sclerosis is associated with retinal injury and visual disability. Arch Neurol. 555
2009;66(8):998-1006. doi:10.1001/archneurol.2009.107. 556
30. Wakana S, Jiang H, Nagae-Poetscher LM, van Zijl PCM, Mori S. Fiber tract-557
based atlas of human white matter anatomy. Radiology. 2004;230(1):77-87. 558
doi:10.1148/radiol.2301021640. 559
31. Wheeler-Kingshott C a. M, Trip SA, Symms MR, Parker GJM, Barker GJ, 560
Miller DH. In vivo diffusion tensor imaging of the human optic nerve: pilot study in 561
normal controls. Magn Reson Med. 2006;56(2):446-451. doi:10.1002/mrm.20964. 562
32. Manjón JV, Coupé P, Martí-Bonmatí L, Collins DL, Robles M. Adaptive non-563
local means denoising of MR images with spatially varying noise levels. J Magn 564
Reson Imaging JMRI. 2010;31(1):192-203. doi:10.1002/jmri.22003.
565
33. Avants BB, Tustison NJ, Song G, Cook PA, Klein A, Gee JC. A reproducible 566
evaluation of ANTs similarity metric performance in brain image registration. 567
NeuroImage. 2011;54(3):2033-2044. doi:10.1016/j.neuroimage.2010.09.025.
568
34. Manjón JV, Eskildsen SF, Coupé P, Romero JE, Collins DL, Robles M. 569
Nonlocal intracranial cavity extraction. Int J Biomed Imaging. 2014;2014:820205. 570
doi:10.1155/2014/820205. 571
35. Coupé P, Manjón JV, Fonov V, Pruessner J, Robles M, Collins DL. Patch-572
based segmentation using expert priors: application to hippocampus and ventricle 573
segmentation. NeuroImage. 2011;54(2):940-954. 574
doi:10.1016/j.neuroimage.2010.09.018. 575
36. Frisoni GB, Jack CR, Bocchetta M, et al. The EADC-ADNI Harmonized 576
Protocol for manual hippocampal segmentation on magnetic resonance: evidence of 577
validity. Alzheimers Dement J Alzheimers Assoc. 2015;11(2):111-125. 578
doi:10.1016/j.jalz.2014.05.1756. 579
37. Sowmya V, Venkataramanan VR, Prasad V. Effect of Refractive Status and 580
Axial Length on Peripapillary Retinal Nerve Fibre Layer Thickness: An Analysis Using 581
3D OCT. J Clin Diagn Res JCDR. 2015;9(9):NC01-04. 582
doi:10.7860/JCDR/2015/14112.6480. 583
38. Murai H, Suzuki Y, Kiyosawa M, Tokumaru AM, Ishii K, Mochizuki M. Positive 584
correlation between the degree of visual field defect and optic radiation damage in 585
glaucoma patients. Jpn J Ophthalmol. February 2013. doi:10.1007/s10384-013-0233-586
0. 587
39. Engelhorn T, Michelson G, Waerntges S, et al. A new approach to assess 588
intracranial white matter abnormalities in glaucoma patients: changes of fractional 589
anisotropy detected by 3T diffusion tensor imaging. Acad Radiol. 2012;19(4):485-590
488. doi:10.1016/j.acra.2011.12.005. 591
40. Michelson G, Engelhorn T, Wärntges S, El Rafei A, Hornegger J, Doerfler A. 592
DTI parameters of axonal integrity and demyelination of the optic radiation correlate 593
with glaucoma indices. Graefes Arch Clin Exp Ophthalmol Albrecht Von Graefes 594
Arch Für Klin Exp Ophthalmol. 2013;251(1):243-253.
doi:10.1007/s00417-011-1887-595 2. 596
41. Pietrasanta M, Restani L, Caleo M. The Corpus Callosum and the Visual 597
Cortex: Plasticity Is a Game for Two. Neural Plast. 2012;2012:1-10. 598
doi:10.1155/2012/838672. 599
42. Strouthidis NG, Fortune B, Yang H, Sigal IA, Burgoyne CF. Longitudinal 600
change detected by spectral domain optical coherence tomography in the optic nerve 601
head and peripapillary retina in experimental glaucoma. Invest Ophthalmol Vis Sci. 602
2011;52(3):1206-1219. doi:10.1167/iovs.10-5599. 603
43. Tan O, Chopra V, Lu AT-H, et al. Detection of macular ganglion cell loss in 604
glaucoma by Fourier-domain optical coherence tomography. Ophthalmology. 605
2009;116(12):2305-2314.e1-2. doi:10.1016/j.ophtha.2009.05.025. 606
44. Yang Y, Zhang H, Yan Y, Gui Y, Zhu T. Comparison of optic nerve 607
morphology in eyes with glaucoma and eyes with non-arteritic anterior ischemic optic 608
neuropathy by Fourier domain optical coherence tomography. Exp Ther Med. 609
2013;6(1):268-274. doi:10.3892/etm.2013.1115. 610
45. Jonas RA, Wang YX, Yang H, et al. Optic Disc - Fovea Angle: The Beijing Eye 611
Study 2011. PloS One. 2015;10(11):e0141771. doi:10.1371/journal.pone.0141771. 612
46. Chang EE, Goldberg JL. Glaucoma 2.0: Neuroprotection, Neuroregeneration, 613
Neuroenhancement. Ophthalmology. 2012;119(5):979-986. 614
doi:10.1016/j.ophtha.2011.11.003. 615
47. Murphy MC, Conner IP, Teng CY, et al. Retinal Structures and Visual Cortex 616
Activity are Impaired Prior to Clinical Vision Loss in Glaucoma. Sci Rep. 617
2016;6:31464. doi:10.1038/srep31464. 618
48. Frezzotti P, Giorgio A, Toto F, De Leucio A, De Stefano N. Early changes of 619
brain connectivity in primary open angle glaucoma. Hum Brain Mapp. August 2016. 620
doi:10.1002/hbm.23330. 621
622 623
Figure 1. Building of optic radiations and measurement of fractional anisotropy, using the Olea Medical ® software (image: CHU de Bordeaux, department of neuroimaging).
Green boxes are the markers placed manually on anterior and posterior parts of the optic radiations. Green lines are optic radiations automatically reconstructed by the Olea Medical® software. Red boxes are markers manually placed to manually deleted fibers outside the expected area.
Table 1: General characteristics
Characteristics Glaucoma Control p-value*
(n=50) (n=50)
Age (years, mean(SD)) 61.9 (6.9) 61.9 (7.0) 0.98
Sex (n, %) 1
Male 20 (40) 20 (40) Female 30 (60) 30 (60)
MMSE (mean(SD)) 29.3 (0.8) 29.4 (0.8) 0.7
Family history of glaucoma
(n (%)) <0.0001 Yes 29 (58) 0 (0) No 16 (32) 50 (100) Unknown 5 (10) 0 (0) Self-reported medical history Hypertension (n (%)) 11 (22) 12 (24) 0.81 Hypercholesterolemia (n (%)) 14 (28) 12 (24) 0.65 Hypertriglyceridemia (n (%)) 2 (4) 3 (6) 0.65 Myocardial infarction (n (%)) 2 (4) 1 (2) 0.56 Smoking (n (%)) 0.67 Never 29 (58) 25 (50) Former 17 (34) 19 (38) Current 4 (8) 6 (12)
MMSE: Mini Mental State Examination
Table 2: Ophthalmological characteristics; right eye (mean (standard deviation))
Characteristics
Glaucoma Control
p-value*
(n=50) (n=50)
Best-Corrected Visual Acuity
(logMAR)
Distance 0.03 (0.09) 0.006 (0.02) 0.09 Near 0.19 (0.07) 0.18 (0.00) 0.2
Central corneal thickness (μm) 525.9 (30.9) 544.01 (31.9) 0.005
Axial Length (mm) 24.1 (1.1) 23.7 (1.2) 0.15
IOP (mmHg) 14.6 (3.7) 14.7 (2.5) 0.82
Vertical Cup : Disc Ratio 0.8 (0.2)1 0.3 (0.2)1 <0.0001
RNFL Thickness (μm) 76.9 (17.7) 93.2 (9.9) <0.0001 Visual field (dB) Mean Sensitivity 21.9 (6.1) 26.6 (1.1) <0.0001 Mean Deviation 5.0 (6.0) 0.3 (1.0) <0.0001 Loss Variance 22.6 (26.3) 5.0 (1.8) <0.0001
RNFL: Retinal Nerve Fiber Layer IOP: Intraocular Pressure
* Chi-square for categorical variables and Student t-test for continuous variables
1
Table 3: Ophthalmological characteristics; left eye (mean (standard deviation))
Characteristics
Glaucoma Control
p-value*
(n=50) (n=50)
Best-Corrected Visual Acuity
(logMAR)
Far 0.03 (0.08) 0.006 (0.02) 0.08 Near 0.2 (0.1) 0.2 (0) 0.1
Central corneal thickness (μm) 524.6 (30.0)1 542.9 (28.4)2 0.003
Axial Length (mm) 24.0 (1.0) 23.5 (0.8) 0.003
IOP (mmHg) 14.2 (3.2) 15.2 (2.4) 0.09
Vertical Cup : Disc Ratio
Funduscopy 0.8 (0.2) 0.3 (0.2) <0.0001 RNFL Thickness (μm) 70.1 (18.7) 93.1 (9.7) <0.0001 Visual field (dB) Mean Sensitivity: MS 21.8 (4.6) 26.6 (1.2) <0.0001 Mean Deviation: MD 5.1 (4.5) 0.3 (1.1) <0.0001 Loss Variance: LV 28.1 (28.0) 4.7 (2.2) <0.0001
RNFL: Retinal Nerve Fiber Layer IOP: Intraocular Pressure
* Chi-square for categorical variables and Student t-test for continuous variables
1
Table 4: Comparison of MRI parameters along optic radiations between glaucoma and control subjects (mean (standard deviation))
P-value* Glaucoma Control (n=49) (n=47) Fractional anisotropy 0.57 (0.04) 0.59 (0.03) 0.02 Mean diffusivity (10-5 mm2/s) 82.38 (6.43) 80.62 (4.87) 0.10 Axial diffusivity (10-5 mm2/s) 141.59 (7.14) 142.37 (6.74) 0.53 Radial diffusivity (10-5 mm2/s) 52.78 (6.74) 49.74 (5.04) 0.03 Length (mm) 63.91 (6.80) 63.72 (7.15) 0.74 Volume (cm3) 20.79 (9.13) 24.96 (12.33) 0.11
Table 5: Associations of homo- and contra-lateral optic radiation parameters with the severity of the disease in glaucoma patients
Visual field Funduscopy SD-OCT examination
Mean Deviation Vertical Cup/Disc Ratio RNFL thickness
β[95%CI] P β [95%CI] P β [95%CI] P
Homolateral Fractional anisotropy -0.22 [-0.41;-0.02] 0.03 -0.42 [-0.64;-0.21] 0.0003 0.22 [0.03;0.41] 0.03 Mean diffusivity 0.02 [-0.17;0.21] 0.80 0.29 [0.08;0.50] 0.008 -0.15 [-0.34;0.04] 0.12 Axial diffusivity -0.11 [-0.31;0.08] 0.26 0.09 [-0.14;0.31] 0.45 -0.06 [-0.26;0.14] 0.56 Radial diffusivity 0.09 [-0.10;0.28] 0.33 0.38 [0.17;0.59] 0.0006 -0.18 [-0.37;-0.007] 0.06 Controlateral Fractional anisotropy -0.17 [-0.37;0.02] 0.09 -0.28 [-0.55;-0.06] 0.01 0.10 [-0.09;0.30] 0.30 Mean diffusivity 0.13 [-0.06;0.31] 0.19 0.20 [-0.02;0.41] 0.07 0.01 [-0.18;0.21] 0.91 Axial diffusivity 0.04 [-0.15;0.24] 0.67 0.07 [-0.16;0.30] 0.55 0.09 [-0.11;0.30] 0.34 Radial diffusivity 0.15 [-0.04;0.34] 0.11 0.25 [0.04;0.46] 0.02 -0.03 [-0.23;0.16] 0.72
CI: Confidence Interval; RNFL: Retinal Nerve Fiber Layer
Table 6: Comparison of DTI parameters and MRI-based volume between glaucoma and control subjects (mean (standard deviation))
Cerebrum white matter Cerebrum grey matter Hippocampus Amygdala
Glaucoma Control P-value* Glaucoma Control P-value Glaucoma Control P-value Glaucoma Control P-value (n=48) (n=48) (n=48) (n=48) (n=48) (n=48) (n=48) (n=48) Volume (cm3) 275.28 (115.61) 238.25 (59.03) 0.06 270.19 (59.03) 283.09 (38.17) 0.18 3.95 (0.53) 3.84 (0.46) 0.16 0.60 (0.23) 0.55 (0.18) 0.22 DTI parameters (n=41) (n=41) (n=41) (n=41) (n=41) (n=41) (n=41) (n=41) FA 0.38 (0.02) 0.37 (0.02) 0.39 0.17 (0.01) 0.17 (0.01) 0.45 0.19 (0.01) 0.19 (0.02) 0.44 0.15 (0.02) 0.15 (0.01) 0.09 MD (10-5 mm2/s) 78.34 (3.58) 78.19 (3.21) 0.79 121.70 (9.63) 120.01 (8.81) 0.25 98.83 (8.82) 97.72 (5.79) 0.42 80.45 (4.03) 80.56 (3.40) 0.87 AD (10-5 mm2/s) 110.91 (2.80) 110.35 (2.53) 0.26 138.84 (10.50) 136.96 (9.67) 0.24 116.86 (9.78) 115.46 (6.17) 0.39 92.64 (4.43) 92.21 (3.31) 0.57 RD (10-5 mm2/s) 62.24 (4.17) 62.27 (3.78) 0.96 113.20 (9.23) 111.60 (8.44) 0.26 90.02 (8.40) 88.90 (5.74) 0.44 74.35 (3.99) 74.73 (3.53) 0.57 Abreviations: AD: Axial diffusivity; FA: Fractional anisotropy; MD: Mean diffusivity; RD: Radial diffusivity