INVITED REVIEW
A comprehensive analysis of gene expression profiles
in distal parts of the mouse renal tubule
Sylvain Pradervand
&Annie Zuber Mercier
&Gabriel Centeno
&Olivier Bonny
&Dmitri Firsov
Received: 12 May 2010 / Revised: 5 July 2010 / Accepted: 5 July 2010 / Published online: 5 August 2010 # Springer-Verlag 2010
Abstract The distal parts of the renal tubule play a critical
role in maintaining homeostasis of extracellular fluids. In this
review, we present an in-depth analysis of microarray-based
gene expression profiles available for microdissected mouse
distal nephron segments, i.e., the distal convoluted tubule
(DCT) and the connecting tubule (CNT), and for the cortical
portion of the collecting duct (CCD; Zuber et al., Proc Natl
Acad Sci USA 106:16523–16528,
2009
). Classification of
expressed transcripts in 14 major functional gene categories
demonstrated that all principal proteins involved in
main-taining the salt and water balance are represented by highly
abundant transcripts. However, a significant number of
transcripts belonging, for instance, to categories of
G-protein-coupled receptors or serine/threonine kinases exhibit
high expression levels but remain unassigned to a specific
renal function. We also established a list of genes
differen-tially expressed between the DCT/CNT and the CCD. This
list is enriched by genes related to segment-specific transport
functions and by transcription factors directing the
develop-ment of the distal nephron or collecting ducts. Collectively,
this in silico analysis provides comprehensive information
about relative abundance and tissue specificity of the DCT/
CNT and the CCD expressed transcripts and identifies new
candidate genes for renal homeostasis.
Keywords Kidney . Homeostasis . Membrane transport .
Transport . Urinary excretion
Introduction
The final adjustment of urine composition takes place in the
distal parts of the renal tubule, i.e., in the distal nephron and in
the collecting duct. Over the last decades, research efforts in
the field allowed identification of many essential proteins
(channels, transporters, receptors, etc.) involved in this
process. The majority of these proteins were first discovered
by expression cloning, an approach based on the a priori
available information about function and tissue expression
distribution of the candidate gene. The aquaporin-2 water
channel (aqp-2), the V2-type of vasopressin receptor (Avpr2),
the Ca
2+-sensing receptor (CaSR), the thiazide-sensitive
sodium chloride cotransporter (NCC), the secretory
potassi-um channel (ROMK), the amiloride-sensitive sodipotassi-um
chan-nel (ENaC), and the epithelial calcium chanchan-nel (Trpv5) are
just a few out of many examples of proteins identified by this
approach. Moreover, a growing list of functionally important
genes has been added from human genetic association
studies. The latter includes WNK1 and WNK4 serine/
threonine kinases [
1
], the FXYD2 subunit of the
Na,K-ATPase [
2
], the KCNJ10 and KCNA1 potassium channels,
and the pro-EGF [
3
–
5
]. Significant progress in deciphering
Olivier Bonny and Dmitri Firsov have equally contributed to the study.
Electronic supplementary material The online version of this article (doi:10.1007/s00424-010-0863-8) contains supplementary material, which is available to authorized users.
A. Zuber Mercier
:
G. Centeno:
O. Bonny (*):
D. Firsov (*) Department of Pharmacology and Toxicology,University of Lausanne, 27 rue du Bugnon, 1005 Lausanne, Switzerland e-mail: [email protected] e-mail: [email protected] S. Pradervand
Lausanne Genomic Technologies Facility, Center for Integrative Genomics, University of Lausanne, 1015 Lausanne, Switzerland O. Bonny
Service of Nephrology, Lausanne University Hospital, 1011 Lausanne, Switzerland
regulatory pathways in the distal nephron and/or collecting
ducts has been made with the development of methods
allowing global view of all expressed transcripts
(tran-scriptome) or proteins (proteome) and their dynamics. For
example, the aldosterone or vasopressin signaling pathways
were extensively characterized by the serial analysis of gene
expression and microarray hybridization [
6
,
7
]. Various
proteome tools were used for identification of
vasopressin-dependent phosphorylation sites within aqp-2 or for
detec-tion of lithium-induced changes in the proteome of the inner
medullary collecting ducts (IMCD) [
8
,
9
].
In order to identify new genes involved in renal
homeo-static mechanisms, we used an in silico approach based on the
analysis of transcript abundance in several major functional
gene categories most relevant to secretion/reabsorption
pro-cesses in the distal nephron and/or the collecting duct. This
analysis was performed on a recently obtained
microarray-based dataset of gene expression profiles of the mouse distal
convoluted tubule (DCT), the connecting tubule (CNT), and
the cortical collecting duct (CCD) [
10
]. The principal
characteristics of this dataset are the following: (1) the
DCT/CNT and the CCD samples were obtained by
micro-dissection; the DCT and CNT were microdissected together
because of the gradual transition between these two segments
in mice; (2) samples were prepared from animals sacrificed
for microdissection every 4 h throughout a 12 h/12 h light–
dark cycle (a total of six time points); this protocol allows
detection of all expressed transcripts independently of diurnal
variations in their expression levels; (3) a total of 30 animals
were used for microdissection of DCT/CNT and CCD
samples (five animals per time point); (4) 12 microarray
hybridizations were performed for both DCT/CNT and CCD
(two hybridizations per time point). The quality of
microdis-section was validated by the analysis of expression levels of
several nephron segment-enriched transcripts (see [
10
] and
below). Altogether, this dataset represents a complete and
reliable source of information on the genes expressed in the
distal nephron and the CCD (see below).
Functional classification and analysis of transcript
abun-dance allowed us to identify a new set of highly abundant
transcripts encoding proteins potentially relevant to the
homeostasis of water and/or electrolytes. Finally, comparison
of the DCT/CNT and the CCD transcriptomes revealed a
number of previously uncharacterized transcripts exhibiting
significantly different expression levels between these parts of
the renal tubule. These data could be further used for the
functional characterization of the identified candidates.
Functional classification of DCT/CNT and CCD transcripts
Functional classification of DCT/CNT and CCD transcripts
was performed using the PANTHER Classification System, a
database allowing subdivision of proteins and mRNA
tran-scripts into functionally related categories (
www.pantherdb.
org
). A similar approach was previously used by Uawithya et al.
for the transcriptional profiling of rat IMCD [
11
]. The
classification data are presented in tables in which only the
20 most abundant transcripts per category are listed for space
purposes. If more than 20 transcripts per category fitted the
cutoff criteria (see below), a full list of transcripts can be
viewed in associated supplementary tables. The transcripts are
ranked by their abundance calculated as log2 normalized
microarray hybridization signal intensity (A values) [
12
].
Hence, a difference in one unit of A values corresponds to the
twofold difference in the transcript expression levels. The
median microarray signal intensity (5.8 units of A value, for
both the DCT/CNT and the CCD transcriptomes) was chosen
as an arbitrary cutoff value above which expression of a
transcript was assigned as significant. The data are discussed in
terms of expression levels or transcripts abundance. However,
we have to emphasize that microarray signal intensities and
sequencing-based quantification of mRNA abundance have
been shown to exhibit a correlation coefficient of ~0.7 [
13
]. To
assess this correlation in the DCT/CNT and the CCD datasets,
we performed qPCR analysis of transcripts abundance in one of
the selected gene categories, namely G-protein-coupled
recep-tors (GPCR). As shown in Fig.
1a, b
, both DCT/CNT and
CCD datasets exhibit a good correlation between microarray
signal intensities and Ct values of qPCR amplification
(correlation coefficients of 0.769 and 0.823, respectively).
These data also demonstrate that transcripts with A values
below the median cutoff level exhibit significantly lower
correlation between microarray and qPCR data.
G-protein-coupled receptors
Most GPCRs that have been previously identified in the DCT/
CNT and/or the CCD are abundantly represented in the
respective transcriptomes (Table
1
and Supplemental Table
1
).
These include vasopressin receptors type 1a (Avpr1a) and
type 2 (Avpr2), prostaglandin E receptors type 3 (Ptger3),
type 1 (Ptger1), and type 4, prostaglandin F receptor (Ptgfr),
glucagon receptor (Gcgr), proteinase-activated receptor 2
(F2rl1), CaSR, endothelin receptor type B (Ednrb),
parathy-roid hormone receptor 1 (Pth1r), adenosine A1 receptor, and
adrenergic receptors type beta 1, beta 2, and alpha 2a. This
analysis also revealed the presence of a number of highly
abundant GPCRs with yet unassigned function in the kidney.
For instance, both DCT/CNT and CCD exhibit high
expression levels of several chemokine GPCRs, including
Ccrl1, Cxcr4, and Gpr146. The Cxcr4 receptor has been
shown to bind SDF-1, a chemokine involved in a multitude
of functions, including epithelial patterning and renal
morphogenesis [
14
]. However, the role of chemokine
GPCRs in the adult kidney remains unknown. The DCT/
CNT and the CCD transcriptomes are enriched by orphan
receptors belonging to a subclass of adhesion GPCRs
(Celsr2, Gpr116, Gpr56, and Celsr1). Adhesion GPCRs
constitute a novel subclass of GPCRs characterized by the
presence in their N termini of cadherin-like cell adhesion
modules. These receptors are critical for the normal
development of the central nervous system and for the
immune response. Several adhesion GPCRs are involved in
human diseases. For example, deletion of the Gpr56 gene in
human causes the autosomal recessive bilateral frontoparietal
polymicrogyria, a disease characterized by severe
neurolog-ical dysfunction [
15
]. However, a renal phenotype in these
patients, if any, has not yet been communicated. Both the
A
B
CCD
DCT/CNT
r=0.769
− 35 −30 − 25 − 20 2468 1 0 1 2 1 4 − Normalized Ct valuesRMA normalized values
Avpr1a Ptger3 Avpr2 Adrb1 Ptgfr Casr Ednrb Pth1r
r=0.823
−35 − 30 − 25 −20 2468 1 0 1 2 1 4 − Normalized Ct valuesRMA normalized values
Avpr1a Ptger3 Avpr2 Adrb1 Ptgfr Casr Ednrb Pth1r a b a b
Fig. 1 Correlation between qPCR- and microarray-based expression levels of GPCRs expressed in the DCT/CNT (a) and the CCD (b). Negative mean normalized Ct values (x-axis) are plotted against normalized expression values measured by Affymetrix microarrays (y-axis). Genes with the Ct values of 36 or above are not plotted. Loess
curves are indicated with a red line. Genes considered as expressed from the microarray data are indicated with a red dot. Several genes discussed in the text are indicated with a green dot. Two outliers are Cxcr7 (a) and S1pr3 (b). The qPCR was performed on mouse GPCR array from Applied Biosystems
Gene name Gene DCT/CNT CCD
Symbol A value A value Arginine vasopressin receptor 1A Avpr1a 12.23 12.44 Cadherin, EGF LAG seven-pass G-type receptor 2 Celsr2 11.27 12.06 Chemokine (C-X-C motif) receptor 7 Cxcr7 11.03 12.34 G-protein-coupled receptor 116 Gpr116 10.79 11.34 G-protein-coupled receptor 56 Gpr56 10.68 11.60 Chemokine (C-X-C motif) receptor 4 Cxcr4 10.39 10.65 Prostaglandin E receptor 3 (subtype EP3) Ptger3 10.29 9.04 G-protein-coupled receptor, family C, group 5, member C Gprc5c 10.25 11.11 Arginine vasopressin receptor 2 Avpr2 9.89 11.61 Oxoglutarate (alpha-ketoglutarate) receptor 1 Oxgr1 9.69 9.44 Xenotropic and polytropic retrovirus receptor 1 Xpr1 9.68 9.92 Prostaglandin F receptor Ptgfr 9.61 10.28 G-protein-coupled receptor, family C, group 5, member B Gprc5b 9.41 10.53 Glucagon receptor Gcgr 9.28 8.77 Coagulation factor II (thrombin) receptor-like 1 F2rl1 9.25 9.97 Calcium-sensing receptor CaSR 9.16 9.42 Endothelin receptor type B Ednrb 9.01 9.35 Prostaglandin E receptor 1 (subtype EP1) Ptger1 8.85 9.43 Parathyroid hormone 1 receptor Pth1r 8.82 6.73 G-protein-coupled receptor 108 Gpr108 8.81 9.05 Table 1 G-protein-coupled
DCT/CNT and the CCD transcriptomes revealed high
expres-sion levels of Gprc5C and Gprc5B, two receptors related to the
family C of GPCRs, which also includes the metabotropic
glutamate receptors, the GABA(B) receptors, several
phero-mone receptors, and the calcium-sensing receptor [
16
].
However, in contrast to other members of the family, both
Gprc5C and Gprc5B still remain orphans. Our analysis also
revealed a high expression of three receptors belonging to the
class A of the rhodopsin-like GPCRs, namely the oxoglutarate
receptor 1 (Oxgr1), the estrogen receptor (Gper or Gpr30),
and the apelin receptor. Several pieces of evidence indicate
that these receptors may have an important role in the
regulation of tubular solute transport. Oxgr1 (also known as
Gpr80 or Gpr99) is a specific receptor to
α-ketoglutarate, a
citric acid cycle intermediate [
17
]. Interestingly, urinary
concentration of
α-ketoglutarate varies significantly upon
perturbation of systemic acid–base balance, being significantly
increased in alkalosis and significantly decreased in acidosis
[
18
]. This suggests a possible role for Oxgr1 in sensing acid
–
base disequilibrium. Gper is a recently identified plasma
membrane estrogen receptor which mediates nongenomic
effect of estrogen. As it was recently hypothesized, Gper may
be involved in the rapid magnesiotropic effects of estrogen in
the distal nephron [
19
]. Apelin is a recently discovered
peptide which mediates a multitude of biological functions
including vasoconstriction, cardiac myogenesis, glucose
me-tabolism, and vasopressin synthesis/release in the brain.
Knockout of apelin receptor in mice leads to abnormal fluid
homeostasis, resulting in disturbance of both kidney urinary
concentration capacity and drinking behavior [
20
]. The role of
this receptor in the renal tubules has not yet been elucidated.
Heterotrimeric G proteins
GPCRs transduce signals from extracellular stimuli by
activating heterotrimeric G proteins. These latter can be
grouped into four subfamilies Gαs, Gαi, Gαq/11, and
Gα12/13, according to the structural and functional properties
of their
α subunits. Gαs and Gαi regulate intracellular cAMP
levels by activating (Gαs) or inhibiting (Gαi1, Gαi2, and
Gαi3) adenylyl cyclase; Gαq and Gα11 increase intracellular
Ca
2+level via activation of phospholipase C (PLC); and
Gα12 and Gα13 couple GPCRs to the small GTPases of the
Rho family. As shown in Table
2
, all
α subunits, with the
exception of Gα12, are well represented in both
tran-scriptomes, thereby providing molecular basis for a variety
of intracellular signaling pathways activated by GPCRs in
these parts of the renal tubule.
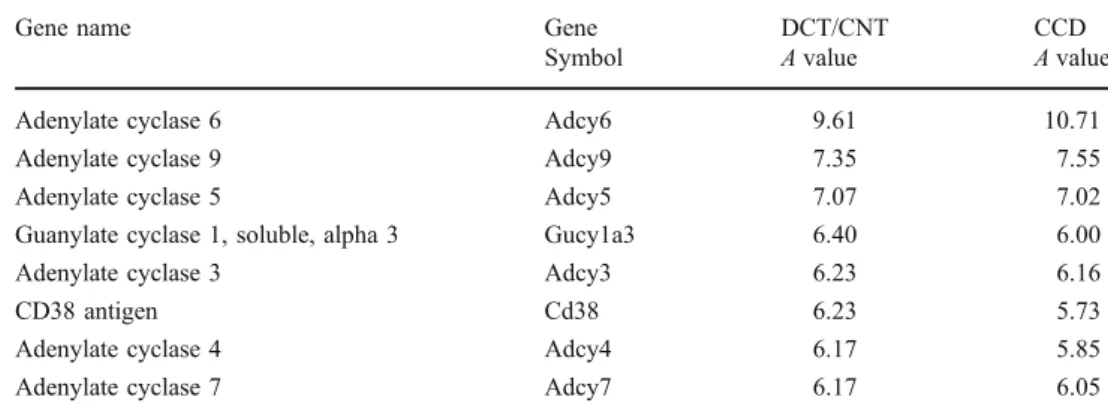
Nucleotide cyclases
Chabardès et al. have shown that cortical and outer
medullary collecting ducts exhibit high expression levels
of Ca
2+-inhibitable adenylyl cyclases 6 (Adcy6) and 5
(Adcy5) [
21
]. Our data support these findings and extend
the Adcy6 and Adcy5 distribution to the DCT/CNT
(Table
3
). Both the DCT/CNT and the CCD also show a
high expression of Adcy9, a cyclase which can be either
potentiated or inhibited by the intracellular Ca
2+[
22
].
Collectively, these cyclases represent a point of crosstalk
between the cAMP- and Ca
2+-dependent signaling
path-ways. Similar to what was found in the IMCD, both the
DCT/CNT and the CCD exhibit low expression of
guanylate cyclases (only Gucy1a3 fit the cutoff criteria),
and none of the nitric acid synthase isoforms were detected
(data not shown) [
11
].
Cyclic nucleotide phosphodiesterases
Cyclic nucleotide phosphodiesterases (Pde) participate in
attenuation of GPCR signaling by degrading cellular cAMP
and/or cGMP. As shown in Table
4
, both the DCT/CNT and
the CCD exhibit high expression levels of several
cAMP-specific phosphodiesterases, including Ca
2+-activated
Pde1a and cGMP-inhibited Pde3b. A significant expression
of 3-isobutyl-1-methylxanthine (IBMX)-insensitive Pde8a
and Pde8b provides a molecular basis for the
IBMX-insensitive fraction of phosphodiesterase activity. The
rolipram-sensitive cAMP-specific Pde4b and Pde4a have
been proposed as important regulators of Avpr2-induced
signaling cascade [
23
]. However, in the DCT/CNT and the
CCD transcriptomes presented here, they are expressed
only at moderate levels.
Protein kinases
More than 350 protein kinases have been found in the
transcriptomes of the DCT/CNT and the CCD (Table
5
and
Supplemental Table
2
). Most of them (~300, Table
5
and
Supplemental Table
2
) belong to the class of serine/
threonine protein kinases. Importantly, kinases that have
been previously reported to strongly influence the secretion/
reabsorption processes in DCT/CNT and/or the CCD are
abundantly represented. WNK1, WNK4, SPAK (STK39),
and Sgk1 have been involved in maintaining salt balance
and are present within the 20 most abundant serine/
threonine kinases. Both the DCT/CNT and the CCD also
exhibit moderate to high expression levels of protein kinase
A (Prkaa2, Prkacb, Prkaca, and Prkaa1), protein kinase C
(Prkcd, Prkci, Prkch, Prkca, and Prkcz), casein kinases
(Csnk1d, Csnk1a1, Csnk2a1, Csnk1g2, and Csnk2a2),
Gsk3β, and G-protein-coupled receptor kinases 6, 5, and
4. Interestingly, several in vitro studies have demonstrated
that the activity of the NCC is regulated by WNK3 [
24
], a
kinase which is expressed at background levels in our data
(A values of 3.8 and 2.8 in DCT/CNT and CCD,
respectively). Accordingly, WNK3 is also absent in
microarray-based rat IMCD transcriptome [
11
].
Collective-ly, these results indicate that WNK3 distribution in the
kidney requires a detailed re-evaluation. By contrast, both
the DCT/CNT and the CCD exhibit strong expression of
various serine/threonine kinases with yet unattributed
function in the kidney. These include Pctk1, Pim3, Pak4,
Aak1, Taok3, Rock1, and several MAP kinases. In the
kidney, tyrosine kinases (Table
5
) and receptor tyrosine
kinases (Table
5
) have been mostly involved in
tubulo-genesis, in cell differentiation, and in maintaining cell
polarity. However, the fibroblast growth factor receptor 1
(Fgfr1), which is specifically expressed in the distal
nephron and the collecting duct, has been recently shown
as the predominant receptor for the hypophosphatemic
action of fibroblast growth factor 23 [
25
].
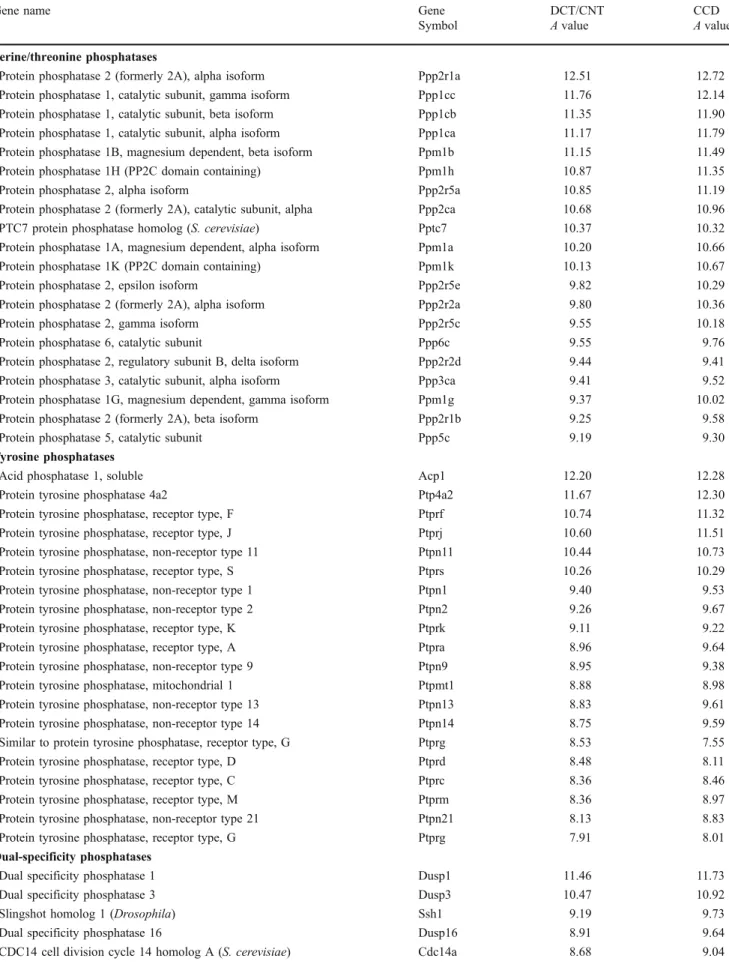
Protein phosphatases
Protein phosphatases participate in intracellular signaling
by reversing protein-kinase-dependent events. All protein
phosphatases can be grouped into three subfamilies:
serine/threonine phosphatases, phosphotyrosine-specific
protein tyrosine phosphatases, and dual specificity
(ser-ine/threonine/tyrosine) phosphatases. As shown in Table
6
and Supplemental Table
3
, both DCT/CNT and CCD
express a variety of highly abundant phosphatases
repre-senting all three subfamilies. However, despite high
expression levels and, presumably, significant functional
role, only a limited number of phosphatases have been
characterized in the kidney. Several studies have shown
that calcineurin (Ppp3ca), a serine/threonine phosphatase
with broad substrate specificity, is involved in the
Gene Name Gene DCT/CNT CCD
Symbol A value A value Guanine nucleotide binding protein, alpha stimulating Gnas 12.34 12.59 Guanine nucleotide binding protein (G protein), beta 1 Gnb1 11.81 12.36 Guanine nucleotide binding protein (G protein), gamma 12 Gng12 11.63 11.64 Guanine nucleotide binding protein, alpha 13 Gna13 10.90 11.22 Guanine nucleotide binding protein (G protein), alpha inhibiting 1 Gnai1 10.84 11.12 Guanine nucleotide binding protein, alpha 11 Gna11 10.65 11.43 Guanine nucleotide binding protein (G protein), gamma 5 Gng5 10.59 11.36 Guanine nucleotide binding protein (G protein), gamma 4 Gng4 10.26 10.72 Guanine nucleotide binding protein (G protein), alpha inhibiting 2 Gnai2 9.92 11.01 Guanine nucleotide binding protein, alpha q polypeptide Gnaq 9.72 10.27 Guanine nucleotide binding protein (G protein), alpha inhibiting 3 Gnai3 9.62 10.41 Guanine nucleotide binding protein (G protein), beta 4 Gnb4 8.92 9.46 Guanine nucleotide binding protein (G protein), gamma 11 Gng11 8.82 9.23 Guanine nucleotide binding protein (G protein), gamma 10 Gng10 7.62 8.65 Guanine nucleotide binding protein (G protein), beta 5 Gnb5 7.58 7.95 Guanine nucleotide binding protein (G protein), beta 2 Gnb2 7.45 8.48 Guanine nucleotide binding protein (G protein), gamma 2 Gngt2 7.31 6.75 Guanine nucleotide binding protein (G protein), gamma 2 Gng2 6.42 5.94 Guanine nucleotide binding protein, alpha z subunit Gnaz 6.33 6.59 Guanine nucleotide binding protein, alpha 12 Gna12 6.05 6.87 Table 2 Heterotrimeric G
proteins
Gene name Gene DCT/CNT CCD
Symbol A value A value Adenylate cyclase 6 Adcy6 9.61 10.71 Adenylate cyclase 9 Adcy9 7.35 7.55 Adenylate cyclase 5 Adcy5 7.07 7.02 Guanylate cyclase 1, soluble, alpha 3 Gucy1a3 6.40 6.00 Adenylate cyclase 3 Adcy3 6.23 6.16
CD38 antigen Cd38 6.23 5.73
Adenylate cyclase 4 Adcy4 6.17 5.85 Adenylate cyclase 7 Adcy7 6.17 6.05 Table 3 Nucleotide cyclases
regulation of transport proteins, including the
Na,K-ATPase, aqp-2, ROMK, and acid–base transporters [
26
–
29
]. The ROMK has been also shown as a substrate of
tyrosine phosphatases [
30
]. Dual specificity phosphatases
are thought to participate in renal function mainly by
dephosphorylating kinases involved in the stress response
(e.g., MAP kinases).
A-kinase-anchoring proteins
A-kinase-anchoring proteins (AKAPs) constitute a family
of scaffold proteins involved in the targeting of protein
kinase A to its substrates. The AKAPs have been
extensively studied for their role in the PKA-dependent
regulation of aqp-2 and ENaC activity. Henn et al. and
Okutsu et al. have demonstrated that aqp-2 is colocalized
with AKAP7 (AKAP18) and AKAP11 (AKAP220) in
subapical vesicles of the principal cell [
31
,
32
]. Bengrine
et al. have shown that AKAP7 is also involved in the
feedback inhibition of ENaC [
33
]. It has been proposed
that these AKAPs are required for compartmentalization
of cAMP signaling in the principal cell. As shown in
Table
7
, we found both AKAP7 and AKAP11 in the DCT/
CNT and CCD transcriptomes. However, the role of the
more abundant AKAPs 2, 9, and 8 has not yet been
assessed.
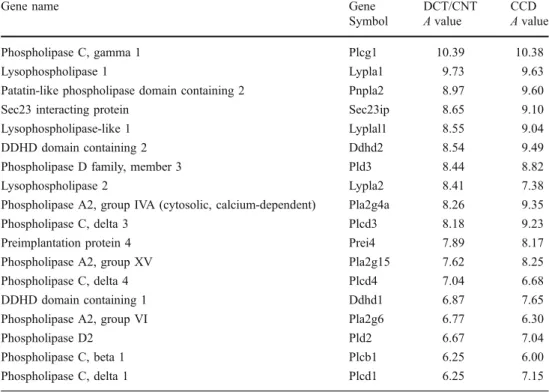
Phospholipases
Phospholipases play important roles in transmembrane
signaling processes activated by GPCRs and receptor
tyrosine kinases. Receptor-mediated activation of
phos-pholipases results in hydrolysis of membrane
phospholi-pids and generation of phospholipid-derived second
messengers. PLC is a family of enzymes which catalyzes
the hydrolysis of phosphatidylinositol 4,5-biphosphate to
produce diacylglycerol (DAG) and inositol
1,4,5-tri-sphosphate. In the DCT/CNT and/or the CCD, several
targets of PLC/DAG/PKC cascade have been identified,
including TRPV5 calcium channel, aqp-2, ROMK, and
ENaC [
34
–
37
]. We found that the most abundant
phospholipase in the DCT/CNT and the CCD is Plcg1, a
PLC activated by a variety of growth factors including
platelet-derived growth factor, hepatocyte growth factor,
and fibroblast growth factor (Table
8
). Recently, Irarrazabal
et al. have shown that Plcg1 contributes to the
osmopro-tective effect of TonEBP/OREBP transcriptional factor
in the kidney [
38
]. Analysis of both transcriptomes
also revealed expression of Ca
2+-sensitive PLC isoforms
Plcd3 and Plcd1 but only a low amount of Gq-activated
Plcb1. Phospholipase A2 (PLA2) catalyzes the hydrolysis
of phospholipids to generate free fatty acids and
lyso-phospholipids. One of the principal products of PLA2
activity is the arachidonic acid, a precursor in the
biosynthesis of prostaglandins and other eicosanoids.
Prostaglandins are known to regulate water and solutes
transport in an autocrine or paracrine manner by activating
apical or basolateral GPCRs. According to our data, the
principal PLA2 isoforms expressed in the DCT/CNT and
the CCD are Pla2g4a, Pla2g15, and Pla2g6 (Table
8
).
Phospholipase D (PLD) isoforms which are also
abun-dantly represented in both transcriptomes have been
recently shown to be important regulators of endocytosis
and endosomal recycling pathways [
39
].
Gene name Gene DCT/CNT CCD
Symbol A value A value Phosphodiesterase 1A, calmodulin dependent Pde1a 10.75 10.99 Phosphodiesterase 3B, cGMP-inhibited Pde3b 10.39 10.94 Phosphodiesterase 8A Pde8a 10.21 10.00 Phosphodiesterase 8B Pde8b 9.63 10.52 Phosphodiesterase 6D, cGMP-specific, rod, delta Pde6d 8.84 9.20 Phosphodiesterase 1C Pde1c 8.22 9.20 Phosphodiesterase 2A, cGMP-stimulated Pde2a 7.92 7.25 Phosphodiesterase 7A Pde7a 7.59 8.15 Phosphodiesterase 4B, cAMP specific Pde4b 7.49 8.35 2′,3′-Cyclic nucleotide 3′ Phosphodiesterase Cnp 7.43 8.10 Phosphodiesterase 7B Pde7b 7.17 8.18 Phosphodiesterase 4A, cAMP specific Pde4a 7.05 6.82 Phosphodiesterase 9A Pde9a 6.78 6.97 Phosphodiesterase 6H, cGMP-specific, cone, gamma Pde6h 6.64 6.09 Phosphodiesterase 10A Pde10a 6.45 7.26 Phosphodiesterase 1B, Ca2+-calmodulin dependent Pde1b 5.85 4.71a Table 4 Phosphodiesterases
aThe A value is below the cutoff
Table 5 Protein kinases
Gene name Gene DCT/CNT CCD
Symbol A value A value Serine/threonine kinases
Calcium/calmodulin-dependent protein kinase II, beta Camk2b 12.95 13.41 PCTAIRE-motif protein kinase 1 Pctk1 12.51 12.68 WNK lysine-deficient protein kinase 1 Wnk1 12.48 11.27 Proviral integration site 3 Pim3 12.43 12.20 Serum/glucocorticoid regulated kinase 1 Sgk1 11.98 12.86 Mitogen-activated protein kinase kinase kinase 12 Map3k12 11.85 11.90 MAP kinase-interacting serine/threonine kinase 2 Mknk2 11.54 12.23 p21 (CDKN1A)-activated kinase 4 Pak4 11.53 12.31
AP2-associated kinase 1 Aak1 11.50 11.93
Serum/glucocorticoid regulated kinase 2 Sgk2 11.42 10.91
TAO kinase 3 Taok3 11.34 10.85
Glycogen synthase kinase 3 beta Gsk3b 11.28 12.04
Casein kinase 1, delta Csnk1d 11.20 11.79
Rho-associated coiled-coil containing protein kinase 1 Rock1 11.13 11.28 Mitogen-activated protein kinase-activated protein kinase 3 Mapkapk3 11.07 11.40 NIMA (never in mitosis gene a)-related expressed kinase 7 Nek7 11.02 11.20 Casein kinase 1, alpha 1 Csnk1a1 11.01 11.56 WNK lysine-deficient protein kinase 4 Wnk4 10.99 10.46 p21 (CDKN1A)-activated kinase 2 Pak2 10.91 11.60 Pyruvate dehydrogenase kinase, isoenzyme 2 Pdk2 10.80 10.80 Nonreceptor tyrosine kinases
Fyn-related kinase Frk 10.1 10.91
Dual-specificity tyrosine-(Y)-phosphorylation regulated kinase 1a Dyrk1a 9.55 10.59 PTK2 protein tyrosine kinase 2 Ptk2 9.15 10.02 PTK2 protein tyrosine kinase 2 beta Ptk2b 8.81 8.85
Lemur tyrosine kinase 2 Lmtk2 8.73 9.99
Fer (fms/fps-related) protein kinase, testis specific 2 Fert2 8.73 9.47
Janus kinase 2 Jak2 8.66 9.12
Janus kinase 1 Jak1 8.46 9.24
Tyrosine kinase, nonreceptor, 1 Tnk1 8.25 8.78
FMS-like tyrosine kinase 1 Flt1 8.24 7.46
FMS-like tyrosine kinase 4 Flt4 8.18 7.82
Tyrosine kinase, non-receptor, 2 Tnk2 7.83 8.34
Tec protein tyrosine kinase Tec 7.76 7.94
Tyrosine kinase 2 Tyk2 7.18 7.53
c-Mer proto-oncogene tyrosine kinase Mertk 7.12 6.24
c-Src tyrosine kinase Csk 7.02 7.59
Serine/threonine/tyrosine kinase 1 Styk1 6.99 8.85 PTK7 protein tyrosine kinase 7 Ptk7 6.53 6.49 Aatyk3 mRNA for apoptosis-associated tyrosine kinase 3 Lmtk3 6.29 6.04 Tyrosine kinase receptors
Met proto-oncogene Met 11.36 11.87
Discoidin domain receptor family, member 1 receptor Ddr1 11.35 11.45 Fibroblast growth factor receptor 2 Fgfr2 10.31 11.30
Insulin receptor Insr 9.52 9.83
Insulin receptor-related receptor Insrr 9.50 10.06 Insulin-like growth factor I receptor Igf1r 9.04 9.99
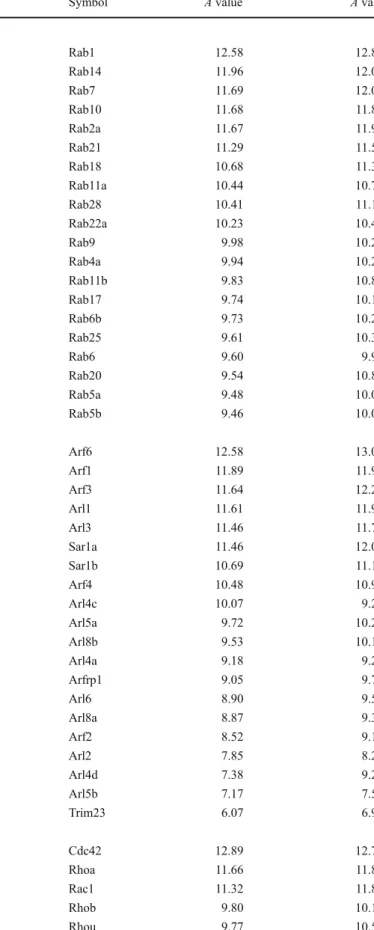
Small GTP-binding proteins
Small GTP-binding proteins are low molecular weight
GTPases (20
–25 kDa) that control a variety of cellular
processes including vesicle transport, cytoskeleton
dynam-ics, cell division, and immune response. All small GTPases
can be divided in five subfamilies, namely the Rab
subfamily, the ADP-ribosylating factor (Arf) subfamily,
the Rho/Rac/Cdc42 subfamily, the Ras/Ral/Rap subfamily,
and the Ran GTPase. More than 50 members of the Rab
subfamily were found to be expressed at significant levels
(Table
9
and Supplemental Table
4
). The members of this
family are implicated in the transport, docking, and fusion
of endocytotic vesicles. Van de Graaf et al. have shown that
Rab11a is required for the intracellular trafficking of
TRPV5 and TRPV6 calcium channels to the cell surface
[
40
]. Curtis and Gluck have demonstrated that Rab11 and
Rab20 are mainly expressed in V-ATPase expressing
intercalated cells of the collecting duct, whereas principal
cells of the collecting duct and of the distal nephron are
enriched in Rab18 and Rab5a [
41
]. Several evidences
indicate that Rab(s) could be involved in trafficking of
CFTR, ENaC, and aqp-2 [
42
]. However, functional role of
many highly abundant Rab(s) in DCT/CNT and CCD
remains unknown. Arfs are participating in the formation of
coated transport vesicles. El-Annan et al. have shown
abundant expression of Arf1 and Arf6 in the distal nephron
and the collecting duct and have demonstrated that Arf1 is
mostly localized to the apical membrane whereas Arf6
appeared to be mainly expressed at the basolateral
membrane [
43
]. Arf6 was further demonstrated as a factor
promoting Avpr2 recycling [
44
]. Our data confirm high
expression levels of Arf1 and Arf6 and reveal abundant
expression of several Arfs (Arf3, Arl1, Arl3, etc., see
Table
9
) with yet unassigned function in the renal tubule.
As shown in Table
9
, both the DCT/CNT and the CCD also
exhibit high expression levels of several Rho GTPases,
including Cdc42, RhoA, and Rac1. The main function of
Rho GTPases consists in the control of cytoskeleton
dynamics and assembly. Thus, it was logically proposed
that Rho(s) could be involved in trafficking of aqp-2, a
process which requires remodeling of microtubules and
filaments. However, evidence that support this hypothesis
remains limited to a few in vitro studies [
45
,
46
]. Members
of Ras subfamily share the highest degree of homology
with Ras, one of the most frequently mutated oncogenes in
cancer. Ras, Ral, and Rap have been shown to play an
important role in cellular proliferation and differentiation by
influencing a number of intracellular signaling pathways.
Ras GTPases have been also shown to influence activity or
expression of several important DCT/CNT and/or CCD
transporters, including NCC (H-ras), H,K-ATPase (Rap1),
ENaC (K-ras), and aqp-2 (Rap1) [
47
–
50
]. As shown in
Table
9
, H-ras, K-ras, and Rap1 are present within the ten
most abundant members of the Ras subfamily. However,
the role of several other highly abundant Ras GTPases,
including the most abundant Rragd, remains unknown.
SNAREs and SNARE-related proteins
SNARE proteins participate in the trafficking of renal
transporters by mediating fusion of intracellular vesicles to
the target membranes. Molecular composition of SNARE
complexes has been extensively studied for aquaporins
Table 5 (continued)
Gene name Gene DCT/CNT CCD
Symbol A value A value Endothelial-specific receptor tyrosine kinase Tek 8.85 9.32 Fibroblast growth factor receptor 1 Fgfr1 8.82 8.93
Eph receptor B4 Ephb4 8.63 8.87
Receptor-like tyrosine kinase Ryk 8.21 8.45
Eph receptor A1 Epha1 7.37 7.72
Eph receptor B2 Ephb2 7.14 7.07
Fibroblast growth factor receptor 3 Fgfr3 7.04 7.03 Epidermal growth factor receptor Egfr 7.01 8.54 Tyrosine kinase with immunoglobulin-like and EGF-like domains 1 Tie1 6.91 6.73
Eph receptor B3 Ephb3 6.63 6.11
c-Abl oncogene 1, receptor tyrosine kinase Abl1 6.62 7.24 AXL receptor tyrosine kinase Axl 6.23 5.93 Receptor tyrosine kinase-like orphan receptor 1 Ror1 5.84 6.21
Eph receptor A4 Epha4 5.74a 6.31
Table 6 Protein phosphatases
Gene name Gene DCT/CNT CCD
Symbol A value A value Serine/threonine phosphatases
Protein phosphatase 2 (formerly 2A), alpha isoform Ppp2r1a 12.51 12.72 Protein phosphatase 1, catalytic subunit, gamma isoform Ppp1cc 11.76 12.14 Protein phosphatase 1, catalytic subunit, beta isoform Ppp1cb 11.35 11.90 Protein phosphatase 1, catalytic subunit, alpha isoform Ppp1ca 11.17 11.79 Protein phosphatase 1B, magnesium dependent, beta isoform Ppm1b 11.15 11.49 Protein phosphatase 1H (PP2C domain containing) Ppm1h 10.87 11.35 Protein phosphatase 2, alpha isoform Ppp2r5a 10.85 11.19 Protein phosphatase 2 (formerly 2A), catalytic subunit, alpha Ppp2ca 10.68 10.96 PTC7 protein phosphatase homolog (S. cerevisiae) Pptc7 10.37 10.32 Protein phosphatase 1A, magnesium dependent, alpha isoform Ppm1a 10.20 10.66 Protein phosphatase 1K (PP2C domain containing) Ppm1k 10.13 10.67 Protein phosphatase 2, epsilon isoform Ppp2r5e 9.82 10.29 Protein phosphatase 2 (formerly 2A), alpha isoform Ppp2r2a 9.80 10.36 Protein phosphatase 2, gamma isoform Ppp2r5c 9.55 10.18 Protein phosphatase 6, catalytic subunit Ppp6c 9.55 9.76 Protein phosphatase 2, regulatory subunit B, delta isoform Ppp2r2d 9.44 9.41 Protein phosphatase 3, catalytic subunit, alpha isoform Ppp3ca 9.41 9.52 Protein phosphatase 1G, magnesium dependent, gamma isoform Ppm1g 9.37 10.02 Protein phosphatase 2 (formerly 2A), beta isoform Ppp2r1b 9.25 9.58 Protein phosphatase 5, catalytic subunit Ppp5c 9.19 9.30 Tyrosine phosphatases
Acid phosphatase 1, soluble Acp1 12.20 12.28 Protein tyrosine phosphatase 4a2 Ptp4a2 11.67 12.30 Protein tyrosine phosphatase, receptor type, F Ptprf 10.74 11.32 Protein tyrosine phosphatase, receptor type, J Ptprj 10.60 11.51 Protein tyrosine phosphatase, non-receptor type 11 Ptpn11 10.44 10.73 Protein tyrosine phosphatase, receptor type, S Ptprs 10.26 10.29 Protein tyrosine phosphatase, non-receptor type 1 Ptpn1 9.40 9.53 Protein tyrosine phosphatase, non-receptor type 2 Ptpn2 9.26 9.67 Protein tyrosine phosphatase, receptor type, K Ptprk 9.11 9.22 Protein tyrosine phosphatase, receptor type, A Ptpra 8.96 9.64 Protein tyrosine phosphatase, non-receptor type 9 Ptpn9 8.95 9.38 Protein tyrosine phosphatase, mitochondrial 1 Ptpmt1 8.88 8.98 Protein tyrosine phosphatase, non-receptor type 13 Ptpn13 8.83 9.61 Protein tyrosine phosphatase, non-receptor type 14 Ptpn14 8.75 9.59 Similar to protein tyrosine phosphatase, receptor type, G Ptprg 8.53 7.55 Protein tyrosine phosphatase, receptor type, D Ptprd 8.48 8.11 Protein tyrosine phosphatase, receptor type, C Ptprc 8.36 8.46 Protein tyrosine phosphatase, receptor type, M Ptprm 8.36 8.97 Protein tyrosine phosphatase, non-receptor type 21 Ptpn21 8.13 8.83 Protein tyrosine phosphatase, receptor type, G Ptprg 7.91 8.01 Dual-specificity phosphatases
Dual specificity phosphatase 1 Dusp1 11.46 11.73 Dual specificity phosphatase 3 Dusp3 10.47 10.92 Slingshot homolog 1 (Drosophila) Ssh1 9.19 9.73 Dual specificity phosphatase 16 Dusp16 8.91 9.64 CDC14 cell division cycle 14 homolog A (S. cerevisiae) Cdc14a 8.68 9.04
involved in renal urine concentration mechanism. Mistry et
al. have shown that aqp-2 sorting to the apical membrane
requires snapin (SNAPAP), SNAP23, and syntaxin-3,
whereas syntaxin-4 is preferentially involved in cell surface
expression of aqp-3 [
51
]. SNAP23/syntaxin-1a complex
has been also proposed to regulate cell surface expression
of ENaC. However, in our data, expression levels of
syntaxin-1a are low (A values of 4.7 and 5.0 in the DCT/
CNT and the CCD, respectively). Accordingly, only a low
signal intensity for syntaxin-1a was detected in the IMCD
hybridization data [
11
]. As shown in Table
10
and
Supplemental Table
5
, both the DCT/CNT and the CCD
exhibit high expression of SNAPAP, SNAP23, syntaxin-3,
and syntaxin-4. High expression levels were also detected
for vesicle-associated membrane proteins (VAMP) 2, 8, and
3. VAMP2 and VAMP3 proteins were previously identified
in aqp-2-containing intracellular vesicles, indicating their
involvement in aqp-2 trafficking [
52
]. Recently, Wang et al.
have shown that mice devoid of VAMP8 gene exhibit a
diabetes-insipidus-like phenotype and a significantly
re-duced membrane expression of aqp-2 in collecting duct
cells [
53
].
Clathrin, clathrin adaptors, and dynamin-like GTPases
Clathrin-coated vesicles are major protein carriers in protein
endocytotic pathways. Clathrin-coated vesicles mediate
endocytosis of many essential DCT/CNT and/or CCD
Gene name Gene DCT/CNT CCD
Symbol A value A value A kinase (PRKA) anchor protein 2 Akap2 11.85 11.85 A kinase (PRKA) anchor protein (yotiao) 9 Akap9 10.32 10.55 A kinase (PRKA) anchor protein 8 Akap8 9.41 9.93 A kinase (PRKA) anchor protein 11 Akap11 8.42 8.69 A kinase (PRKA) anchor protein 1 Akap1 8.26 8.75 A kinase (PRKA) anchor protein 13 Akap13 7.76 8.55 A kinase (PRKA) anchor protein (gravin) 12 Akap12 7.42 7.39 A kinase (PRKA) anchor protein 10 Akap10 7.20 6.94 A kinase (PRKA) anchor protein 8-like Akap8l 7.11 8.33 A kinase (PRKA) anchor protein 7 Akap7 6.92 8.25 A kinase (PRKA) anchor protein 3 Akap3 6.66 6.45 A kinase (PRKA) anchor protein 6 Akap6 5.99 5.23a A kinase (PRKA) anchor protein 14 Akap14 5.97 5.79a Table 7 A kinase anchor
proteins
a
The A value is below the cutoff level
Table 6 (continued)
Gene name Gene DCT/CNT CCD
Symbol A value A value Dual specificity phosphatase 19 Dusp19 8.40 9.32 Dual specificity phosphatase 22 Dusp22 8.02 8.08 Dual specificity phosphatase 6 Dusp6 7.69 7.86 Dual specificity phosphatase 7 Dusp7 7.49 8.11 CDC14 cell division cycle 14 homolog B (S. cerevisiae) Cdc14b 7.41 8.17 Dual specificity phosphatase 23 Dusp23 7.40 7.18 Dual specificity phosphatase 26 (putative) Dusp26 7.30 6.08 Dual specificity phosphatase 12 Dusp12 7.28 7.84 Slingshot homolog 2 (Drosophila) Ssh2 7.06 7.57 Dual specificity phosphatase 28 Dusp28 7.04 7.04 Dual specificity phosphatase 18 Dusp18 6.92 6.69 Slingshot homolog 2 (Drosophila) Ssh2 6.58 7.73 Dual specificity phosphatase 8 Dusp8 6.41 6.54 Slingshot homolog 3 (Drosophila) Ssh3 6.39 6.72 Dual specificity phosphatase 4 Dusp4 6.28 5.61a aThe A value is below the cutoff level
transporting proteins including ROMK, Na,K-ATPase,
ENaC, aqp-2, and Trpv5 [
54
–
58
]. As shown in Table
11
,
both the DCT/CNT and the CCD exhibit high expression
levels of clathrin light and heavy chains (Clta, Cltb, and
Cltc, respectively) as well as several clathrin adaptor
subunits (Ap1s3, Ap2s1, and Ap3s1). Similar to the IMCD
[
11
], our data show a high abundance of Picalm, a clathrin
adaptor which was recently shown to direct VAMP2
trafficking during endocytosis [
59
]. Dynamins are high
molecular weight GTPases (~100 kDa) that mediate the
fission of clathrin-coated vesicles from the membrane. As
shown in Table
11
, both transcriptomes reveal a high
expression of dynamin 2 (Dnm2) and dynamin 1-like
(Dnm1l) and low expression of dynamins 1 and 3 (Dnm1
and Dnm3, respectively). Interestingly, this distribution of
dynamins differs significantly from that of IMCD in which
only dynamin-like GTPases Mx1 and Mx2 demonstrated
high signal intensities [
11
]. In the DCT/CNT and the CCD
transcriptomes, both Mx1 and Mx2 exhibit low expression
levels (Mx1: A values of 4.3 and 3.8 in DCT/CNT and
CCD, respectively; Mx2: A values of 3.5 and 3.0 in DCT/
CNT and CCD, respectively).
Cytoskeletal proteins and cytoskeletal regulators
Cytoskeletal proteins mediate a wide variety of essential
renal functions. During fetal kidney development, the
assembly and contraction of microtubules and
microfila-ments have been proposed as part of a mechanism that
drives branching morphogenesis of the ureteric bud [
60
]. In
the adult kidney, cytoskeleton remodeling has been shown
to influence cell surface expression and/or activity of a
number of proteins involved in maintaining balance of
water and electrolytes, including ENaC, aqp-2,
Na,K-ATPase, secretory K channels, and chloride channels [
61
–
65
]. A significant number of cytoskeletal proteins have
been recently identified by a proteomic approach in the
aqp-2-containing vesicles in the IMCD [
52
]. As shown in
Table
12
and Supplemental Table
6
, ~300 different
tran-scripts encoding cytoskeletal and cytoskeletal-related
pro-teins are present in our data. The overall distribution and
abundance of cytoskeletal transcripts in the DCT/CNT and
the CCD are largely similar to that identified in the IMCD.
However, for several major transcripts, a significant
difference was observed. For instance, moesin, an
actin-binding protein which has been shown to modulate activity
of aqp-2, Na,K-ATPase, and CFTR in different models of
epithelial cells, was undetectable in IMCD transcriptome
[
11
,
66
–
68
]. In our study, moesin is abundantly present in
both the DCT/CNT and the CCD (see subcategory actin
and actin-binding proteins, Table
12
). Also, our data reveal
high expression of myosin VI (Myo6), a myosin which has
been shown as a prerequisite for the clathrin-dependent
endocytosis of CFTR in the intestine [
69
] (see subcategory
myosin and myosin-like proteins, Table
12
). The role of
Myo6 in the kidney has not yet been investigated. In
subcategory microtubule and microtubule-related proteins
(Table
12
), we found strong expression of tubulins 1b and
1a (Tuba1b and Tuba1a), two tubulins that were not
detected in the IMCD. Again, despite a high abundance of
Gene name Gene DCT/CNT CCD
Symbol A value A value Phospholipase C, gamma 1 Plcg1 10.39 10.38 Lysophospholipase 1 Lypla1 9.73 9.63 Patatin-like phospholipase domain containing 2 Pnpla2 8.97 9.60 Sec23 interacting protein Sec23ip 8.65 9.10 Lysophospholipase-like 1 Lyplal1 8.55 9.04 DDHD domain containing 2 Ddhd2 8.54 9.49 Phospholipase D family, member 3 Pld3 8.44 8.82 Lysophospholipase 2 Lypla2 8.41 7.38 Phospholipase A2, group IVA (cytosolic, calcium-dependent) Pla2g4a 8.26 9.35 Phospholipase C, delta 3 Plcd3 8.18 9.23 Preimplantation protein 4 Prei4 7.89 8.17 Phospholipase A2, group XV Pla2g15 7.62 8.25 Phospholipase C, delta 4 Plcd4 7.04 6.68 DDHD domain containing 1 Ddhd1 6.87 7.65 Phospholipase A2, group VI Pla2g6 6.77 6.30
Phospholipase D2 Pld2 6.67 7.04
Phospholipase C, beta 1 Plcb1 6.25 6.00 Phospholipase C, delta 1 Plcd1 6.25 7.15 Table 8 Phospholipases
Table 9 Small GTPases
Gene name Gene DCT/CNT CCD
Symbol A value A value Rab small GTP-binding proteins
RAB1, member RAS oncogene family Rab1 12.58 12.82 RAB14, member RAS oncogene family Rab14 11.96 12.08 RAB7, member RAS oncogene family Rab7 11.69 12.07 RAB10, member RAS oncogene family Rab10 11.68 11.85 RAB2A, member RAS oncogene family Rab2a 11.67 11.90 RAB21, member RAS oncogene family Rab21 11.29 11.53 RAB18, member RAS oncogene family Rab18 10.68 11.30 RAB11a, member RAS oncogene family Rab11a 10.44 10.77 RAB28, member RAS oncogene family Rab28 10.41 11.10 RAB22A, member RAS oncogene family Rab22a 10.23 10.42 RAB9, member RAS oncogene family Rab9 9.98 10.24 RAB4A, member RAS oncogene family Rab4a 9.94 10.23 RAB11B, member RAS oncogene family Rab11b 9.83 10.88 RAB17, member RAS oncogene family Rab17 9.74 10.19 RAB6B, member RAS oncogene family Rab6b 9.73 10.27 RAB25, member RAS oncogene family Rab25 9.61 10.31 RAB6, member RAS oncogene family Rab6 9.60 9.96 RAB20, member RAS oncogene family Rab20 9.54 10.82 RAB5A, member RAS oncogene family Rab5a 9.48 10.06 RAB5B, member RAS oncogene family Rab5b 9.46 10.01 Arf small GTP-binding proteins
ADP-ribosylation factor 6 Arf6 12.58 13.00 ADP-ribosylation factor 1 Arf1 11.89 11.93 ADP-ribosylation factor 3 Arf3 11.64 12.25 ADP-ribosylation factor-like 1 Arl1 11.61 11.94 ADP-ribosylation factor-like 3 Arl3 11.46 11.73 SAR1 gene homolog A (S. cerevisiae) Sar1a 11.46 12.09 SAR1 gene homolog B (S. cerevisiae) Sar1b 10.69 11.12 ADP-ribosylation factor 4 Arf4 10.48 10.99 ADP-ribosylation factor-like 4C Arl4c 10.07 9.25 ADP-ribosylation factor-like 5A Arl5a 9.72 10.22 ADP-ribosylation factor-like 8B Arl8b 9.53 10.18 ADP-ribosylation factor-like 4A Arl4a 9.18 9.27 ADP-ribosylation factor related protein 1 Arfrp1 9.05 9.73 ADP-ribosylation factor-like 6 Arl6 8.90 9.54 ADP-ribosylation factor-like 8A Arl8a 8.87 9.33
ADP-ribosylation factor 2 Arf2 8.52 9.15
ADP-ribosylation factor-like 2 Arl2 7.85 8.20 ADP-ribosylation factor-like 4D Arl4d 7.38 9.24 ADP-ribosylation factor-like 5B Arl5b 7.17 7.52 Tripartite motif-containing 23 Trim23 6.07 6.90 Rho small GTP-binding proteins
Cell division cycle 42 homolog (S. cerevisiae) Cdc42 12.89 12.74 Ras homolog gene family, member A Rhoa 11.66 11.84 RAS-related C3 botulinum substrate 1 Rac1 11.32 11.81 Ras homolog gene family, member B Rhob 9.80 10.14 Ras homolog gene family, member U Rhou 9.77 10.58
these transcripts, their role in the kidney remains unknown.
Finally, in subcategory intermediate filaments and related
proteins (Table
12
), we detected several keratins not present
in the IMCD transcriptome (Krt10, Krt80, Krt23, and
Krt34).
Transporters and channels
As shown in Table
13
and Supplemental Table
7
, more than
250 transcripts encoding water/solute-transporting proteins
are expressed at significant levels in the DCT/CNT and/or
the CCD, confirming the variety of solutes transported
across the epithelium of these segments. In subcategory
water channels (Table
13
), aquaporins are abundantly
represented by plasma membrane expressed aquaporins 2,
3, and 4, as well as by the intracellular aquaporins 6 and 11.
As expected, expression of aquaporins 2 and 4 is
significantly lower in the DCT/CNT than in the CCD,
whereas aquaporin-3 is equally represented in both
tran-scriptomes. Surprisingly, our analysis also revealed a low,
but significant, expression of aquaporin 1, a channel which
is present, according to immunohistochemical analyses,
only in the proximal tubule and descending thin limb.
Interestingly, the aquaporin 1 RNA has also been detected
Table 9 (continued)
Gene name Gene DCT/CNT CCD
Symbol A value A value Ras homolog gene family, member Q Rhoq 8.74 9.34
Rho family GTPase 3 Rnd3 8.16 9.13
Ras homolog gene family, member T2 Rhot2 8.06 8.88 Ras homolog gene family, member T1 Rhot1 8.05 8.84 Rho-related BTB domain containing 1 Rhobtb1 7.44 8.02 Rho-related BTB domain containing 2 Rhobtb2 7.39 7.54 Ras homolog gene family, member C Rhoc 7.35 8.05
Rho family GTPase 2 Rnd2 7.18 7.67
Ras homolog gene family, member D Rhod 6.74 7.87 Ras homolog gene family, member J Rhoj 6.70 6.50 Rho-related BTB domain containing 3 Rhobtb3 6.63 7.56 Ras homolog gene family, member G Rhog 5.83 6.67 RAS-related C3 Botulinum substrate 3 Rac3 5.71a 6.03
Ras and Ras-related small GTP-binding proteins
Ras-related GTP binding D Rragd 12.40 12.60
RAS-related protein 1b Rap1b 10.75 11.28
RAS-related protein-1a Rap1a 10.33 10.80
v-Ki-ras2 Kirsten rat sarcoma viral oncogene homolog K-ras 10.32 10.57 RAN, member RAS oncogene family Ran 9.81 10.39 V-ral simian leukemia viral oncogene homolog A (ras-related) Rala 9.34 9.79 Harvey rat sarcoma virus oncogene 1 Hras1 9.18 9.21
Ras-related GTP binding C Rragc 9.14 9.67
v-ral simian leukemia viral oncogene homolog B (ras-related) Ralb 9.08 10.30
Neuroblastoma ras oncogene Nras 9.02 9.38
NFKB inhibitor interacting Ras-like protein 1 Nkiras1 8.78 9.10
Ras-related GTP binding A Rraga 8.50 8.68
RAS-related protein 2a Rap2a 8.24 8.82
RAP2B, member of RAS oncogene family Rap2b 8.20 9.23 Harvey rat sarcoma oncogene, subgroup R Rras 8.04 8.51
Ras-like without CAAX 1 Rit1 7.79 8.31
RAS-like, family 11, member B Rasl11b 7.73 9.02
Muscle and microspikes RAS Mras 7.64 7.79
NFKB inhibitor interacting Ras-like protein 2 Nkiras2 7.60 7.79 RAS, dexamethasone-induced 1 Rasd1 7.40 7.76
Gene name Gene DCT/CNT CCD Symbol A value A value Vesicle-associated membrane protein 2 Vamp2 11.74 11.38 Vesicle-associated membrane protein 8 Vamp8 11.66 12.03 Synaptosomal-associated protein 23 Snap23 11.50 11.72 Synaptosomal-associated protein, 47 Snap47 11.19 11.51 Vesicle transport through interaction with t-SNAREs 1B homolog Vti1b 10.68 10.94
Syntaxin 7 Stx7 10.64 11.30
Vesicle-associated membrane protein 3 Vamp3 10.55 10.89
Syntaxin 8 Stx8 10.40 11.16
SNAP-associated protein Snapap 10.18 10.61 YKT6 homolog (S. cerevisiae) Ykt6 9.73 10.37
Syntaxin 3 Stx3 9.60 10.30
Syntaxin 4A (placental) Stx4a 9.49 9.99
Syntaxin 12 Stx12 9.47 10.30
Blocked early in transport 1 homolog (S. cerevisiae)-like Bet1l 9.38 9.35 Golgi SNAP receptor complex member 1 Gosr1 9.37 9.75 SEC22 vesicle trafficking protein homolog B (S. cerevisiae) Sec22b 9.35 9.73
Syntaxin 16 Stx16 9.04 9.23
Blocked early in transport 1 homolog (S. cerevisiae) Bet1 9.02 9.64 Golgi SNAP receptor complex member 2 Gosr2 8.85 8.65 Vesicle-associated membrane protein 4 Vamp4 8.63 8.80 Table 10 SNAREs
Gene name Gene DCT/CNT CCD
Symbol A value A value Clathrin and clathrin adaptors
Clathrin, light polypeptide (Lca) Clta 12.71 12.90 Synaptophysin-like protein Sypl 11.60 12.02 Clathrin, light polypeptide (Lcb) Cltb 10.56 10.87 Clathrin, heavy polypeptide (Hc) Cltc 10.38 10.96 Phosphatidylinositol binding clathrin assembly protein Picalm 10.16 10.89 Adaptor-related protein complex AP-1, sigma 3 Ap1s3 9.49 10.48 Adaptor-related protein complex 2, sigma 1 subunit Ap2s1 9.07 10.26 Adaptor-related protein complex 3, sigma 1 subunit Ap3s1 9.04 9.48
Epsin 2 Epn2 8.41 9.24
Adaptor protein complex AP-1, sigma 1 Ap1s1 8.19 8.50 Adaptor-related protein complex AP-4, sigma 1 Ap4s1 7.82 8.06 Adaptor-related protein complex 3, sigma 2 subunit Ap3s2 7.80 8.59
Epsin 1 Epn1 7.47 7.11
Adaptor-related protein complex 1, sigma 2 subunit Ap1s2 6.62 6.15
Epsin 3 Epn3 6.19 6.81
Synaptosomal-associated protein 91 Snap91 6.14 5.14a
Dynamin-like GTPases
Dynamin 2 Dnm2 10.71 11.22
Dynamin 1-like Dnm1l 10.18 10.8
Dynamin 1 Dnm1 5.98 5.82
Dynamin 3 Dnm3 5.79a 7.39
Table 11 Vesicle coat proteins
a
The A value is below the cutoff level
Table 12 Cytoskeleton and cytoskeleton-related proteins
Gene name Gene DCT/CNT CCD
Symbol A value A value Actin and actin-binding proteins
Actin, beta Actb 13.35 13.80
Cofilin 1, nonmuscle Cfl1 12.96 12.98
Actin, gamma, cytoplasmic 1 Actg1 12.93 13.06 Catenin (cadherin-associated protein), beta 1 Ctnnb1 12.74 13.26
Syndecan 4 Sdc4 12.61 12.99
Catenin (cadherin-associated protein), alpha 1 Ctnna1 12.59 13.02
Tropomyosin 1, alpha Tpm1 12.30 12.87
Wiskott-Aldrich syndrome-like (human) Wasl 11.90 12.81
Spectrin beta 2 Spnb2 11.76 12.23
LIM and SH3 protein 1 Lasp1 11.67 11.83
Cingulin-like 1 Cgnl1 11.56 12.13
ARP2 actin-related protein 2 homolog (yeast) Actr2 11.49 12.01
Tensin 1 Tns1 11.47 11.85
Gelsolin Gsn 11.37 12.06
Cortactin Cttn 11.33 12.17
Cysteine and glycine-rich protein 1 Csrp1 11.18 11.75
Cofilin 2, muscle Cfl2 11.13 11.49
Utrophin Utrn 11.12 12.18
Radixin Rdx 11.11 11.24
Tensin 3 Tns3 11.03 11.71
Myosin and myosin-like proteins
Myosin, heavy polypeptide 9, nonmuscle Myh9 12.12 12.56 Myosin, light chain 12B, regulatory Myl12b 11.80 12.55
Myosin X Myo10 10.70 10.60
Myosin IC Myo1c 10.64 10.58
Myosin VI Myo6 10.21 10.93
Myosin, heavy polypeptide 10, nonmuscle Myh10 10.14 11.43
Myosin 1H Myo1h 9.23 10.17
Myosin XVIIIA Myo18a 9.14 9.71
Myosin VB Myo5b 8.56 9.06
Myosin IXb Myo9b 8.52 9.12
Myosin IE Myo1e 8.32 8.95
Myosin, light polypeptide 9, regulatory Myl9 8.26 6.85
Myosin ID Myo1d 7.95 8.73
Myosin IXa Myo9a 7.89 8.72
Myosin VA Myo5a 7.87 7.97
Myosin VC Myo5c 7.64 8.70
Myosin, heavy polypeptide 11, smooth muscle Myh11 7.43 5.61a Myosin, heavy polypeptide 6, cardiac muscle, alpha Myh6 6.85 6.53 Myosin, heavy polypeptide 7, cardiac muscle, beta Myh7 6.84 6.57
Myosin VIIB Myo7b 6.75 6.47
Microtubule and microtubule-related proteins
Tubulin, alpha 4A Tuba4a 13.63 13.51
Tubulin, alpha 1B Tuba1b 12.88 13.17
Tubulin, alpha 1A Tuba1a 12.61 12.89
Tubulin, beta 2A Tubb2a 12.32 12.64
in human DCT, at levels of ~10% of those in the proximal
tubule [
70
]. However, in both human and mouse
tran-scriptomes, the expression levels of aquaporin 1 RNA in
the distal nephron are significantly lower than those of
other water channels. For instance, in mouse DCT/CNT, the
difference between the aquaporin 3 and aquaporin 1 RNA
expression is ~130-fold (13.11 units of A value vs. 6.09
units of A value, respectively, Table
13
).
In subcategory ion channels and transporters excluding
solute carrier protein (SLC; Table
13
), all principal genes
involved in maintaining ion balance are represented (e.g.,
Na,K-ATPase,
αβγENaC (Scnn1), ROMK (Kcnj1), Kir5.1
(Kcnj16), Kir 4.1 (Kcnj10), Clcnkb, Clc3, Trpv5, PMCA2
(ATP2b2), Trpm6, and various H
+-ATPases). Analysis of
the transcripts belonging to this subcategory also revealed a
number of highly abundant transcripts with yet unassigned
function in the kidney. For instance, both the DCT/CNT
and the CCD exhibit high expression levels of Tmem16f, a
functionally uncharacterized paralog of a recently identified
calcium-activated chloride channel Tmem16a [
71
]. Also,
both transcriptomes reveal abundant expression of several
voltage-gated ion channels, including Kcnq1, Kcne1,
Kcnj10, Cacna1d, Cacnab4, Kcnh3, and Cacna2d1.
Impor-tantly, mutations in two voltage-gated potassium channels
Table 12 (continued)
Gene name Gene DCT/CNT CCD
Symbol A value A value Microtubule-associated protein 1 light chain 3 beta Map1lc3b 11.89 12.01 Dynein light chain roadblock-type 1 Dynlrb1 11.87 11.89 Dynein light chain LC8-type 1 Dynll1 11.86 12.45 Dynein light chain LC8-type 1 /// predicted gene, EG627788 Dynll1 11.75 12.50 Gamma-aminobutyric acid receptor-associated protein Gabarap 11.50 11.62 Dynein light chain Tctex-type 3 Dynlt3 11.49 11.85 Dynein light chain LC8-type 2 Dynll2 11.17 11.69
Tubulin, beta 2B Tubb2b 11.03 11.27
Kinesin family member 5B Kif5b 11.00 11.06 Microtubule-associated protein, RP/EB family, member 1 Mapre1 10.77 11.28
Dynactin 6 Dctn6 10.76 11.35
Tubulin folding cofactor B Tbcb 10.62 11.38
Dynactin 4 Dctn4 10.58 11.20
Kinesin family member 13B Kif13b 10.53 10.89 Dynein cytoplasmic 1 intermediate chain 2 Dync1i2 10.36 10.55 Intermediate filaments and related proteins
Keratin 7 Krt7 12.42 12.89 Plakophilin 4 Pkp4 11.75 11.73 Keratin 18 Krt18 11.13 12.45 Keratin 8 Krt8 10.92 11.84 Lamin A Lmna 10.68 10.75 Plastin 3 (T-isoform) Pls3 10.38 11.37 Plakophilin 2 Pkp2 9.51 10.12 Keratin 10 Krt10 9.39 9.68 Keratin 80 Krt80 8.25 8.54 Vimentin Vim 8.17 7.54 Keratin 23 Krt23 7.98 9.95 Lamin B2 Lmnb2 7.07 7.40 Keratin 24 Krt24 6.95 6.00 Lamin B1 Lmnb1 6.95 7.02 Keratin 34 Krt34 6.72 6.52 Keratin 19 Krt19 6.64 7.51 Plakophilin 3 Pkp3 6.36 6.71 Plastin 1 (I-isoform) Pls1 6.10 6.00
Table 13 Transporters and channels
Gene name Gene DCT/CNT CCD
Symbol A value A value Water channels Aquaporin 3 Aqp3 13.11 13.45 Aquaporin 6 Aqp6 11.53 12.84 Aquaporin 4 Aqp4 8.16 11.63 Aquaporin 11 Aqp11 8.11 6.90 Aquaporin 2 Aqp2 7.95 10.25 Aquaporin 5 Aqp5 6.51 6.20 Aquaporin 1 Aqp1 6.09 6.57
Ion channels and transporters excluding SLC proteins
ATPase, Na+/K+ transporting, beta 1 polypeptide Atp1b1 13.86 13.87 Voltage-dependent anion channel 1 Vdac1 13.73 13.74 ATPase, H+ transporting, lysosomal V1 subunit A Atp6v1a 13.11 13.10 ATPase, H+ transporting, lysosomal V0 subunit C Atp6v0c 12.99 12.66 ATPase, H+ transporting, lysosomal V1 subunit D Atp6v1d 12.99 13.17 ATPase, Na+/K+ transporting, alpha 1 polypeptide Atp1a1 12.76 12.12 V-ATPase, H+ transporting, lysosomal V1 subunit E1 Atp6v1e1 12.71 12.61 ATPase, H+ transporting, lysosomal V0 subunit D2 Atp6v0d2 12.58 12.78 Voltage-dependent anion channel 2 Vdac2 12.54 12.63 Potassium inwardly rectifying channel, subfamily J, member 16 Kcnj16 12.44 12.63 Potassium inwardly rectifying channel, subfamily J, member 1 Kcnj1 12.41 12.69 FXYD domain-containing ion transport regulator 2 Fxyd2 12.40 11.11 ATPase, H+ transporting, lysosomal V1 subunit F Atp6v1f 12.25 12.36 ATPase, H+ transporting, lysosomal V0 subunit B Atp6v0b 12.01 11.93 ATPase, H+ transporting, lysosomal V0 subunit E Atp6v0e 11.90 11.97 Sodium channel, non-voltage-gated 1 gamma Scnn1g 11.54 11.88 Potassium voltage-gated channel, subfamily Q, member 1 Kcnq1 11.51 11.68 Potassium voltage-gated channel, Isk-related subfamily, member 1 Kcne1 11.47 11.68 ATPase, Ca++ transporting, cardiac muscle, slow twitch 2 Atp2a2 11.45 11.61
Chloride channel Kb Clcnkb 11.33 11.70
SLC
Solute carrier family 26, member 4 (pendrin) Slc26a4 13.43 13.45 Solute carrier family 25 (mitochondrial carrier, adenine nucleotide translocator), member 5 Slc25a5 12.88 12.94 Solute carrier family 2 (urate transporter), member 9 Slc2a9 12.42 10.74 Solute carrier family 25 (mitochondrial carrier, adenine nucleotide translocator), member 4 Slc25a4 12.42 12.54 Solute carrier family 16 (monocarboxylic acid transporters), member 7 Slc16a7 12.12 11.52 Solute carrier family 2 (facilitated glucose transporter), member 1 (GLUT1) Slc2a1 12.10 12.73 Solute carrier family 12, member 3 (NCC) Slc12a3 10.77 5.28a
Solute carrier family 25 (mitochondrial carrier oxoglutarate carrier) member 11 Slc25a11 10.13 10.66 Solute carrier family 27 (fatty acid transporter), member 1 Slc27a1 10.12 10.46 Solute carrier family 25 (mitochondrial carnitine/acylcarnitine translocase) member 20 Slc25a20 10.07 10.59 Solute carrier family 25 (mitochondrial carrier; phosphate carrier) member 23 Slc25a23 9.76 9.59 Solute carrier family 25 (mitochondrial carrier, Aralar), member 12 Slc25a12 9.48 9.66 Solute carrier family 5 (sodium/glucose cotransporter), Member 2 (SGLT2) Slc5a2 9.48 9.52 Solute carrier family 25 (mitochondrial thiamine pyrophosphate carrier) member 19 Slc25a19 9.48 9.66 Solute carrier family 40 (iron-regulated transporter), member 1 Slc40a1 9.46 9.10 Solute carrier family 2 (facilitated glucose transporter), member 4 (GLUT4) Slc2a4 9.32 8.67 Solute carrier family 25 (mitochondrial carrier ornithine transporter) member 15 Slc25a15 9.25 9.27 Solute carrier family 25, member 36 Slc25a36 9.16 9.84
(Kcnj10 and Kcna1) have been recently shown to cause
electrolyte imbalance in human [
3
,
4
]. To what extent other
voltage-gated channels identified in our study can
partici-pate in the physiology/pathophysiology of distal nephron
and/or collecting duct remains to be established.
In subcategory SLC (Table
13
), the most abundant
transcript is pendrin (Slc26a4), a chloride/bicarbonate
exchanger located at the apical membrane of the CNT and
CCD cells. Also highly abundant is Slc2a9, a recently
identified urate transporter [
72
]. Interestingly, analysis of
the SLC(s) expressed in the DCT/CNT and/or the CCD
revealed the presence of several transcripts whose
expres-sion was previously considered as restricted to the proximal
tubule or to Henle’s loop. For example, a high expression
of the glucose transporter Glut1 (Slc2a1) and the sodium
glucose cotransporter Sglt2 (Slc2a5) and a moderate
expression of the sodium potassium chloride cotransporter
NKCC2 (Slc12a1) and the sodium phosphate cotransporter
NaPi-IIa (Slc34a2) were detected in distal nephron. Glut1
and NKCC2 transcripts were also detected in the IMCD
transcriptome [
11
]. Expression of NaPi-IIa, NKCC2, and
Sglt2 in the DCT has been validated by RT-PCR analysis
(D. Firsov, unpublished observations). The correlation
between transcript and protein expression of these genes
remains unknown. However, this information might be
important for selection of tissue-specific promoters in
transgenic experiments.
Transcription factors
More than 1,000 transcription factors are expressed in
DCT/CNT and/or CCD above median levels (Table
14
and
Supplemental Table
8
). Only a small fraction of them has
been assigned to a specific renal function. For instance,
Homeobox-containing transcriptional factors (Hox) are
largely involved in morphogenesis of different parts of the
Table 13 (continued)
Gene name Gene DCT/CNT CCD
Symbol A value A value Solute carrier family 25, member 30 Slc25a30 9.10 8.66 Solute carrier family 11 (proton-coupled divalent metal ion transporters) member 2 Slc11a2 8.97 9.46
aThe A value is below the cutoff level
Table 14 Transcription factors
Gene name Gene DCT/CNT CCD
Symbol A value A value
Zinc finger protein 526 Zfp526 13.23 13.31
Ring-box 1 Rbx1 13.04 13.19
Pituitary tumor-transforming gene 1 Pttg1 12.79 12.76 Mortality factor 4 like 1 Morf4l1 12.76 13.05 Jun proto-oncogene-related gene d Jund 12.74 12.75
Homeo box D8 Hoxd8 12.66 12.80
Early growth response 1 Egr1 12.64 13.46
TSC22 domain family, member 1 Tsc22d1 12.38 12.51
Homeo box D9 Hoxd9 12.37 12.50
Jun oncogene Jun 12.28 12.83
FBJ osteosarcoma oncogene Fos 12.25 12.85
Nascent polypeptide-associated complex alpha polypeptide Naca 12.17 12.64 Endothelial differentiation-related factor 1 Edf1 12.14 12.37 SUB1 homolog (S. cerevisiae) Sub1 11.81 12.28
Ring finger protein 7 Rnf7 11.67 12.20
Ecotropic viral integration site 1 Evi1 11.64 12.07 Pleomorphic adenoma gene-like 1 Plagl1 11.62 11.83
MPN domain containing Mpnd 11.57 11.89
Peroxisome proliferative-activated receptor, gamma, coactivator 1 alpha Ppargc1a 11.55 11.37
Table 15 Transcripts enriched in DCT/CNT
Gene name Gene Enrichment
Symbol Factor Solute carrier family 12, member 3 Slc12a3 44.74
Homeo box C10 Hoxc10 25.21
Secreted frizzled-related protein 1 Sfrp1 19.67 Secreted frizzled-related protein 1 Sfrp1 15.46
Homeo box A9 Hoxa9 15.33
ATP-binding cassette, subfamily A (ABC1), member 13 Abca13 15.26 Cytochrome P450, family 2, subfamily j, polypeptide 11 Cyp2j11 14.59 Secreted frizzled-related protein 1 Sfrp1 14.56 Solute carrier family 8 (sodium/calcium exchanger), member 1 Slc8a1 13.00
Predicted gene, EG653016 EG653016 12.91
Homeo box D10 Hoxd10 12.76
Sal-like 1 (Drosophila) Sall1 12.62
Solute carrier family 8 (sodium/calcium exchanger), member 1 Slc8a1 12.26 Secreted frizzled-related protein 1 Sfrp1 11.51
Parvalbumin Pvalb 11.49
Homeo box D11 Hoxd11 10.97
Solute carrier family 8 (sodium/calcium exchanger), member 1 Slc8a1 10.96
Urate transporter Glut9 10.58
Sulfatase 2 Sulf2 8.62
Solute carrier family 8 (sodium/calcium exchanger), member 1 Slc8a1 8.59
Homeo box A10 Hoxa10 8.53
Secreted frizzled-related protein 1 Sfrp1 8.23
Expressed sequence AI854703 AI854703 8.06
AE binding protein 1 Aebp1 7.95
Solute carrier family 8 (sodium/calcium exchanger), member 1 Slc8a1 7.72 ATP-binding cassette, subfamily A (ABC1), member 13 Abca13 7.53
Kallikrein 1 Klk1 6.75
Sodium channel, type IV, beta Scn4b 6.66
Kallikrein 1 Klk1 6.65
Kallikrein 1-related peptidase b22 Klk1b22 6.61
Predicted gene, 100038965 100038965 6.30
RIKEN cDNA C130090K23 gene C130090K23Rik 6.25
CD8 antigen, alpha chain Cd8a 6.22
CD8 antigen, alpha chain Cd8a 6.06
Solute carrier family 8 (sodium/calcium exchanger), member 1 Slc8a1 5.98
Urocanase domain containing 1 Uroc1 5.92
Parathyroid hormone 1 receptor Pth1r 5.88
Solute carrier family 8 (sodium/calcium exchanger), member 1 Slc8a1 5.85 Kallikrein 1-related peptidase b27 Klk1b27 5.57
Klotho Kl 5.47
Kininogen 1 Kng1 5.38
Sulfatase 2 Sulf2 5.20
V-set and transmembrane domain containing 2A Vstm2a 4.98 RAB27A, member RAS oncogene family Rab27a 4.97 Neurofilament, light polypeptide Nefl 4.97
Vitamin D receptor Vdr 4.95
Usher syndrome 1C homolog (human) Ush1c 4.92
Table 15 (continued)
Gene name Gene Enrichment
Symbol Factor c-Fos-induced growth factor /// similar to FIGF Figf 4.89
c-Fos-induced growth factor Figf 4.86
Homeo box A9 Hoxa9 4.86
Epidermal growth factor Egf 4.83
Urocanase domain containing 1 Uroc1 4.82
Protein phosphatase 1, regulatory (inhibitor) subunit 1A Ppp1r1a 4.81 Glutaminyl-peptide cyclotransferase (glutaminyl cyclase) Qpct 4.81
Klotho Klq 4.76
Solute carrier family 8 (sodium/calcium exchanger), member 1 Slc8a1 4.69
Vitamin D receptor Vdr 4.68
FXYD domain-containing ion transport regulator 2 Fxyd2 4.52
Secreted phosphoprotein 1 Spp1 4.51
c-Fos-induced growth factor Figf 4.45
Afamin Afm 4.34
Transient receptor potential cation channel subfamily V, member 5 Trpv5 4.32
Homeo box A3 Hoxa3 4.15
Urate transporter Glut9 4.09
Homeo box C9 Hoxc9 4.05
Regulator of G-protein signaling 5 Rgs5 4.00 Lymphocyte antigen 6 complex, locus A Ly6a 3.99
Lipoprotein lipase Lpl 3.97
FXYD domain-containing ion transport regulator 2 Fxyd2 3.96 Solute carrier family 8 (sodium/calcium exchanger), member 1 Slc8a1 3.82 Carbohydrate sulfotransferase 11 Chst11 3.75 Protein disulfide isomerase-like Pdilt 3.74
Uromodulin Umod 3.74
Fatty acid desaturase domain family, member 6 Fads6 3.73 Transient receptor potential cation channel, subfamily M, member 6 Trpm6 3.72
Lipoprotein lipase Lpl 3.65
Regulator of G-protein signaling 5 Rgs5 3.61 RIKEN cDNA 2610018G03 gene 2610018G03Rik 3.57 Fatty acid binding protein 3, muscle and heart Fabp3 3.54 RIKEN cDNA 5033421C21 gene 5033421C21Rik 3.53 Kallikrein 1-related peptidase b16 Klk1b16 3.42
Uromodulin Umod 3.42
Major facilitator superfamily domain containing 4 Mfsd4 3.42
Clusterin Clu 3.40
RAB27A, member RAS oncogene family Rab27a 3.40 Regulator of G-protein signaling 5 Rgs5 3.38 Signal peptide, CUB domain, EGF-like 3 Scube3 3.38 Small nucleolar RNA, C/D box 116 cluster Snord116 3.36 Synaptic vesicle glycoprotein 2 a Sv2a 3.33 Major facilitator superfamily domain containing 4 Mfsd4 3.33
AE binding protein 1 Aebp1 3.32
Tropomyosin 2, beta Tpm2 3.31
Serine/threonine kinase 32B Stk32b 3.30
Kallikrein 1-related peptidase b5 Klk1b5 3.30 Kallikrein 1 /// kallikrein 1-related peptidase b5 Klk1 /// Klk1b5 3.29