ORIGINAL CONTRIBUTION
Evidence of White Matter Changes on Diffusion
Tensor Imaging in Frontotemporal Dementia
Barbara Borroni, MD; Simona Maria Brambati, PhD; Chiara Agosti, MD; Stefano Gipponi, MD; Giuseppe Bellelli, MD; Roberto Gasparotti, MD; Valentina Garibotto, MD; Monica Di Luca, PhD; Paola Scifo, PhD; Daniela Perani, MD; Alessandro Padovani, MD, PhDBackground:Two major clinical variants of frontotem-poral dementia (FTD) have been described: frontal vari-ant (fvFTD) and temporal varivari-ant (tvFTD).
Objective:To analyze white matter (WM) and gray mat-ter (GM) tissue organization in patients with fvFTD and tvFTD by means of diffusion tensor imaging and voxel-based morphometry, and the correlations with neuro-psychological and behavioral variables.
Design and Setting:Frontotemporal dementia clinic– based cohort and structural magnetic resonance imag-ing acquisition for voxel-based morphometry and diffu-sion tensor imaging measurements. Abnormalities were detected by a comparison with healthy control subjects. These variables were also correlated with clinical scores.
Patients:Thirty-six patients (28 with fvFTD and 8 with tvFTD) in early disease stage and 23 healthy controls who underwent standardized clinical and neuropsychologi-cal evaluation and magnetic resonance imaging.
Interventions: Diffusion tensor imaging and voxel-based morphometry.
Main Outcome Measures:Neuroimaging analyses
re-sulted in localized GM atrophy and reductions of white
matter densities; the latter correlated with behavioral scores.
Results:Voxel-based morphometry analysis showed sepa-rate patterns of GM atrophy in the 2 groups. Diffusion tensor imaging showed different WM reduction pat-terns in patients with fvFTD and tvFTD. The fvFTD group showed a selective WM reduction in the superior longi-tudinal fasciculus, interconnecting the frontal and oc-cipital and the temporal and parietal regions. Con-versely, patients with tvFTD were characterized by WM reductions in the inferior longitudinal fasciculus, which affected the connections between anterior temporal and frontal regions. The WM reductions in fvFTD paral-leled both behavioral disturbances measured by Frontal Behavioral Inventory and neuropsychological deficits af-fecting frontal functions.
Conclusions:The fvFTD and tvFTD variants are asso-ciated not only with selective local GM reductions but also with significant WM damage in early disease phase. The different WM patterns contribute to the different clini-cal syndromes in FTD and could be responsible for the further progression of atrophy in the later disease stages.
Arch Neurol. 2007;64:246-251
F
RONTOTEMPORAL DEMENTIA(FTD) is a neurodegenera-tive disorder localized pri-marily in the frontal lobes and in the anterior portions of the temporal lobes.1Although often con-sidered a unitary syndrome, numerous studies have characterized 2 major sentations of FTD, which reflect the pre-dominant sites of abnormality. Progres-sive change in personality and behavior coupled with executive dysfunction has been associated with the frontal variant of FTD (fvFTD), whereas patients with the temporal lobe variant (tvFTD) often dem-onstrate a progressive fluent aphasia or breakdown in semantic knowledge.2
Recently, a few studies have proposed voxel-based morphometry (VBM) as a highly useful method for describing brain
changes in FTD and among FTD sub-types.3Mainly because of the low corre-lation between white matter (WM) T1 sig-nal intensities and integrity, VBM has proved to be inefficient in detecting WM.4 In contrast to this approach based on T1-weighted imaging, diffusion tensor imaging (DTI) provides more subtle information about WM tissue composition,5allowing identification of fiber tracts in vivo.6While DTI has been successfully performed in neu-rodegenerative diseases,7this technique has been applied in only 1 single-case postmor-tem study on FTD, to our knowledge.8
Therefore, the aim of the present study was to use DTI to analyze the WM char-acteristics in fvFTD and tvFTD. We also computed the correlations between WM changes and neuropsychological and be-havioral performance.
Author Affiliations are listed at the end of this article.
METHODS
SUBJECTS
All recruited patients fulfilled international consensus criteria for FTD, with a subsequent subdivision into 2 major clinical subtypes: frontal variant FTD (fvFTD) and temporal variant FTD (tvFTD).2,9All subjects underwent clinical evaluation, routine
laboratory examination, and brain perfusion study with tech-netium Tc 99m bicisate single-photon emission computed tomography.
The diagnostic assessment involved a review of full medi-cal history, a semistructured neurologic examination includ-ing motor impairment assessment by the motor subscale of the Unified Parkinson’s Disease Rating Scale (UPDRS–III), and a neuropsychological evaluation. Two independent and experi-enced reviewers (B.B. and A.P.) made the diagnosis, and only patients who were diagnosed as fulfilling FTD criteria by both reviewers were enrolled.
We examined the different cognitive domains by using a stan-dardized neuropsychological assessment other than the screen-ing test for dementia (Mini-Mental State Examination [MMSE]), such as tests of nonverbal reasoning (Raven Colored Progres-sive Matrices), verbal fluency with phonemic and semantic cues, constructional abilities and visual spatial recall (Rey-Osterrieth Complex Figure Test and Trail-Making Test A), long-term memory for prose (Short Story), verbal short-term memory (Digit Span), executive functions (Trail-Making Test B), auditory lan-guage comprehension (Token Test), and imitation (De Renzi Imi-tation Test).10Instrumental activities of daily living and basic
ac-tivities of daily living were assessed as well. Behavioral and psychiatric disturbances were evaluated by the Neuropsychiat-ric Inventory and Frontal Behavioral Inventory (FBI).11
A group of 23 healthy subjects (9 men and 14 women; mean ± SD age, 65.8 ± 6.6 years) were recruited among pa-tients’ spouses or relatives, studied with magnetic resonance (MR) imaging, and included in the VBM and DTI analyses as normal control subjects. They were interviewed and assessed for neurologic or cognitive dysfunction (MMSE score,⬎27; Clinical Dementia Rating Scale score, 0) and were subject to the same exclusion criteria as the patient groups.
The work was conducted in accordance with local clinical research regulations and conformed to the Helsinki Declara-tion. A signed informed consent was obtained from all sub-jects.
EXCLUSION AND INCLUSION CRITERIA Stringent exclusion criteria were applied as follows: (1) cere-brovascular disorders, hydrocephalus, and intracranial mass, documented by MR imaging; (2) a history of traumatic brain injury or another neurologic disease; (3) significant medical problems such as poorly controlled diabetes mellitus or hy-pertension or cancer within the past 5 years; and (4) major de-pressive disorder, bipolar disorder, schizophrenia, substance use disorder, or mental retardation according to criteria of the
Diagnostic and Statistical Manual of Mental Disorders, Fourth Edition.12
Inclusion criteria were the following: (1) mild cognitive de-cline (MMSE score,ⱖ17) and (2) follow-up for at least 1 year after enrollment and diagnosis confirmed. All included sub-jects were right-handed.
MR IMAGING DATA ACQUISITION
The MR imaging was performed on a 1.5-T imager (Sym-phony; Siemens, Erlangen, Germany).
For VBM analysis, 3-dimensional magnetization–prepared rapid gradient echo T1-weighted images were acquired by means of the following settings: echo time, 3.93 milliseconds; repetition time, 2010 milliseconds; flip angle, 15°, and field of view, 250 mm. This yielded 176 contiguous 1-mm-thick sections.
Diffusion tensor imaging was performed by means of echo-planar imaging at 1.5 T with standard head coil for signal re-ception. The DTI axial sections were obtained with the follow-ing settfollow-ings: matrix, 128⫻128; echo time, 122 milliseconds; repetition time, 6600 milliseconds; flip angle, 15°; field of view, 220 mm; no gap (5-mm thickness); and voxel size, 1.7⫻1.7⫻5 mm. Three acquisitions were averaged. Diffusion weighting was performed along 6 independent directions with a b value of 1000 seconds/mm2. A T2-weighted image with no diffusion
weight-ing was also obtained (b = 0).
IMAGE ANALYSIS
Both preprocessing and statistical analyses were implemented in the SPM2 software package (Wellcome Department of Im-aging Neuroscience, London, England; http://www.fil.ion.ucl .ac.uk/spm) running on Matlab 6.5.1 (MathWorks, Natick, Mass).13Optimized VBM analysis was performed according to
Good and colleagues,14as previously published.7
For DTI, the fractional anisotropy (FA) (an index of the di-rectional selectivity of water diffusion) was determined for each voxel by means of BrainVisa 1.6 software.15The FA is a
quan-titative measure of diffusion anisotropy, intrinsic to the tissue under examination and independent of the orientation of the subject in the magnet.
A customized template was obtained by taking the average of all participants’ T2 (b = 0) images, previously normalized to the echo-planar imaging template within MNI (Montreal Neu-rological Institute) standard stereotactic space.
We calculated the normalization variables that best fit each T2 image with a customized echo-planar imaging template, which were then applied to FA maps and to T2 images.
The T2 normalized images were then segmented into gray matter (GM), WM, and cerebrospinal fluid. A WM binary mask was created from the WM segments obtained in the pre-vious step and applied to each subject’s normalized FA map to include only the voxels belonging to the WM regions in the statistical analysis. The masked normalized FA maps were smoothed with a 10-mm full-width half-maximum kernel. The smoothed WM segments were then statistically tested by means of a general linear model based on gaussian field theory.
The FA differences between groups were assessed by a 2-sample t test statistical design. We accepted a statistical thresh-old of P⬍.05 (familywise error [FWE]).
CORRELATION ANALYSIS OF FA AND NEUROPSYCHOLOGICAL AND
BEHAVIORAL ASSESSMENT
The relationship between FA and neuropsychological and be-havioral assessment scores was further investigated. We used regions of interest positioned on the FA map, which included the superior longitudinal fasciculus as shown in the compari-son between the fvFTD and control groups.
The FA data were correlated with all demographic vari-ables and with the neuropsychological and behavioral tests in-cluded in the standardized assessment by using the Spearman rank correlation analysis and subsequent multiple regression analysis to further analyze the relationship between FA and the different predictors (SPSS 11.5; SPSS Inc, Chicago, Ill).
RESULTS
SUBJECTS
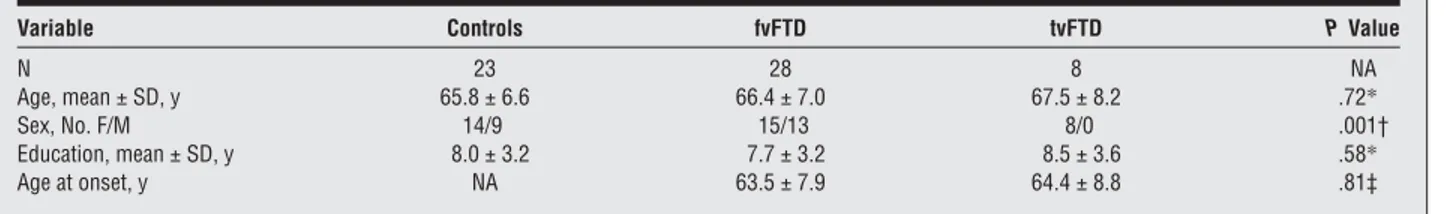
Thirty-six patients with FTD (28 with fvFTD and 8 with tvFTD) entered the study. Demographic and clinical char-acteristics of the fvFTD and tvFTD subgroups and age-matched controls are reported inTable 1. The fvFTD and tvFTD groups did not differ in terms of age, age at onset, or education, but they differed in sex.
Global cognitive decline (MMSE) and functional im-pairment (instrumental activities of daily living and basic activities of daily living) were compared in the 2 sub-groups (Table 2). Table 2 also reports neuropsychologi-cal and behavioral assessment scores in patients with fvFTD and tvFTD. Those with fvFTD mainly showed behavioral disturbances and pathological scores in the Trail-Making Test B, which taps executive functions. The patients with
tvFTD showed pathological performances in Category Flu-ency, Token Test, and Short Story, underlying language deficits; behavioral disturbances were also evident, but the pattern did not differ from that of the fvFTD group.
VBM ANALYSIS
Patients with fvFTD compared with controls showed sig-nificant GM atrophy in the dorsolateral frontal cortex, an-terior cingulate cortex, insula, superior temporal gyrus, and thalamus bilaterally (P⬍.05, FWE corrected). In patients with tvFTD, there was a prevalent GM reduction in the left hemisphere involving the middle and inferior temporal gy-rus and the superior frontal and orbitofrontal gygy-rus; GM was also reduced in the temporal pole and superior temporal gy-rus bilaterally (P⬍.05, FWE corrected).
The VBM analysis did not show any significant WM difference between patients with fvFTD and controls. The
Table 1. Demographic Characteristics in Control Subjects and Patients With FTD
Variable Controls fvFTD tvFTD P Value
N 23 28 8 NA
Age, mean ± SD, y 65.8 ± 6.6 66.4 ± 7.0 67.5 ± 8.2 .72*
Sex, No. F/M 14/9 15/13 8/0 .001†
Education, mean ± SD, y 8.0 ± 3.2 7.7 ± 3.2 8.5 ± 3.6 .58*
Age at onset, y NA 63.5 ± 7.9 64.4 ± 8.8 .81‡
Abbreviations: FTD, frontotemporal dementia; fvFTD, frontal variant of FTD; NA, not applicable; tvFTD, temporal variant of FTD. *One-way analysis of variance.
†2Test among control, fvFTD, and tvFTD groups. ‡Paired t test between fvFTD and tvFTD groups.
Table 2. Clinical and Neuropsychological Characteristics in Patients With FTD
Variable Normative Cutoff Score* Score, Mean ± SD P Value† fvFTD tvFTD MMSE ⬎24 23.0 ± 3.9 22.3 ± 3.7 .21 UPDRS-III 0.0 8.6 ± 8.0 3.5 ± 3.7 .09 IADL (lost) 0.0 1.4 ± 2.1 2.6 ± 2.6 .21 BADL (lost) 0.0 0.4 ± 1.0 0.3 ± 0.7 .62 FBI A 0.0 10.6 ± 7.2 12.1 ± 6.5 .59 FBI B 0.0 7.1 ± 6.5 4.4 ± 3.4 .27 FBI AB 0.0 17.6 ± 12.4 16.5 ± 8.4 .81 NPI, total 0.0 17.4 ± 14.0 12.6 ± 7.1 .36
De Renzi Imitation Test ⬎53.0 67.8 ± 6.7 67.9 ± 3.9 .78
Short Story ⬎7.50 8.6 ± 5.1 4.5 ± 1.7 .05
Raven Colored Progressive Matrices ⬎18.85 22.4 ± 5.4 25.9 ± 4.1 .66
Rey-Osterrieth Complex Figure Test, copy ⬎32.0 25.1 ± 9.8 27.4 ± 11.6 .62
Rey-Osterrieth Complex Figure Test, recall ⬎10.30 12.1 ± 7.2 13.4 ± 4.2 .73
Fluency, phonemic ⬎17.35 23.6 ± 12.0 18.2 ± 9.6 .19 Fluency, semantic ⬎7.50 9.1 ± 3.9 6.2 ± 2.3 .05 Digit Span ⬎3.75 5.5 ± 1.7 5.0 ± 2.3 .54 Token Test ⬎26.50 28.8 ± 5.9 25.7 ± 2.7 .31 Trail-Making Test A, s ⬍94.0 90.9 ± 45.6 94.2 ± 52.0 .56 Trail-Making Test B, s ⬍283.0 298.0 ± 152.4 160.4 ± 83.5 .09
Abbreviations: BADL, basic activities of daily living; FBI, Frontal Behavioral Inventory; FTD, frontotemporal dementia; fvFTD, frontal variant of FTD; IADL, instrumental activities of daily living; MMSE, Mini-Mental State Examination; NPI, Neuropsychiatric Inventory; tvFTD, temporal variant of FTD; UPDRS, Unified Parkinson’s Disease Rating Scale.
*Cutoff scores according to Italian normative data. †Mann-Whitney test.
WM comparison did, however, show a significant dif-ference in the left inferior longitudinal fasciculus in pa-tients with tvFTD (P⬍.05, FWE corrected).
No regions of WM or GM reductions were observed in controls compared with patients with fvFTD or tvFTD at the preestablished threshold (P⬍.05, FWE corrected).
DTI ANALYSIS
The DTI analysis showed significant and extensive FA changes in the right superior longitudinal fasciculus in patients with fvFTD compared with controls (P⬍.05, FWE) (Table 3andFigure 1A). At a lower statistical threshold (P⬍.001, uncorrected) the involvement was bilateral.
Patients with tvFTD showed FA reduction in the in-ferior longitudinal fasciculus and inin-ferior fronto-occipital fasciculus bilaterally, and in the left callosal ra-diations and the left superior longitudinal fasciculus (P⬍.05, FWE) (Table 3 and Figure 1B).16
To rule out WM differences that could be ascribed to sex, we reran the analysis including sex as a nuisance vari-able in the design matrix. The results did not change, even at a lower threshold (P⬍.001, uncorrected).
CORRELATION ANALYSIS OF FA AND NEUROPSYCHOLOGICAL
AND BEHAVIORAL ASSESSMENT
No significant correlation between FA and demo-graphic characteristics was found.
In the fvFTD subgroup, an inverse correlation was found between FA in the superior longitudinal fascicu-lus (mean±SD, 0.93±0.07) and FBI A (r=−0.49, P=.01), FBI B (r = −0.48, P = .01), and FBI AB (r = −0.50, P = .009). The analysis of FBI subitems showed that inflexibility
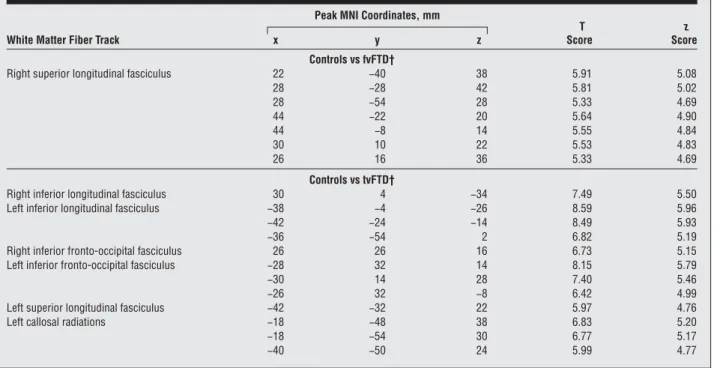
Table 3. Location of Peaks of Regional Reduction of Fractional Anisotropy in Patients With fvFTD and tvFTD Compared With Control Subjects*
White Matter Fiber Track
Peak MNI Coordinates, mm
T Score z Score x y z Controls vs fvFTD†
Right superior longitudinal fasciculus 22 −40 38 5.91 5.08
28 −28 42 5.81 5.02 28 −54 28 5.33 4.69 44 −22 20 5.64 4.90 44 −8 14 5.55 4.84 30 10 22 5.53 4.83 26 16 36 5.33 4.69 Controls vs tvFTD†
Right inferior longitudinal fasciculus 30 4 −34 7.49 5.50
Left inferior longitudinal fasciculus −38 −4 −26 8.59 5.96
−42 −24 −14 8.49 5.93
−36 −54 2 6.82 5.19
Right inferior fronto-occipital fasciculus 26 26 16 6.73 5.15
Left inferior fronto-occipital fasciculus −28 32 14 8.15 5.79
−30 14 28 7.40 5.46
−26 32 −8 6.42 4.99
Left superior longitudinal fasciculus −42 −32 22 5.97 4.76
Left callosal radiations −18 −48 38 6.83 5.20
−18 −54 30 6.77 5.17
−40 −50 24 5.99 4.77
Abbreviations: fvFTD, frontal variant of frontotemporal dementia; MNI, Montreal Neurological Institute; tvFTD, temporal variant of frontotemporal dementia. *P⬍.05, familywise error corrected. The x, y, and z values localize the areas of fractional anisotropy reduction according to the MNI stereotactic coordinates. †Only peaks with the highest significance are reported.
A
B
Figure 1. Reduction in fractional anisotropy in patients with frontal variant (A) and temporal variant (B) of frontotemporal dementia compared with controls, superimposed on 3-dimensional brain templates. A, Right superior longitudinal fasciculus. B, Left inferior longitudinal fasciculus, left superior longitudinal fasciculus, and callosal radiations. The threshold was set at
(r = −0.50, P = .009), personal neglect such as lack of personal hygiene (r=−0.56, P=.003), disorganization in planning and organizing complex activity (r = −0.46,
P = .02), impulsivity or poor judgment (r = −0.45, P=.02), and utilization behavior (r=−0.49, P=.01) were
significantly related to FA reduction; the worse the scores in behavioral disturbances, the lower the FA in the superior longitudinal fasciculus. On the other hand, the other FBI subitems, such as those related to lan-guage disturbances, behavioral disturbances, hoarding, or perseverations, were not significantly correlated with FA reduction. Alien hand, roaming, incontinence, and hyperorality were not considered because they were rare in our sample.
A multiple regression analysis of significantly associ-ated FBI subitems demonstrassoci-ated that all of them were in-dependently related to FA reduction.
The same analysis was made by considering all the neu-ropsychological tests (see those listed in Table 2). Only the Trail-Making Test B scoring was inversely corre-lated with FA in the superior longitudinal fasciculus (Spearman rank correlation analysis, r = −0.41, P = .04). In patients with tvFTD, the correlations between FA in the inferior longitudinal fasciculus and neuropsycho-logical and behavioral variables were not investigated be-cause of the small sample size.
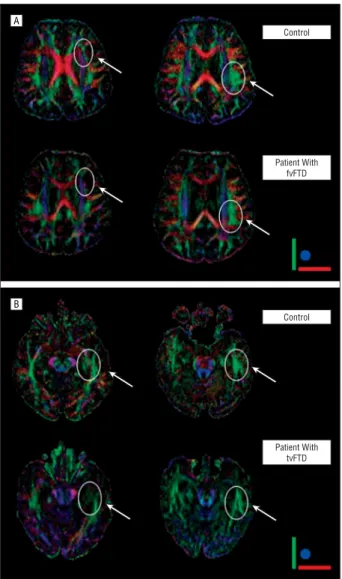
DTI IN SINGLE SUBJECTS
Selective reduction of WM bundles, ie, superior longi-tudinal fasciculus and inferior longilongi-tudinal fasciculus, was illustrated in 2 individual representative patients with fvFTD and tvFTD.
A healthy control subject (60 years old; MMSE score, 30/30; UPDRS-III score, 0), a patient with fvFTD (59 years old; MMSE score, 26/30; UPDRS-III score, 9), and a pa-tient with tvFTD (58 years old; MMSE score, 27/30; UPDRS-III score, 0) were chosen.
Fiber tracking was obtained with the FACT (fiber as-signment by continuous tracking) algorithm imple-mented in BrainVisa software, and red-green-blue maps were reconstructed. According to previously published data,17green was assigned to anteroposterior, red to left-right, and blue to craniocaudal connection (Figure 2).
COMMENT
The rapid development of MR imaging techniques, in par-ticular DTI, has renewed interest and opened new av-enues for analyzing WM in the living human brain.18 Dif-fusion tensor imaging detects microstructural alterations in WM by measuring the directionality of molecular dif-fusion and allows the exploration of the entire brain. Well-organized WM tracts have high FA because diffusion is deeply constrained by the tract’s cellular organization. As WM is damaged, FA decreases because of decreased anisotropic diffusion.
In this study, the combination of DTI with FA and sta-tistical parametric mapping allowed us to gain further in-sight into the organization of microstructural integrity of WM tracts, and into the directionality of molecular dif-fusion in patients with well-defined FTD at the early dis-ease stage. Moreover, VBM data were broadly consistent with those described in previous literature findings.3
We found a significant and extensive WM reduction in the superior longitudinal fasciculus, which intercon-nects dorsolateral frontal lobe and posterior associative areas (occipital, parietal, and temporal) in patients with fvFTD. On the other hand, patients with tvFTD showed different WM reductions that were located bilaterally in the inferior longitudinal fasciculus, interconnecting the anterior temporal lobe and posterior occipital pole in ex-trastriatal cortical regions, and in the inferior fronto-occipital fasciculus, interconnecting the inferolateral and dorsolateral frontal cortices and both the temporal and occipital cortices. In addition, in patients with tvFTD the callosal radiations and the left superior longitudinal fas-ciculus were reduced (see Figure 1). The involvement
A B Control Patient With fvFTD Control Patient With tvFTD
Figure 2. Diffusion tensor imaging red-green-blue maps in a representative control subject and patients with frontal variant and temporal variant of frontotemporal dementia (fvFTD and tvFTD, respectively), illustrating the selective fiber tract changes. A, Red-green-blue maps in a representative control subject (first row) and a patient with fvFTD (second row), highlighting the reduction in the superior longitudinal fasciculus in the latter (arrows). B, Red-green-blue maps in a representative control subject (first row) and a patient with tvFTD (second row), highlighting the reduction in the inferior longitudinal fasciculus in the latter (arrows). Green was assigned to anterior-posterior, red to left-right, and blue to craniocaudal connection.16
of WM bundles is consistent with GM atrophy mea-sured with VBM, affecting mainly the frontal regions in fvFTD and the temporal regions in tvFTD.
These findings support the theory that WM changes are a crucial hallmark in the pathological characteristics of FTD and parallel recent autopsy evidence of tau depo-sition in tauopathies, not only in GM but in WM as well.19 The DTI measures were also very precise in provid-ing a clear-cut description of WM abnormalities and in differentiating patients with fvFTD and tvFTD.
Our results also suggest that WM networks, along with GM involvement, are likely related to the different clini-cal symptoms associated with fvFTD and tvFTD. In fact, the amount of WM reduction in superior longitudinal fas-ciculus correlated with the behavioral deficits, as mea-sured by the FBI, characteristic of these patients. A sig-nificant relationship between FA decrease and a test assessing executive functions, such as Trail-Making Test B, was also demonstrated.
Most studies have focused on frontotemporal lobe abnormalities for differentiating fvFTD and tvFTD, although the possible involvement of more posterior connections has yet to be investigated. The present data indicate an overall impairment of fiber bundles con-necting the frontotemporal to occipital lobes, thus sig-naling a wider WM involvement compared with the more focal frontotemporal GM atrophy. Further studies are needed to support our results in larger samples, in neuropathologically confirmed series, and in different disease stages.
Accepted for Publication: June 28, 2006.
Author Affiliations: Department of Medical Sciences,
Cen-ter for Brain Aging and Neurodegenerative Disorders (Drs Borroni, Agosti, Gipponi, and Padovani), and Neu-roradiology Unit (Dr Gasparotti), University of Brescia, Brescia, Italy; Memory Aging Center, Department of Neu-rology, University of California, San Francisco (Dr Brambati); Vita-Salute San Raffaele University, Mi-lan, Italy (Drs Brambati, Garibotto, and Perani); Scien-tific Institute San Raffaele, Milan (Drs Brambati, Garibotto, Scifo, and Perani); IBFM-CNR, Milan (Drs Brambati, Garibotto, and Perani); “Ancelle della Carità” Hospital, Cremona, Italy (Dr Bellelli); and Department of Phar-macological Sciences and Centre of Excellence of Neu-rodegenerative Disorders, University of Milan, Milan (Dr Di Luca).
Correspondence: Alessandro Padovani, MD, PhD, Clinica
Neurologica, Università degli Studi di Brescia, Pza Spedali Civili, 1-25100 Brescia, Italy ([email protected]).
Author Contributions: Drs Borroni and Brambati
con-tributed equally to this work. Study concept and design: Borroni, Brambati, Perani, and Padovani. Acquisition of
data: Borroni, Agosti, Gipponi, Bellelli, and Gasparotti. Analysis and interpretation of data: Borroni, Garibotto,
Di Luca, Scifo, Perani, and Padovani. Drafting of the
manu-script: Borroni, Brambati, Perani, and Padovani. Critical revision of the manuscript for important intellectual
con-tent: Agosti, Gipponi, Bellelli, Gasparotti, Garibotto,
Di Luca, and Scifo. Statistical analysis: Borroni, Brambati, Garibotto, and Scifo. Obtained funding: Borroni and Padovani. Administrative, technical, and material
sup-port: Agosti and Padovani. Study supervision: Di Luca and
Perani.
Financial Disclosure: None reported.
Acknowledgment: We thank patients and their families
for the time and effort they have dedicated to our re-search. We also thank Rafael Alonso, PhD, for his help-ful comments.
REFERENCES
1. Hodges JR, Davies RR, Xuereb JH, et al. Clinicopathological correlates in fron-totemporal dementia. Ann Neurol. 2004;56:399-406.
2. Neary D, Snowden JS, Gustafson L, et al. Frontotemporal lobar degeneration: a consensus on clinical diagnostic criteria. Neurology. 1998;51:1546-1554. 3. Gorno-Tempini ML, Dronkers NF, Rankin KP, et al. Cognition and anatomy in
three variants of primary progressive aphasia. Ann Neurol. 2004;55:335-346. 4. Whitwell JL, Josephs KA, Rossor MN, et al. Magnetic resonance imaging
sig-natures of tissue pathology in frontotemporal dementia. Arch Neurol. 2005; 62:1402-1408.
5. Buchel C, Raedler T, Sommer M, Sach M, Weiller C, Koch MA. White matter asym-metry in the human brain: a diffusion tensor MRI study. Cereb Cortex. 2004; 14:945-951.
6. Conturo TE, Lori NF, Cull TS, et al. Tracking neuronal fiber pathways in the living human brain. Proc Natl Acad Sci U S A. 1999;96:10 422-10 427.
7. Padovani A, Borroni B, Brambati SM, et al. Diffusion tensor imaging and voxel-based morphometry study in early progressive supranuclear palsy. J Neurol
Neu-rosurg Psychiatry. 2006;77:457-463.
8. Larsson EM, Englund E, Sjobeck M, Latt J, Brockstedt S. MRI with diffusion ten-sor imaging post-mortem at 3.0 T in a patient with frontotemporal dementia.
Dement Geriatr Cogn Disord. 2004;17:316-319.
9. McKhann GM, Albert MS, Grossman M, Miller B, Dickson D, Trojanowski JQ; Work Group on Frontotemporal Dementia and Pick’s Disease. Clinical and patho-logical diagnosis of frontotemporal dementia: report of the Work Group on Frontotemporal Dementia and Pick’s Disease. Arch Neurol. 2001;58: 1803-1809.
10. Lezak MD, Howieson DH, Loring DW. Neuropsychological Assessment. Oxford, England: University Press; 2004.
11. Kertesz A, Nadkarni N, Davidson W, Thomas AW. The Frontal Behavioural In-ventory in the differential diagnosis of frontotemporal dementia. J Int
Neuropsy-chol Soc. 2000;6:460-468.
12. American Psychiatric Association. Diagnostic and Statistical Manual of Mental
Disorders. 4th ed. Washington, DC: American Psychiatric Association; 1994.
13. Friston KJ, Holmes AP, Worsley KJ, Poline JB, Frith CD, Frackowiack RSJ. Statis-tical parametric maps in functional imaging: a general linear approach. Hum Brain
Mapp. 1995;2:189-210.
14. Good CD, Johnsrude IS, Ashburner J, Henson RN, Friston KJ, Frackowiak RS. A voxel-based morphometric study of ageing in 465 normal adult human brains.
Neuroimage. 2001;14:21-36.
15. Cointepas Y, Poupon C, Maroy R, et al. A freely available Anatomist/BrainVisa package for analysis of diffusion MR images. Presented at: the Ninth Interna-tional Conference on FuncInterna-tional Mapping of the Human Brain; June 19, 2003; New York, NY. Available on CD-ROM in NeuroImage. 2003;19(2).
16. Mori S, Wakana S, Nagae-Poetscher LM, van Zijl PCM. MRI Atlas of Human White
Matter. New York, NY: Elsevier Science Inc; 2005.
17. Pajevic S, Pierpaoli C. Color schemes to represent orientation of anisotropic tis-sues from diffusion tensor data: application to white matter fiber tract mapping in the human brain. Magn Reson Med. 1999;42:526-540.
18. Ramnani N, Behrens TE, Penny W, Matthews PM. New approaches for explor-ing anatomical and functional connectivity in the human brain. Biol Psychiatry. 2004;56:613-619.
19. Schofield E, Kersaitis C, Shepherd CE, Kril JJ, Halliday GM. Severity of gliosis in Pick’s disease and frontotemporal lobar degeneration: tau-positive glia differen-tiate these disorders. Brain. 2003;126:827-840.