All-optical electrophysiology in mammalian
neurons using engineered microbial rhodopsins
The MIT Faculty has made this article openly available.
Please share
how this access benefits you. Your story matters.
Citation
Hochbaum, Daniel R; Zhao, Yongxin; Farhi, Samouil L; Klapoetke,
Nathan; Werley, Christopher A; Kapoor, Vikrant; Zou, Peng et
al. “All-Optical Electrophysiology in Mammalian Neurons Using
Engineered Microbial Rhodopsins.” Nature Methods 11, no. 8 (June
2014): 825–833 © 2014 Rights Managed by Nature Publishing Group
As Published
http://dx.doi.org/10.1038/nmeth.3000
Publisher
Nature Publishing Group
Version
Author's final manuscript
Citable link
http://hdl.handle.net/1721.1/109291
Terms of Use
Creative Commons Attribution-Noncommercial-Share Alike
All-optical electrophysiology in mammalian neurons using
engineered microbial rhodopsins
Daniel R. Hochbaum1,16, Yongxin Zhao2,16, Samouil L. Farhi3, Nathan Klapoetke4,5,6,7,
Christopher A. Werley3, Vikrant Kapoor8, Peng Zou3, Joel M. Kralj3, Dougal Maclaurin9, Niklas Smedemark-Margulies3, Jessica L. Saulnier10, Gabriella L. Boulting10, Christoph
Straub10, Yong Ku Cho4,5,6,7, Michael Melkonian11, Gane Ka-Shu Wong12,13,14, D. Jed
Harrison2, Venkatesh N. Murthy8, Bernardo Sabatini10,15, Edward S. Boyden4,5,6,7,17,
Robert E. Campbell2,17, and Adam E. Cohen3,9,15
1Applied Physics Program, School of Engineering and Applied Science, Harvard University,
Cambridge, Massachusetts, USA
2Department of Chemistry, University of Alberta, Edmonton, Alberta, Canada
3Department of Chemistry and Chemical Biology, Harvard University, Cambridge, Massachusetts,
USA
4The MIT Media Laboratory, Massachusetts Institute of Technology (MIT), Cambridge,
Massachusetts, USA
5Department of Biological Engineering, MIT, Cambridge, Massachusetts, USA 6Department of Brain and Cognitive Sciences, MIT, Cambridge, Massachusetts, USA 7McGovern Institute for Brain Research, MIT, Cambridge, Massachusetts, USA
8Department of Molecular and Cellular Biology, Harvard University, Cambridge, Massachusetts,
USA
9Department of Physics, Harvard University, Cambridge, Massachusetts, USA
10Department of Neurobiology, Harvard Medical School, Boston, Massachusetts, USA
Users may view, print, copy, and download text and data-mine the content in such documents, for the purposes of academic research, subject always to the full Conditions of use:http://www.nature.com/authors/editorial_policies/license.html#terms
Correspondence should be addressed to A.E.C. (cohen@chemistry.harvard.edu). 16These authors contributed equally to this work.
17These authors jointly directed this work. Author Contributions
DRH designed the Optopatch construct and system. YZ and DRH engineered the QuasArs. DRH, NK, and YC engineered CheRiff. DRH and SLF acquired the optical electrophysiology data. CAW developed the low-magnification imaging system. VK and JS designed and prepared the slice experiments. DM conceived the sub-frame interpolation algorithm. PZ assisted with measurements of rhodopsin photophysics. JMK screened ion-channel blockers on hiPSC-derived neurons. NSM performed cell culture and sample preparation. GLB performed immunostaining in hiPSC-derived neurons. CS assisted with measurements of ArcLight in slice. MM and GW provided the transcriptomic data from which SdChR was mined and phenotyped. DRH and AEC wrote the paper with input from SLF, YZ and REC. DJH, VM, BS, ESB, and REC supervised aspects of the research. Correspondence regarding directed evolution of Arch should be addressed to REC (robert.e.campbell@ualberta.ca). AEC conceived and oversaw the project.
HHS Public Access
Author manuscript
Nat Methods. Author manuscript; available in PMC 2015 February 01.
Published in final edited form as:
Nat Methods. 2014 August ; 11(8): 825–833. doi:10.1038/nmeth.3000.
Author Manuscript
Author Manuscript
Author Manuscript
11Institute of Botany, Cologne Biocenter, University of Cologne, Cologne, Germany 12Department of Biological Sciences, University of Alberta, Edmonton, Alberta, Canada 13Department of Medicine, University of Alberta, Edmonton, Alberta, Canada
14Beijing Genomics Institute-Shenzhen, China
15Howard Hughes Medical Institute, Harvard University, Cambridge, Massachusetts, USA
Abstract
All-optical electrophysiology—spatially resolved simultaneous optical perturbation and measurement of membrane voltage—would open new vistas in neuroscience research. We evolved two archaerhodopsin-based voltage indicators, QuasAr1 and 2, which show improved brightness and voltage sensitivity, microsecond response times, and produce no photocurrent. We engineered a novel channelrhodopsin actuator, CheRiff, which shows improved light sensitivity and kinetics, and spectral orthogonality to the QuasArs. A co-expression vector, Optopatch, enabled crosstalk-free genetically targeted all-optical electrophysiology. In cultured neurons, we combined Optopatch with patterned optical excitation to probe back-propagating action potentials in dendritic spines, synaptic transmission, sub-cellular microsecond-timescale details of action potential propagation, and simultaneous firing of many neurons in a network. Optopatch measurements revealed homeostatic tuning of intrinsic excitability in human stem cell-derived neurons. In brain slice, Optopatch induced and reported action potentials and subthreshold events, with high signal-to-noise ratios. The Optopatch platform enables high-throughput, spatially resolved electrophysiology without use of conventional electrodes.
Introduction
To disentangle the complex interactions underlying neural dynamics, one would like to visualize membrane voltage across spatial scales, from single dendritic spines to large numbers of interacting neurons, while delivering spatially and temporally precise stimuli1, 2. Optical methods for simultaneous perturbation and measurement of membrane potential could achieve this goal3.
One would further like to target the stimulation and recording to genetically specified cells. Genetic targeting is particularly important in intact tissue where closely spaced cells often perform distinct functions. Genetic targeting is also valuable in vitro, for characterizing heterogeneous cultures that arise during stem cell differentiation to neurons4, or while studying neurons co-cultured with other cell types.
Optical stimulation has been demonstrated with glutamate uncaging5, photoactivated ion channel agonists6, and microbial rhodopsin actuators7. Genetically encoded functional readouts include reporters of intracellular Ca2+ and membrane voltage8. Voltage-sensitive dyes offer good speed, sensitivity, and spectral tuning9, 10, but cannot be delivered to a genetically specified subset of cells and often suffer from phototoxicity.
Optical stimulation has been paired with voltage imaging11–14. However, robust and crosstalk-free genetically targeted all-optical electrophysiology has not been achieved due to
Author Manuscript
Author Manuscript
Author Manuscript
limitations on the speed and sensitivity of genetically encoded voltage indicators (GEVIs), and spectral overlap between existing GEVIs and optogenetic actuators. GFP-based GEVIs experience severe optical crosstalk with even the most red-shifted channelrhodopsins, which retain ∼20% activation with blue light excitation15. There remains a need for sensitive, fast, and spectrally orthogonal tools for genetically targeted simultaneous optical perturbation and measurement of membrane voltage.
Here we introduce variants of a near infrared archaerhodopsin-based voltage indicator and a blue light gated channelrhodopsin actuator which individually show greatly improved performance relative to published optogenetic tools and which together constitute a tool for all-optical electrophysiology. First, we characterize the optical and electrophysiological properties of the indicator, the actuator, and the co-expressed pair (Optopatch) and compare against published tools. Second, we use Optopatch to probe neuronal excitation across spatial and temporal scales: from single dendritic spines to fields containing dozens of neurons measured in parallel, and from microsecond delays associated with action potential propagation to days-long changes in excitability. Third, we apply Optopatch to study excitability in human induced pluripotent stem cell (hiPSC)-derived neurons. These measurements revealed the first evidence for homeostatic plasticity of intrinsic excitability in hiPSC-derived neurons. Fourth, we apply Optopatch in tissue. In organotypic brain slice, Optopatch initiates and reports action potentials and subthreshold dynamics with higher signal-to-noise ratios, better photostability, and better time resolution than ArcLight, a recently introduced GFP-based GEVI16.
Results
Directed evolution of an Arch-based voltage indicator
We previously showed that Archaerhodopsin 3 (Arch) functions as a fast and sensitive voltage indicator17. Arch has the furthest red-shifted spectrum of any GEVI, giving it the unique property of little spectral overlap with channelrhodopsin actuators and GFP-based reporters. Thus it is natural to pair Arch-based indicators with optogenetic actuators for crosstalk-free all-optical electrophysiology.
However, wild-type Arch had some undesirable attributes for a reporter: it was very dim, and the brightness was a nonlinear function of illumination intensity18. Illumination for imaging generated a hyperpolarizing photocurrent, which partially suppressed neural firing. The mutant Arch(D95N) did not pump, but its step response was dominated by a 41 ms time constant, too slow to resolve action potential (AP) waveforms. Other non-pumping mutants improved speed relative to Arch(D95N) but did not reach the speed of wild-type Arch and did not address the low brightness14.
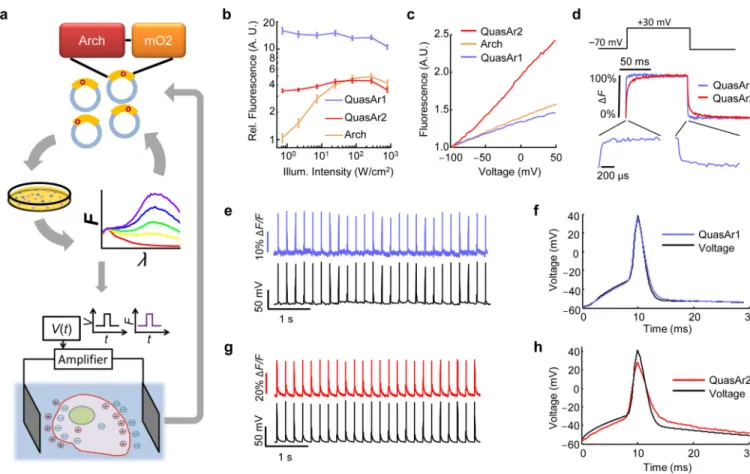
We sought to repair these defects in engineered mutants of Arch. To accommodate the multiple selection criteria, we adopted a hierarchical screen (Fig. 1a). Five rounds of brightness screening in E. coli and random mutagenesis on a library of > 104 Arch mutants resulted in a brighter Arch variant, containing 5 point-mutations (Methods). Further site-directed mutagenesis at known key residues improved voltage sensitivity and speed (Supplementary Fig. 1), while addition of an endoplasmic reticulum export motif and a
Author Manuscript
Author Manuscript
Author Manuscript
trafficking sequence improved trafficking (Methods). The two most promising mutants were named QuasArs (Quality superior to Arch). QuasAr1 comprised mutations P60S, T80S, D95H, D106H, F161V and QuasAr2 comprised QuasAr1(H95Q). Both proteins had fluorescence excitation maxima at 590 nm and emission maxima at 715 nm (Supplementary Fig. 2). The fluorescence quantum yields of solubilized QuasAr1 and 2 were 19- and 10-fold enhanced, respectively, relative to the non-pumping voltage indicator Arch(D95N)
(Supplementary Table 1). All fluorescence microscopy of QuasArs used 640 nm excitation. We compared the fluorescence, voltage sensitivity, and speed of the QuasArs to wild-type Arch in HEK cells, using epifluorescence microscopy and whole-cell patch clamp electrophysiology. Under low intensity illumination (500 mW/cm2), QuasAr1 was 15-fold brighter than wild-type Arch, and QuasAr2 was 3.3-fold brighter (Fig. 1b; Methods). Neither mutant showed the optical nonlinearity seen in the wild-type protein, implying that fluorescence was a 1-photon process with the voltage-sensitive transition occurring from the ground state. At high intensity (> 100 W/cm2) QuasAr1 was 2.5-fold brighter than wild-type Arch, while the brightness of QuasAr2 and of wild-type Arch were comparable.
Fluorescence of Arch, QuasAr1, and QuasAr2 increased nearly linearly with membrane voltage between −100 mV and +50 mV (Fig. 1c, Methods). Sensitivities were (ΔF/F per 100 mV): 32 ± 3% for QuasAr1 (n = 5 cells; all statistics are mean ± s.e.m. unless specified) and 90 ± 2% for QuasAr2 (n = 6 cells). The sensitivity of QuasAr2 is a substantial
improvement over both Arch (40% per 100 mV) and Arch(D95N) (60% per 100 mV). Steps in membrane voltage (−70 mV to +30 mV) induced rapid fluorescence responses in both mutants, which we quantified on a fast photomultiplier (Fig. 1d). At room temperature (23 °C) QuasAr1 had a step response time constant of 0.053 ± 0.002 ms (n = 6 cells), close to the 0.05 ms time resolution of the electronics and substantially faster than the 0.6 ms step response of wild-type Arch18. QuasAr2 had a bi-exponential step response with time constants of 1.2 ± 0.1 ms (68%) and 11.8 ± 1.5 ms (32%) (n = 6 cells). At 34 °C, the apparent speed of QuasAr1 remained at the 0.05 ms resolution of the electronics, and the time constants of QuasAr2 decreased to 0.30 ± 0.05 ms (62%) and 3.2 ± 0.4 ms (38%) (n = 7 cells). Both mutants had similar response times on rising and falling edges (Supplementary Table 2). Neither QuasAr1 nor QuasAr2 generated detectable photocurrent under red light (tested up to 900 W/cm2) or blue light (Supplementary Fig. 3).
We expressed QuasArs in cultured rat hippocampal neurons, evoked APs via current injection from a patch pipette and recorded the fluorescence responses from the soma and proximal dendrites (1 kHz frame rate, Fig. 1e–h, Supplementary Fig. 4). Single APs
produced fluorescence transients with amplitude ΔF/F = 21 ± 2% for QuasAr1 (n = 11 cells) and ΔF/F = 48 ± 3% for QuasAr2 (n = 24 cells). Signal-to-noise ratios (SNRs) for single APs increased with illumination intensity. For QuasAr1, SNR values were 21 ± 2 (300 W/cm2, n = 6 cells) and 32 ± 4 (800 W/cm2, n = 6 cells). For QuasAr2, SNR values were 41 ± 4 (300 W/cm2, n = 12 cells) and 70 ± 8 (800 W/cm2, n = 12 cells). These SNRs
correspond to equivalent electrical noise levels of 3.0 to 4.3 mV (800 to 300 W/cm2) for QuasAr1, or 1.5 to 2.2 mV (800 to 300 W/cm2) for QuasAr2 (Methods).
Author Manuscript
Author Manuscript
Author Manuscript
QuasAr1 did not introduce detectable broadening in the optically recorded AP waveform, acquired at a 2 kHz frame rate (Fig. 1f). At room temperature, QuasAr2 broadened the optically recorded AP by 650 ± 150 µs relative to the simultaneously recorded electrical waveform at 70% maximum depolarization (n = 5 cells; mean ± s.d.) (Fig. 1h). At 34 °C, QuasAr2 broadened the optically recorded AP by 180 ± 120 µs (n = 5 cells; mean ± s.d). Both probes reported AP peak times with < 100 µs jitter relative to simultaneously acquired patch clamp recordings (Methods).
Photostability is a concern with any voltage indicator, so we quantified the stability of QuasArs under continuous illumination at standard imaging intensity (300 W/cm2).
Photobleaching time constants were 440 s for QuasAr1 and 1020 s for QuasAr2. We further tested for red light-induced phototoxicity using QuasAr2 as the readout. Under continuous illumination at 300 W/cm2, QuasAr2 reported APs with 100% fidelity for the 30 min duration of the experiment, with no detectable change in AP width or waveform (Supplementary Fig. 5).
We compared the QuasArs to ArcLight A24216. Photophysical comparisons were performed in HEK cells (Supplementary Table 2), and action potential comparisons were performed in matched neuronal cultures (Methods). ArcLight can be imaged with ∼30-fold lower illumination intensity than is required for the QuasArs, facilitating measurements on readily available microscope systems. However, the QuasArs reported action potentials with 7 to 16-fold larger fractional fluorescence changes, 3 to 8-fold higher SNR, 30 to 1000-fold higher temporal resolution, and 6 to 15-fold greater photostability (Supplementary Fig. 6). The QuasArs represent the fastest and most sensitive GEVIs reported to-date. The 50 µs response time of QuasAr1 is more than 10-fold faster than the fastest previously reported GEVIs18, 19 and is comparable to fast voltage-sensitive dyes. QuasAr1 opens the possibility of accurate mapping of AP waveforms for even the fastest-spiking neurons20. The QuasArs report voltage with greatly improved sensitivity and time resolution compared to the first generation of Arch-based GEVIs, despite requiring ∼5-fold lower illumination intensity17. From a signal-to-noise perspective, QuasAr2 is superior to QuasAr1: the greater voltage sensitivity of QuasAr2 outweighs the greater brightness of QuasAr1. From a temporal resolution perspective, QuasAr1 is superior. We recommend QuasAr2 for spike counting and measurement of sub-threshold events, and QuasAr1 for measurement of microsecond-precision AP waveforms and timing. Furthermore, the far red excitation of the QuasArs allows, in principle, combination with channelrhodopsin actuators or other GFP-based reporters.
CheRiff, a sensitive blue-shifted optogenetic actuator
We next sought to combine the QuasAr reporters with a blue light-activated
channelrhodopsin. To achieve spatially precise optical excitation, the channelrhodopsin should trigger APs when only a subsection of a cell is excited. Existing optogenetic actuators have had only marginal success in achieving this goal21. To avoid optical crosstalk, the blue light intended for the channelrhodopsin should not perturb the GEVI fluorescence. Existing optogenetic actuators require blue light intensities that perturb QuasAr fluorescence (Supplementary Fig. 7). We thus sought a more sensitive
Author Manuscript
Author Manuscript
Author Manuscript
channelrhodopsin that could reliably trigger APs with sub-cellular illumination and at lower light intensity, while maintaining fast opening and closing kinetics.
During a screen of plant genomes22 we identified a novel optogenetic actuator, Scherffelia dubia ChR (sdChR)15, derived from a fresh-water green alga first isolated from a small pond
in Essex, England (Supplementary Fig. 8)23. SdChR had promising sensitivity and a blue action spectrum (λmax = 474 nm). Addition of a trafficking sequence improved membrane
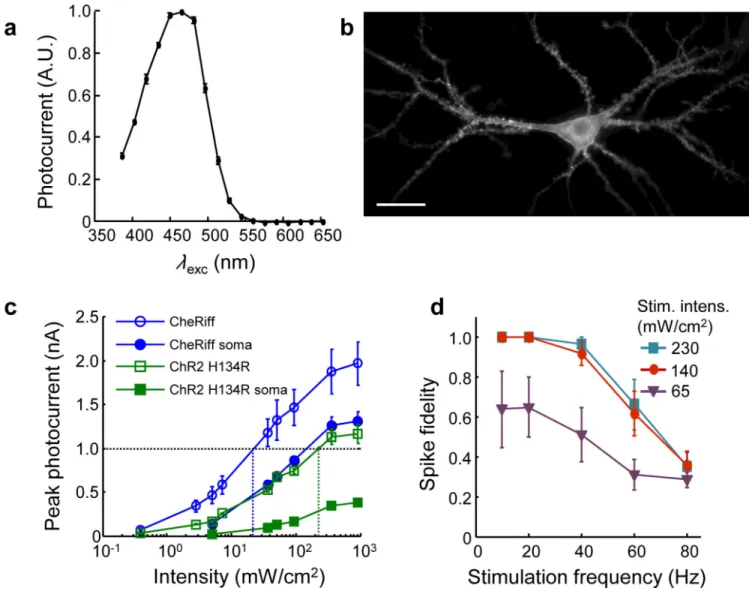
targeting (Supplementary Fig. 8). Introduction of the mutation E154A sped the kinetics and shifted the peak of the action spectrum to λmax = 460 nm (Fig. 2a), which decreased
spurious channelrhodopsin activation by red light (Supplementary Fig. 9, Supplementary Table 3, Methods). We dubbed the final construct CheRiff in reference to Scherffelia, its genus of origin. CheRiff showed good expression and membrane trafficking in cultured rat hippocampal neurons (Fig. 2b).
Under typical neural culture conditions, rapid and robust AP initiation requires currents of approximately 1 nA (ref. 24). In a paired comparison, CheRiff passed a photocurrent of 1 nA at a whole-cell illumination intensity of 22 ± 10 mW/cm2 (n = 5 neurons), 9-fold lower than was required for ChR2 H134R (200 ± 80 mW/cm2, n = 5 neurons) (Fig. 2c). For stimulation localized to the soma, CheRiff passed a photocurrent of 1 nA under illumination at 100 mW/cm2, while ChR2 H134R did not achieve this photocurrent under any
illumination intensity. Upon pulsed whole-cell illumination, CheRiff induced high-frequency and high-reliability spike trains (Fig. 2d) at five to ten-fold lower illumination intensities than have been reported for ChR2 H134R, ChIEF, or ChETA24 using the same protocol.
We measured the photophysical properties of CheRiff, ChR2 H134R and ChIEF25 in matched neuronal cultures (Supplementary Fig. 9, Supplementary Table 4). CheRiff showed 2-fold larger maximal photocurrents than ChR2 H134R or ChIEF. CheRiff had an opening rate 2-fold faster than ChR H134R and 4-fold faster than ChIEF. CheRiff had a similar closing rate to ChIEF, and was 1.5-fold faster than ChR H134R.
Finally, we tested for optical crosstalk between QuasArs and CheRiff in cultured neurons (Supplementary Table 5). Illumination sufficient to induce high-frequency trains of APs (488 nm, 140 mW/cm2) perturbed fluorescence of QuasArs by < 1% (Supplementary Fig. 7). Illumination with high intensity red light (640 nm, 900 W/cm2) induced an inward photocurrent through CheRiff of 14.3 ± 3.1 pA, which depolarized neurons by 3.1 ± 0.2 mV (n = 5 cells) (Supplementary Fig. 9). For most applications this level of optical crosstalk is acceptable.
Of the many attributes that determine channelrhodopsin function, the most important in CheRiff are its greatly increased sensitivity at low illumination intensity and its fast opening kinetics. These properties allow sub-cellular and low-intensity triggering of precisely timed APs.
Author Manuscript
Author Manuscript
Author Manuscript
Optopatch constructs
Optopatch1 and Optopatch2 consisted of bicistronic vectors for co-expression of CheRiff-eGFP and QuasAr1- or QuasAr2-mOrange2, respectively (Supplementary Fig. 10). We also made Optopatch variants which contained non-fluorescent eGFP and mOrange2 mutants, freeing the spectrum for other uses (Methods). The QuasAr and CheRiff constructs could also be delivered separately, but the bicistronic vector maintained a more uniform ratio of actuator to reporter expression levels.
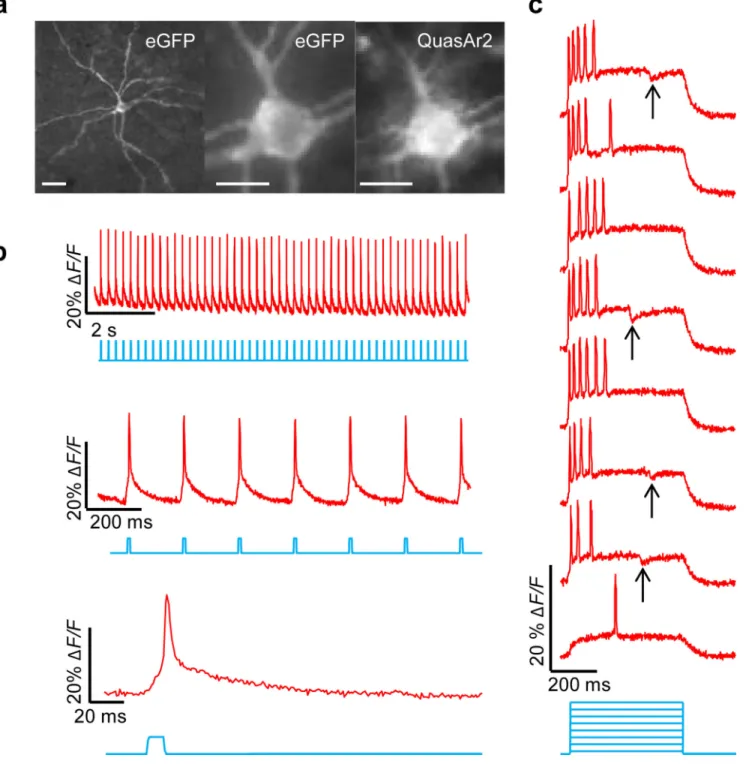
We characterized Optopatch2 in detail. When expressed under a CaMKIIα promoter in
cultured rat hippocampal neurons (Methods), Optopatch2 showed high expression and good membrane trafficking of both CheRiff and QuasAr2 (Fig. 3a). Patch clamp measurements found no statistically significant effect of expression on membrane resistance (P = 0.72), membrane capacitance (P = 0.87), resting potential (P = 0.31), threshold current (P = 0.67), or threshold potential (P = 0.38), when compared to paired cultures transfected with cytoplasmic GFP driven by a CaMKIIα promoter (n = 8 cells for Optopatch2, n = 7 cells for
GFP) (Supplementary Fig. 11).
A neuron expressing Optopatch2 was exposed to whole-field illumination with pulses of blue light (10 ms, 25 mW/cm2) to stimulate CheRiff, and simultaneous constant illumination with red light (800 W/cm2) to excite fluorescence of QuasAr2. We imaged fluorescence of QuasAr2 at a 1 kHz frame rate and calculated fluorescence from whole-cell average intensity (Supplementary Fig. 4), while simultaneously recording membrane voltage via a patch pipette. The optical and electrical traces corresponded closely (Fig. 3b).
Raw movies acquired at 1 kHz clearly showed fluorescence changes due to optically triggered APs (Supplementary Movie 1). Averaging temporally registered AP movies over multiple trials improved the SNR for sub-cellular AP mapping (Supplementary Movie 2). Under focused red illumination (2200 W/cm2), back-propagating APs were detected in single dendritic spines on a single-trial basis, with an SNR of 2.5 (Fig. 3c).
Probing synaptic transmission
With Optopatch, one can stimulate and record from independently selected and rapidly reconfigured regions of a neural circuit. We implemented this capability in culture using a digital micromirror device (DMD) to pattern the blue CheRiff excitation26, and wide-field red illumination to monitor voltage throughout the field of view (Methods).
We probed synaptic transmission by optically stimulating the soma of single cells, and optically monitoring electrical responses in neighboring cells. Optically induced single APs in the presynaptic cell led to fluorescence transients indicative of excitatory post-synaptic potentials (EPSPs), as well as occasional failures of synaptic transmission, in the
postsynaptic cell (Fig. 3d). The mean interval between the peak of the AP in the upstream cell and the onset of the optically detected EPSP in the downstream cell was < 2 ms, indicating a monosynaptic connection27. Addition of synaptic blockers (10 µM NBQX, 20 µM Gabazine, 25 µM AP-V) quieted the fluorescence response in the postsynaptic cell, without perturbing presynaptic activity. Validation measurements with patch clamp recordings showed millivolt-level correspondence of optically and electrically recorded
Author Manuscript
Author Manuscript
Author Manuscript
postsynaptic potentials, as well as inhibition of these signal by synaptic blockers (Supplementary Fig. 12).
Probing AP propagation
We next sought to apply the extremely fast response of Optopatch1 (containing QuasAr1) to probe the microsecond-timescale dynamics of AP initiation and propagation within a single cell. We used the DMD to target optical stimulation to either a dendrite or the soma and recorded the fluorescence dynamics at a 1 kHz frame rate. To improve the SNR we averaged 100 to 400 temporally registered optically induced APs. These mean-AP movies showed spread of the subthreshold voltage outward from the stimulated region, followed by a sudden spike in cell-wide fluorescence that peaked within two frames (Supplementary
Movie 3). Thus the native 1 kHz frame rate was insufficient to resolve the details of AP
propagation.
To probe microsecond-level dynamics, we adapted the sub-frame interpolation approach of Foust28 and Popovic29 (Supplementary Fig. 13, Methods, Supplementary Software). By interpolating a smoothly varying spline to the fluorescence intensity time-trace at each pixel, we inferred the timing with which the fluorescence crossed a user-selected threshold (e.g. 50% maximum deviation) with a precision better than the exposure time of the camera. Mean deviation between optically inferred and electrically recorded AP timing at the soma was 40 – 70 µs (Supplementary Fig. 13). We then constructed a higher time-resolution movie highlighting each pixel at the sub-frame time of its wavefront crossing. This interpolation technique does not rely on an assumed AP waveform, nor does it assume wavelike propagation; it is compatible with APs that change shape within or between cells. The visually striking propagation movies clearly showed AP initiation 30 – 50 µm from the soma in a single thin neurite, presumed to be the axon, in n = 8 of 8 measured cells
(Supplementary Fig. 3e, Supplementary Movies 4–6), regardless of stimulus location. The AP then propagated down the putative axon and back into the soma and dendrites. Latencies between AP initiation and arrival in the soma were 320 ± 220 µs (n = 8 cells, mean ± s.d). After acquiring Optopatch data, we fixed the cells and stained for ankyrin-G, a marker of the axon initial segment (AIS, Fig. 3e). The optically detected zones of AP initiation coincided with the distal end of the AIS, consistent with previous experiments using voltage-sensitive dyes30. Thus Optopatch can resolve functionally significant sub-cellular and microsecond timescale details of AP dynamics.
Parallel measurements in neuronal cultures
To achieve high-throughput functional characterization in neurons, one would like to apply the technique to many cells in parallel. We constructed a low-magnification, high-speed microscope (Supplementary Fig. 14, Methods) which robustly reported APs and
subthreshold dynamics in up to ∼50 cells simultaneously (Supplementary Movie 7). We used a DMD to pattern the blue illumination for targeted CheRiff excitation in user-selected regions. Optical stimulation of a segment of a synaptically connected culture induced
Author Manuscript
Author Manuscript
Author Manuscript
network activity which manifested as action potentials and sub-threshold dynamics in the cells not directly stimulated (Supplementary Fig. 15).
We developed an all-optical protocol to measure neuronal excitability. Synaptic blockers were added to suppress network activity. Cells were stimulated with pulses of blue light (500 ms at 6 s intervals) of increasing intensity (0 to 14 mW/cm2), while firing patterns were recorded under continuous red illumination (100 W/cm2). In wide-field measurements on n = 169 neurons expressing Optopatch2, we observed several distinct firing patterns, including fast-adapting and slow-adapting spike trains (Fig. 3f and Supplementary Movie 8). Two neurons showed intermittent bursting (one of these is indicated by a star in Fig. 3f). The comparatively high throughput of Optopatch measurements enables detection of rare electrophysiological phenotypes that might be missed in a manual patch clamp measurement on a smaller number of cells.
To test whether high-throughput Optopatch could quantify subtle electrophysiological shifts, we applied the all-optical excitability protocol to a model of homeostatic plasticity of intrinsic excitability (HPIE)31, in which neurons adapt their excitability to maintain an approximately constant level of activity. Observation of HPIE in culture32, 33 and in vivo34 has traditionally required laborious patch clamp measurements on many cells.
Neurons expressing Optopatch2 were incubated in tetrodotoxin (TTX, 1 µM) for 48 h and then measured in TTX-free medium in the presence of synaptic blockers32. Paired control cultures were incubated without TTX. Cells that had been treated with TTX (n = 94) subsequently showed significantly lower illumination threshold for spiking (P = 5×10⁻⁶), shorter interval between first and second spike (P < 0.001), and more total spikes (P < 0.01) than control cells (n = 75), but only a small change in time from light onset to first spike (Supplementary Fig. 16), consistent with previous reports32. Total data acquisition time was less than 1 h, a fraction of the time that would be required for manual measurements. While the HPIE measurements showed population-level changes in excitability, a unique promise of Optopatch is the ability to measure the same cell over several days. In 8 of 10 trials, neurons measured with a 1 minute Optopatch protocol were identified and re-recorded 48 hrs later (Supplementary Fig. 17). This capability could be important in studying
neuronal maturation or long-term effects of pharmacological, genetic, or environmental perturbations.
Probing excitability in hiPSC-derived neurons
Human-derived neurons show promise as a platform for studying human neurophysiology in health and disease35. However, variability arises at multiple levels in this approach4. Each patient’s genetic background modifies neuronal function, even for nominally monogenic diseases. Additional variability arises between iPSC clones from a single patient, between differentiations, and between cells cultured within a single well. Differing degrees of maturation are a particularly large source of cell-to-cell variability within a dish36. Furthermore, for diseasemodeling efforts, one may wish to test many differentiation protocols or pharmacological perturbations. Together, these factors motivate a need for
Author Manuscript
Author Manuscript
Author Manuscript
accurate functional characterization with robust statistics. The low throughput and selection bias of manual electrophysiology present a serious bottleneck.
We first assessed whether Optopatch expression perturbed electrophysiology in hiPSC-derived neurons. Cells were transfected with Optopatch2 and cultured on a rat glial
monolayer. The CamKIIα promoter genetically targeted the measurement to mature neurons
within this highly heterogeneous culture36. Patch clamp measurements on cells transfected
with Optopatch2 (n = 11) or with GFP (n = 11) showed no significant difference in membrane resistance (P = 0.82), membrane capacitance (P = 0.88), resting potential (P = 0.34), or action potential activation threshold (P = 0.78) (Supplementary Fig. 18). Optically evoked and optically monitored trains of APs showed the expected changes upon addition of ion-channel blockers lidocaine and tetraethylamine (Supplementary Fig. 19).
We then applied Optopatch to test for HPIE in hiPSC-derived neurons. This subtle electrophysiological effect is one of several forms of neural plasticity which have not previously been reported in human-derived neurons. HiPSC-derived neurons were incubated in 1 µM TTX for 48 h. Upon return to TTX-free medium, treated cells showed a substantial increase in subsequent optically measured excitability (n = 31 cells) relative to controls (n = 32 cells) (Fig. 4a – e), demonstrating positive HPIE.
We next tested for negative HPIE: conditions that depolarize cells (e.g. high KCl) induce a gradual decrease in intrinsic excitability33. HiPSC-derived neurons were incubated in 15 mM KCl for 60 h. Upon return to baseline conditions (2.5 mM KCl), treated cells showed a substantial decrease in subsequent optically measured excitability (n = 28 cells) relative to controls (n = 25 cells) (Fig. 4f – j).
Post-measurement immunostaining with anti-human nuclear antigen 1 and anti-GFP antibodies confirmed that all neurons tested were of human origin (Supplementary Fig. 20). Validation measurements with manual patch clamp confirmed that the HPIE protocols did not change CheRiff photocurrents (Supplementary Fig. 21).
These experiments demonstrate that human iPSC-derived neurons undergo bidirectional HPIE, and that Optopatch measurements can non-perturbatively report subtle differences in electrophysiology in these cells. High-throughput Optopatch measurements promise to be a powerful tool for functional characterization of neuronal populations in hiPSC-based disease modeling efforts.
Imaging in organotypic slice culture
Voltage imaging with GEVIs in intact tissue would enable functional mapping of sub-cellular and circuit-level signal processing. Application of GEVIs to recording of APs in mammalian brain tissue has been limited by the low voltage sensitivity and slow response of existing indicators37, 38. No GEVI has been shown to report single-trial APs in tissue with high fidelity.
We expressed Optopatch2 in organotypic brain slice using biolistic gene delivery. Neurons that had taken up the gene were clearly visible via fluorescence of eGFP (indicating
Author Manuscript
Author Manuscript
Author Manuscript
CheRiff) and QuasAr2 under wide-field epifluorescence imaging (20× N.A. 1.0 water immersion objective) (Fig. 5a). Upon illumination with pulses of blue light (10 ms, repeated at 5 Hz, 7.5 mW/cm2), the fluorescence under red excitation (1,200 W/cm2 nominal incident intensity, not corrected for light scatter) showed clearly resolved single-trial APs in the soma (Fig. 5b) and in dendrites (Supplementary Fig. 22). These traces represent raw fluorescence, without background subtraction or correction for photobleaching.
We performed Optopatch measurements on n = 7 separately prepared organotypic brain slices (Supplementary Fig. 23). AP amplitudes ranged from ΔF/F = 7.2 to 26.1% (mean 15.9%, n = 7 cells), calculated without subtraction of background autofluorescence. Whole cell-body fluorescence reported APs with SNRs ranging from 7.8 to 65.6 (mean 31.9) in a 1 kHz bandwidth. At lower red excitation intensity (400 W/cm2 nominal incident intensity, not corrected for light scatter), whole cell-body fluorescence reported APs with SNRs ranging from 7.2 to 35.7 (mean 16.5) in a 1 kHz bandwidth.
We further tested the response of neurons in tissue to extended pulses of blue illumination (0.5 s, 1 to 10 mW/cm2). This stimulus elicited a variety of firing patterns, including single spikes, bursts (Fig. 5c) and sustained activation (Supplementary Fig. 23). Optically induced spike trains were often interrupted by hyperpolarizing fluorescence transients, which we provisionally ascribe to inhibitory feedback in the local micro-circuit. We did not observe these inhibitory potentials in the absence of optical stimulation. These results demonstrate the feasibility of optically measuring single-cell, single-trial AP waveforms, excitability, and subthreshold dynamics in tissue with high SNR.
Finally, we compared Optopatch to ArcLight in organotypic slice (Supplementary Fig. 23, Methods). Under manual patch clamp stimulation, ArcLight fluorescence resolved single action potentials with a mean value of ΔF/F = −1.5 ± 0.4% and an SNR of 7.1 ± 2.8 (n = 6 cells) (excitation at 488 nm, 50 W/cm2). The ArcLight fluorescence transients had a mean width (at 70% maximum deviation) of 21.5 ± 3.0 ms. Thus QuasAr2 reports action
potentials in tissue with greater sensitivity, higher SNR, and better temporal resolution than ArcLight.
Discussion
The combination of improved reporter and improved actuator in the Optopatch constructs facilitates rapid, non-invasive characterization of genetically defined cells across spatial scales from microns to millimeters, and temporal scales from microseconds to days.
Optopatch has not yet been implemented with real-time feedback on the illumination, so it is not suited for voltageclamp experiments. Nonetheless, with the assistance of computational modeling, open-loop voltage measurements can probe ionic conductances and membrane electrical properties39, 40. Absolute voltage measurements with GEVIs are challenging due to variations in expression level and membrane trafficking. A recent report demonstrated measurements of absolute voltage through its effect on photocycle dynamics in an Archaerhodopsin mutant41. A similar strategy may apply to the QuasArs.
Author Manuscript
Author Manuscript
Author Manuscript
Our discovery of homeostatic plasticity in intrinsic excitability of hiPSC-derived neurons serves as a paradigm for other Optopatch assays of neuronal excitability. Such assays may probe cell-autonomous functional phenotypes in hiPSC-based models of diseases such as ALS42, epilepsy43, and Parkinson’s disease44. Other neurodevelopmental and
neuropsychiatric diseases arise primarily through synaptic dysfunction. These include Rett syndrome45, Fragile X46, and Phelan-McDermid syndrome36. Development of robust assays of synaptic function will likely benefit from incorporation of cell patterning techniques to control the type and location of synaptic connections. A merit of optical electrophysiology for disease modeling and drug screening is that it does not require mechanical access; thus it is compatible with microfluidic compound delivery and high throughput experimental formats. Optopatch measurements preserve the sterility of the sample and the integrity of the cell membrane, and thus are compatible with studies of long-term responses to chronic pharmacological perturbations.
We demonstrated that Optopatch functions in intact mammalian tissue. With extension to multiple genetically specified cells, Optopatch measurements in tissue may provide a useful tool for functional circuit mapping2. With improved optical sectioning capability, sub-cellular Optopatch measurements could enable inference of electrophysiological parameters in multicompartment neural models of single-cell information processing.
For applications in vivo, the new QuasAr reporters are likely to be appropriate for measurements on a few cells or small networks. The required laser power scales with the field of view, so tissue heating may be a concern for fields of view > ∼200 µm on a side. Applications to larger circuits will likely benefit from further improvements to the indicator, primarily increased brightness, and exploration of two-photon excitability or other contrast modalities. Small transparent organisms, e.g. zebrafish and C. elegans, are likely early targets as most illumination passes through the body without depositing heat.
Online Methods
Engineering of Arch
We adopted a hierarchical approach to screening that prioritized brightness over multiple secondary selection criteria. The brightness screen was conducted by examining the fluorescence of large libraries of variants expressed in bacterial colonies. Subsequent screens for trafficking, speed, and voltage sensitivity were performed in HeLa cells subjected to field stimulation and induced transmembrane voltages, and then in HEK cells with patch clamp.
Molecular biology procedure—Synthetic DNA oligonucleotides used for cloning and library construction were purchased from Integrated DNA Technologies (primers used for directed evolution of QuasArs are in Supplementary Table 6). Pfu polymerase (Fermentas) or AccuPrime Pfx SuperMix (Invitrogen) were used for high fidelity non-mutagenic PCR amplifications in the buffer supplied by the respective manufacturer. Taq polymerase (New England Biolabs) in the presence of MnCl2 (0.1 mM) was used for error-prone PCR. PCR
products and products of restriction digests were routinely purified using preparative agarose gel electrophoresis followed by DNA isolation using the GeneJET gel extraction kit
Author Manuscript
Author Manuscript
Author Manuscript
(Fermentas). Restriction endonucleases were purchased from Fermentas and used according to the manufacturer’s recommended protocol. Ligations were performed using T4 ligase (Invitrogen) or Gibson Assembly (New England Biolabs). Small-scale isolation of plasmid DNA was performed by GeneJET miniprep kit (Fermentas). The cDNA sequences for all Arch variants and fusion constructs were confirmed by dye terminator cycle sequencing using the BigDye Terminator Cycle Sequencing kit (Applied Biosystems). Site-directed mutagenesis and randomization of targeted codons was performed with either the QuikChange Lightning Single or Multi kit (Agilent Technologies).
Construction of Arch mutant libraries—A library of > 104 mutants was generated by error-prone PCR of the gene encoding Arch D95N. These variants were then joined with the gene encoding mOrange2 by a two-part overlap extension PCR. The 5’ piece used in the overlap extension was prepared by error-prone PCR of Arch D95N as template with a mixture of the forward primer (Fw_XbaI_Arch) and reverse primer (RV_Arch). Primer Fw_XbaI_Arch contains an XbaI site and primer RV_Arch contains an overlap region with primer FW_Arch_FP. The 3’ piece for use in the overlap extension was prepared by high fidelity PCR amplification of mOrange2 using a forward primer (FW_Arch_FP) and a reverse primer (RV_HindIII_FP). Primer RV_HindIII_FP contains a stop codon and a HindIII site. The full-length Arch-mOrange2 gene library was assembled by overlap extension PCR using an equimolar mixture of primers Fw_XbaI_Arch and RV_HindIII_FP together with a mixture of the 5’ and 3’ PCR fragments described above (50 ng each) as the template. In later rounds of directed evolution, error-prone PCR and StEP PCR DNA shuffling 47 were both used for construction of Arch-mOrange2 gene libraries. The full-length PCR product (approximately 1,500 b.p.) was purified by agarose gel electrophoresis, doubly digested, and ligated between the XbaI and HindIII sites of a modified pBAD vector which was generated by deleting the ETorA tag between the NcoI and XbaI sites of the pTorPE vector 48 using Quikchange Lightning kit.
Following ligation, electrocompetent E. coli strain DH10B was transformed with the library of gene variants and cultured overnight at 37 °C on 10-cm Petri dishes of LB-agar
supplemented with 100 µL of 4 mM retinal (Sigma), 100 µg/mL ampicillin (Sigma), and up to 0.0020% (wt/vol) L-arabinose (Alfa Aesar). The retinal solution was added on the surface
of LB-agar plates evenly and air-dried prior to plating the cell suspension. At concentrations of L-arabinose higher than 0.0020% (wt/vol) we observed abnormal colony morphologies
and reduced fluorescent brightness, presumably due to cytotoxicity caused by overexpression.
Screening of Arch mutants in E. coli—The imaging system used for library screening has previously been described in detail49. We screened 10,000–20,000 colonies (10–20 plates of bacterial colonies) per round of random mutagenesis. For libraries generated by randomization of one or more codons, we screened approximately 3-fold more colonies than the expected library diversity (e.g. 3,000 colonies for a 1,000-member library).
We acquired two images of colonies using filter sets for mOrange2 (exc. 540 – 580 nm, em. 600 – 660 nm) and Arch (exc. 604–640 nm and em. 660 – 700 nm). An image of the ratio of
Author Manuscript
Author Manuscript
Author Manuscript
Arch: mOrange2 fluorescence was calculated, and the colonies with the top 0.01% to 0.1% highest ratios were manually picked. Picked clones were individually cultured in 2 mL liquid LB medium (200 µg/mL ampicillin) shaken (250 rpm) overnight at 37 °C.
Protein expression was induced by adding 2 mL of liquid LB medium containing 120 µM retinal, 200 µg/mL ampicillin and 0.2% L-arabinose to the overnight culture, followed by
incubation at 37 °C for 3 hours. The cell pellets were collected by centrifugation, washed and resuspended in buffered M9 salt solution containing 7 g/L Na2HPO4, 3 g/L KH2PO4,
0.5 g/L NaCl and 1 g/L NH4Cl. The suspension was then diluted 5-fold prior to acquisition
of its fluorescence spectrum in a Safire 2 fluorescence microplate reader (Tecan).
The emission profiles of each variant under excitation at 525 nm and 600 nm were acquired and normalized by the absorbance at 600 nm. The cell pellets of the three variants with the highest ratios of Arch to mOrange2 and the two variants with the brightest absolute Arch fluorescence were treated for plasmid DNA extraction, and the pooled genes were used as templates for construction of gene libraries in the next round of directed evolution. After five iterations we arrived at a non-pumping variant of Arch with five mutations relative to wild-type (P60S, T80S, D95N, D106Y, and F161V) and substantially improved brightness under excitation with low illumination intensity. This variant, designated Arch 3.5, was used as the template for subsequent efforts to address the secondary selection criteria.
Random mutagenesis at positions Asp95 and Asp106—We next focused on tuning other properties of Arch including voltage sensitivity, response kinetics, membrane trafficking and the undesirable dependence of brightness on illumination intensity. Positions Asp95 and Asp106 of Arch are structurally aligned with positions Asp85 and Asp96 of bacteriorhodopsin, and have been reported to play key roles in proton translocation during the photocycle 50, 51. The voltage sensing mechanism of Arch is likely due to electric-field-dependent protonation of the retinal Schiff base 17,52, so we reasoned that perturbations of the proton translocation network around the Schiff base could potentially affect the voltage sensitivity, response kinetics, or complex photophysics18.
We constructed libraries in which Asp95 and Asp106 were randomized to a subset of all possible amino acid substitutions. First, we randomized position 95 using codon HVS (where H = A, C or T; V= A, C, or G; S = C or G), which encodes for all amino acids except Ala, Gly, Asp, Glu and Val. This library was screened by fluorescence imaging of E. coli colonies. Variants that retained a high ratio of Arch to mOrange2 fluorescence were picked and expressed in HeLa cells for screening via induced transmembrane voltage (see below). The mutation N95H emerged as the best from the first round of screening in HeLa cells. We then constructed a second library by randomizing position 106 to a subset of amino acids with polar or charged side chains (codon NRC, where N = A, C, G, or T; R = A or G), and screened these in HeLa cells. The variant with histidine at position 106 proved most promising and was designated QuasAr1.
Author Manuscript
Author Manuscript
Author Manuscript
Solubilization and spectroscopic characterization of QuasAr1 and QuasAr2. E. coli—expressing QuasAr1 and QuasAr2 were grown in 12 mL liquid LB medium with 200 µg/ml ampicillin overnight. The next day, 12 mL of liquid LB medium containing 50 µM retinal, 200 µg/ml ampicillin and 0.1% arabinose was added into the overnight culture, followed by additional incubation at 37 °C for 4 hours. The cell pellets were collected by centrifugation and lysed by suspension in B-PER solution (Pierce). The cytoplasmic fraction was discarded after centrifugation and the colored insoluble fraction was resuspended in phosphate buffered saline (PBS) containing 1.5% n-dodecyl-β-D-maltopyranoside (Affymetrix, Inc.). The suspension was homogenized by an ultrasonic homogenizer and centrifuged (17,000 g for 15 mins, 4 °C). The solubilized protein in the supernatant was used for in vitro spectroscopic characterization.
Absorption spectra were recorded on a DU-800 UV-visible spectrophotometer (Beckman) and fluorescence spectra were recorded on a Safire2 plate reader (Tecan). Cy5 carboxylic acid (Cyandye) was used as the reference for quantum yield measurement. Quantum yield measurements were performed on a series of dilutions of each protein solution and standard, with absorbance values ranging from 0.01 to 0.05 at 600 nm. The fluorescence emission spectra of each dilution were recorded with excitation at 600 nm and the total fluorescence intensities obtained by integration. Integrated fluorescence intensity vs. absorbance was plotted for each protein and each standard. Quantum yields, Φ, were determined from the slopes (S) of each line using the equation: Φprotein = Φstandard × (Sprotein/Sstandard). Expression vectors for HeLa cells—To express Arch-mOrange2 variants in HeLa cells, the gene in the pBAD vector was first amplified by PCR using primers
Fw_BamHI_Kozak_Arch and RV_FP_ERex_stp_XbaI. This reverse primer encodes the endoplasmic reticulum (ER) export sequence from the inward-rectifier potassium channel Kir2.1 (FCYENE) 53, which has been reported to be effective for improving the membrane trafficking of Arch in mammalian cells54.
The purified DNA was digested with BamHI and XbaI restriction enzymes and ligated into a purified pcDNA3.1 plasmid that had been digested with the same two enzymes. The ligation reaction was used for transformation of electrocompetent E. coli strain DH10B cells. Cells were plated on LB/agar supplemented with ampicillin and individual colonies were picked into 4 mL of LB/ampicillin following overnight incubation at 37 °C. Liquid cultures were shaken at 250 rpm and 37 °C for 12–15 h and then a small scale isolation of plasmid DNA was performed. Each gene in pcDNA3.1 was fully sequenced using T7_FW, and BGH_RV primers. Plasmids were then used for cell transfection as described below.
Induced transmembrane voltage (ITV) in HeLa cells—We co-expressed prospective Arch variants in HeLa cells with the inward rectifier potassium channel, Kir2.1. Expression of Kir2.1 lowered the resting potential to approximately −60 mV, close to the resting potential of neurons55, 56. We reasoned that this effect would center the ITV close to the physiologically relevant range.
HeLa cells were grown to 40–60% confluence on home-made 35 mm glass bottom dishes or 24-well glass bottom plates. Cells were transfected with 1 µg of plasmid DNA comprising a
Author Manuscript
Author Manuscript
Author Manuscript
1:1 mixture of Arch variant and Kir2.1, using either 2 µL Turbofect (Thermo Scientific) or 2 µL Lipofectamine 2000 (Invitrogen) according to the manufacturer’s instructions. After 3 h incubation, the medium was exchanged to DMEM with 10% fetal bovine serum. Cells were incubated for an additional 24 h at 37 °C in a CO2 incubator. Immediately prior to imaging,
cells were washed twice with Hanks balanced salt solution (HBSS) and then 1 mL of 20 mM HEPES buffered HBSS was added.
Cell imaging was performed with an inverted Eclipse Ti-E (Nikon) equipped with a Photometrics QuantEM 512SC camera, a 150 W mercury-xenon lamp (Hamamatsu), and a 10 mW 638 nm semiconductor diode laser (56ICS/S2669, Melles Griot CleanBeam) aligned just above the angle for total internal reflection. The filters were: 590–650 nm (excitation), 668–738 nm (emission), and 666 nm (dichroic). Movies were acquired at 10 ms/frame. The NIS-Elements Advanced Research software (Nikon) was used for microscope and camera control and data acquisition. A schematic of the setup is shown in Supplementary Fig. 1. To probe the response kinetics and voltage sensitivity, we used a pair of parallel platinum electrodes to apply a reproducible electric field across the cell culture and induce transient asymmetries in the membrane voltage57. Platinum electrodes with a gap of 0.5 cm were mounted in a custom plastic support. The electrode pair was placed in the imaging dish or well, and voltage pulses from a 6824A 40V/25A DC Power Supply (HP / Agilent) were applied using waveforms generated by a pulse generator PG 58A (Gould Advance Ltd). The typical waveform had square-wave pulses lasting 20 ms, and pulse amplitudes from 25 – 35 V. Fluorescence was imaged at 100 Hz frame rate in 4×4 binning mode for 10 seconds. During each voltage pulse, opposite sides of the cell showed opposite fluorescence transients. Typical fluorescence traces are shown in Supplementary Fig. 1.
Raw fluorescence traces were corrected for background autofluorescence and
photobleaching. The average voltage sensitivity (ΔF/Fmin) and signal-to-noise ratio of each
Arch variant were compared to the best variant of the previous generation, and only the variants with equal or improved performance were chosen as templates for the next round of screening.
Expression vectors for HEK cells and neurons—To enable more accurate electrophysiological characterization via patch clamp in HEK cells and primary neuron cultures, we cloned QuasAr1 into the BamHI/EcoRI sites of lentivirus vector FCK-Arch-GFP (Addgene: 22217). This vector contains a CaMKIIα promoter and a Woodchuck
Hepatitis Virus Posttranscriptional Regulatory Element (WPRE) after the 3’ end of the open reading frame. The Arch cDNA was generated by PCR using forward primer
FW_BamHI_Kozak_Arch_ValSer and overlapping reverse primers RV_FP_TS and RV_TS_ERex_ stp_EcoRI. These reverse primers introduce a trafficking signal (TS) motif and ER export signal peptide sequence at the C-terminus of the protein.
Simultaneous electrophysiology and fluorescence in HEK cells—HEK293T cells (ATCC CRL-11268) were cultured and transfected following standard protocols17. Cells tested negative for mycoplasma. Briefly, HEK-293 cells were grown at 37 °C, 5% CO2, in DMEM supplemented with 10% FBS and penicillin-streptomycin. 400 ng of
Author Manuscript
Author Manuscript
Author Manuscript
plasmid DNA was transfected using Transit 293T (Mirus) following the manufacturer’s instructions, and assayed 48 hours later. The day before recording, cells were re-plated onto glass-bottom dishes (In Vitro Scientific) at a density of ∼10,000 cells/cm2.
Cells were supplemented with retinal by diluting stock retinal solutions (40 mM, DMSO) in growth medium to a final concentration of 5 µM, and then returning the cells to the
incubator for 0.5 - 1 hour. All imaging and electrophysiology were performed in Tyrode buffer (containing, in mM: 125 NaCl, 2.5 KCl, 3 CaCl2, 1 MgCl2, 10 HEPES, 30 glucose
pH 7.3, and adjusted to 305–310 mOsm with sucrose). A gap junction blocker, 2-aminoethoxydiphenyl borate (50 µM, Sigma), was added to eliminate electrical coupling between cells.
Filamented glass micropipettes (WPI) were pulled to a tip resistance of 5–10 MΩ, and filled with internal solution containing 125 mM potassium gluconate, 8 mM NaCl, 0.6 mM MgCl2, 0.1 mM CaCl2, 1 mM EGTA, 10 mM HEPES, 4 mM Mg-ATP, 0.4 mM Na-GTP (pH 7.3); adjusted to 295 mOsm with sucrose. Pipettes were positioned with a Sutter MP285 manipulator. Whole-cell, voltage and current clamp recordings were acquired using an Axopatch 700B amplifier (Molecular Devices), filtered at 2 kHz with the internal Bessel filter and digitized with a National Instruments PCIE-6323 acquisition board at 5–10 kHz. Data was only acquired from HEK cells having reversal potentials between −10 and −40 mV, access resistance < 25 MΩ and membrane resistance > 0.5 GΩ.
Simultaneous whole-cell patch clamp recordings and fluorescence recordings were acquired on a home-built, inverted epifluorescence microscope, described previously17 and described below in “Optopatch Apparatus”. For step response measurements, voltage clamp
electronics were compensated 90–95%. We examined variants of QuasAr1 with mutations at position 95 (Asn, Cys, Gln, His and Tyr) and position 106 (Arg, Asp, Asn, Cys, Glu, His, Lys and Tyr). These experiments confirmed that histidine at position 106 provided undetectable photocurrent, and the best combination of improved voltage sensitivity, and fast kinetics. Mutants with Gln, Cys, or Asn at position 95 exhibited better voltage sensitivity compared to QuasAr1, while retaining fast kinetics. We designated the H95Q mutant QuasAr2.
Analysis of mutations in QuasAr1 and QuasAr2—We developed a structural model of Quasar1 (Supplementary Fig. 2) based on homologous protein Arch-2 (PDB: 2EI4, ref. 58). Mutations T80S and F161V are located in the periphery of the protein, while P60S is close to the Schiff base of the retinal chromophore. Given their location, we suspect that the T80S and F161V substitutions are unlikely to have a direct impact on the photophysical properties of the protein, and are more likely to have a role in improving the folding efficiency. In contrast, the close proximity of the P60S substitution to the Schiff base suggests that this mutation has a more direct influence on the photophysical properties. We compared the Arch double mutants Arch(D95H, D106H) (termed “HH”) and
Arch(D95Q, D106H) (termed “QH”) to the corresponding QuasAr1 and QuasAr2 mutants do determine whether the mutations in the proton-transport chain were sufficient to induce the improved sensor performance. QuasAr1 and QuasAr2 were both substantially brighter
Author Manuscript
Author Manuscript
Author Manuscript
than the corresponding double mutants (Supplementary Fig 3). Furthermore, the voltage sensitivity of the HH, QH, QuasAr1 and wild-type protein were comparable, and three-fold less than the sensitivity of QuasAr2. The QuasArs were faster than their corresponding double mutants. Thus one or more of the three mutations outside the proton transport chain (P60S, T80S, F161V) plays an important role in the brightness, sensitivity, and speed of the QuasAr mutants.
The constructs described in this paper are available on Addgene.
Engineering of CheRiff
The gene for Scherffelia dubia Channelrhodopsin (sdChR) was synthesized with mouse codon optimization. This gene was selected from a screen of channelrhodopsins for its blue excitation peak (474 nm) and its large photocurrent relative to ChR2. However, the trafficking in neurons was poor (Supplementary Fig. 8). Addition of a trafficking sequence from Kir2.1 improved trafficking greatly,54. Addition of the ER2 export motif did not
appear to further improve trafficking, so this motif was not included in the final construct. The improved membrane trafficking led to large photocurrents in neurons under blue excitation (2470 ± 170 pA peak, 488 nm, 500 mW/cm2, n = 3 cells) but also led to
unacceptably large photocurrents from the red laser used to illuminate the QuasArs (38 ± 4 pA, steady state, 640 nm, 300 W/cm2). Furthermore the off-time was undesirably slow (τoff
= 26.0 ± 2.9 ms). Based on experience with mutations in other rhodopsins, we introduced the mutation E154A, which only slightly decreased the peak photocurrent under blue illumination (to 2030 ± 100 pA, n = 10), but decreased the crosstalk from red illumination (to 10.5 ± 2.8 pA) and shortened τoff to 16.0 ± 0.8 ms. This variant, termed CheRiff, showed
excellent trafficking and neural activation at low illumination intensities. The action spectrum of CheRiff was measured in HEK293 (n = 6 cells) with a
monochromator (Till-Photonics Polychrome IV). 10 ms pulses of nearly equal photon fluxes (∼2.5 × 10²¹ photons/s/m2) were used across wavelengths. Small deviations in photon flux between wavelengths were corrected by dividing the recorded opsin response by the measured photon dose. For each cell, wavelengths were swept from blue-to-red and red-to-blue, and the responses were averaged.
Design of Optopatch
We tried several strategies to create an Optopatch construct. Kleinlogel and coworkers reported a gene fusion strategy for stoichiometric co-expression of two microbial rhodopsins as a single polypeptide chain59. We made fused constructs of several channelrhodopsins and Arch, but these showed poor trafficking.
We then explored 2A peptide ribosomal skip sequences as a means to achieve approximately stoichiometric co-expression. The porcine teschovirus-1 (P2A) sequence performed better than the Thosea asigna virus (T2A) sequence. Due to the greater need for high expression of the voltage indicator than the actuator, we placed the QuasAr gene before the P2A sequence and the CheRiff gene after (Supplementary Fig. 10).
Author Manuscript
Author Manuscript
Author Manuscript
In some applications one might wish to use the visible spectrum for other imaging modalities, e.g. for a reporter of Ca2+ or a GFP expression marker. In such cases, it is inconvenient to have GFP and mOrange2 fused to CheRiff and Arch, respectively. Removal of the eGFP tag from Arch resulted in poor membrane localization in neurons. To maintain the beneficial trafficking properties of the eGFP tag while eliminating the eGFP
fluorescence, we mutated the eGFP chromophore from TYG to GGG using site-directed mutagenesis (Agilent). This mutation has been reported to preserve folding of eGFP60. We also made versions of Optopatch in which the mOrange2 was mutated to a non-fluorescent form by the mutation TYG to TAG.
Optopatch constructs were incorporated into lentiviral vectors under the CaMKIIα promoter,
adapted from Addgene plasmid 22217.
Neuronal culture and gene delivery
All procedures involving animals were in accordance with the National Institutes of Health Guide for the care and use of laboratory animals and were approved by the Institutional Animal Care and Use Committee at the institution at which they were carried out.
Primary neurons—Rat glial monolayers were prepared similarly to ref. 61. Briefly, 106 dissociated hippocampal cells from P0 rat pups (Sprague Dawley, Tocris)62 were plated on a 10 cm culture dish in glial medium GM, comprised of 15% FBS (Life), 0.4% (w/v) D-glucose, 1% glutamax (Life), 1% penicillin/streptomycin (Life) in MEM (Life). When the dish reached confluence (1–2 weeks), cells were split using trypsin onto glass-bottomed dishes (In Vitro Scientific, D35-20-1.5-N) coated with poly-D-lysine and matrigel (BD biosciences) at a density of (3500 cells/cm2). After ∼ 3–6 days, glial monolayers were at or near confluence and the medium was replaced by GM with 2 µM cytarabine (cytosine-β-arabinofuranoside, Sigma). Dishes were maintained in GM with 2 µM cytarabine until use. Dishes were discarded if microglia or neurons were identified on the monolayers.
Hippocampal neurons from P0 rat pups were dissected and cultured in neurobasal-based medium (NBActiv4, Brainbits llc.) at a density of 30,000–40,000 cm−2 on the pre-established glial monolayers62. At one day in vitro (DIV), cytarabine was added to the neuronal culture medium at a final concentration of 2 µM to inhibit further glial growth63. Neurons were transfected on DIV 7 with the QuasArs or Optopatch plasmids via the calcium phosphate transfection method. Procedures closely followed ref. 64. Measurements on neurons were taken between DIV 13-18.
For comparisons between CheRiff, ChR2 H134R and ChIEF, neurons were plated on glass-bottom dishes coated with poly-d-lysine (Sigma P7205) and matrigel (BD biosciences 356234) without pre-established glial monolayers. On DIV 3 cytarabine (2 µM) was added. Cells were transfected on DIV 7 with channelrhodopsin-eGFP fusions, in identical lentiviral plasmids with a CaMKIIα promoter. All comparison measurements were taken between
DIV14–15 at room temperature (23 °C).
Author Manuscript
Author Manuscript
Author Manuscript
For TTX-induced homeostatic plasticity, primary neurons were transfected via the calcium phosphate method on DIV7. TTX (1 µM) was added on DIV 16. Excitability was measured on DIV 18 in Tyrodes medium with synaptic blockers (10 µM NBQX, 25 µM AP-V, 20 µM Gabazine).
hiPSC-derived neurons—Human iPSC-derived iCell neurons were purchased from Cellular Dynamics Inc. Neurons were tested negative for mycoplasma by the manufacturer. Neurons were thawed and resuspended in complete iCell Neuron Maintenance Medium (CM) following manufacturer protocols. Cells were then plated at a density 125,000/cm2 on pre-established rat glial monolayers grown on glass-bottomed dishes. Medium was replaced 24 hours post plating with CM supplemented with 10 ng/mL BDNF (Peprotech). Thereafter, 50% media exchanges with CM were done every 5 days.
For TTX-induced homeostatic plasticity, hiPSC-derived neurons were transfected via the calcium phosphate method on DIV17. TTX (1 µM) was added on DIV 26. Excitability was measured on DIV 28 in Tyrodes medium with synaptic blockers (10 µM NBQX, 25 µM AP-V, 20 µM Gabazine).
For KCl-induced homeostatic plasticity, hiPSC-derived neurons were transfected on DIV 10. KCl (15 mM) was added from DIV 18 to DIV 21 (60 h). Excitability was measured on DIV 21 in Tyrodes medium with synaptic blockers (10 µM NBQX, 25 µM AP-V, 20 µM Gabazine).
Organotypic brain slice culture—Organotypic hippocampal slices cultures were prepared from postnatal day 6–8 Sprague-Dawley rats as described previously65. The brain was taken out and immediately placed in chilled dissection media. Transverse hippocampal slices were cut with 400 µm thickness and 4 to 6 slices were placed in a sterile culture plate insert (Millicell-CM, Millipore) in 6-well plates containing prewarmed media. Slices were biolistically transfected with a Helios Gene Gun (BioRad) at 2 days in vitro (DIV 2). Bullets were prepared using 12.5 µg of 1.6 µm gold particles and 80 − 100 µg of plasmid DNA. Slices were maintained until imaging at DIV 12–16.
Immediately prior to inverted imaging, slices were affixed to a nylon mesh weight and mounted upside down in a delta T brainslice adapter for inverted microscope imaging (Bioptechs). Artificial cerebrospinal fluid (ACSF) was bubbled with carbogen (95% O2, 5%
CO2) and flowed over the slice at 1 mL/min at 23 °C. Electrophysiology in neurons
Measurements were performed on primary cultures at 13 – 15 DIV. Experiments were conducted in Tyrode’s solution containing 125 mM NaCl, 2.5 mM KCl, 3 mM CaCl2, 1 mM
MgCl2, 10 mM HEPES, 30 mM glucose (pH 7.3) and adjusted to 305–310 mOsm with
sucrose. Prior to imaging, neurons were incubated with 5 µM all-trans retinal for 30 minutes and then washed with Tyrode’s solution.
Synaptic blockers were added to the imaging medium for measurements of single-cell electrophysiology. The blockers comprised NBQX (10 µM, Tocris),
D(−)-2-amino-5-Author Manuscript
Author Manuscript
Author Manuscript
phosphonovaleric acid (AP5; 25 µM, Tocris), and gabazine (SR-95531, 20 µM, Tocris). For measurements of channelrhodopsin photocurrents in neurons, TTX (1 µM, Tocris) was included along with the synaptic blockers to prevent recruitment of voltage gated sodium channels. Patch clamp data was used if and only if access resistance was < 25 MΩ, and did not vary over the experiment. Recordings were terminated if membrane resistance changed by > 10%. Experiments were performed at 23 °C under ambient atmosphere unless otherwise noted.
Comparison of QuasArs to ArcLight A242—ArcLight A242 was prepared in an identical lentiviral plasmid driven by a CaMKIIαpromoter and was transfected (DIV 7) in
parallel with the QuasAr plasmids in paired cultures. We used a standard ArcLight imaging intensity of 10 W/cm2 at 488 nm. QuasAr expressing neurons were imaged at two intensities (300 and 800 W/cm2). All recordings were made on the setup described below (“Optopatch apparatus”) at a 1 kHz frame rate and 60x magnification. Due to its slow kinetics at room temperature (Fig S6), ArcLight recordings were made at 34 °C to enhance SNR and to match previously published conditions 16. QuasAr2 reported APs with comparable SNR at 23 °C and 34 °C (41 ± 3, n = 8 cells, 300 W/cm2). For comparisons in organotypic brain slice, ArcLight was imaged at 50 W/ cm2 on an upright microscope to enable simultaneous patch clamp stimulation and recordings. Recordings were made at a 1 kHz frame rate as described below (“Optopatch apparatus”) and were acquired at 34 °C.
Immunostaining
Cultures were fixed immediately following data acquisition in a solution of 4%
paraformaldehyde and 4% sucrose (w/v) in PBS, pH 7.4 at room temperature for 8 minutes. Fixed cultures were then washed three times in Dulbecco’s PBS supplemented with Ca2+ and Mg2+ (DPBS), pH 7.4, prior to permeabilization and blocking in a solution of 0.1% (w/v) gelatin and 0.3% Triton-X-100 (v/v) in PBS, pH 7.4 (GTB) for 12–48 hours at 4C. For experiments using the sub-frame interpolation algorithm, primary cultures were fixed and stained using primary mouse monoclonal anti-ankyrin G (NeuroMab clone N106/36; 1:500), primary rabbit monoclonal anti-GFP (Abcam ab32146, lot YK011702CS, 1:1000), secondary goat anti-rabbit AlexaFluor 488 conjugated (Abcam ab150077, 1:500), and secondary goat anti-mouse AlexaFluor 647 conjugated (Abcam ab150115, 1:500) antibodies.
For experiments on human iPSC derived neurons, cultures were incubated with primary mouse anti-human nuclear antigen antibody (Millipore MAB1281 clone 235-1,1:500) in GTB overnight at 4 °C, then washed three times in DPBS, and incubated with rabbit anti-GFP AlexaFluor 488 conjugated (polyclonal, Life A21311, 1:300) and secondary antibody donkey anti-mouse AlexaFluor 647 (Life A31571, 1:300) in GTB overnight at 4C. Cultures were washed three times in DPBS prior to mounting in DAPI Fluoromount-G (Southern Biotech).