HAL Id: hal-00023899
https://hal-insu.archives-ouvertes.fr/hal-00023899
Submitted on 9 May 2006
HAL is a multi-disciplinary open access
archive for the deposit and dissemination of
sci-entific research documents, whether they are
pub-lished or not. The documents may come from
teaching and research institutions in France or
abroad, or from public or private research centers.
L’archive ouverte pluridisciplinaire HAL, est
destinée au dépôt et à la diffusion de documents
scientifiques de niveau recherche, publiés ou non,
émanant des établissements d’enseignement et de
recherche français ou étrangers, des laboratoires
publics ou privés.
Fluorite stability in silicic magmas.
Bruno Scaillet, Ray Macdonald
To cite this version:
Bruno Scaillet, Ray Macdonald. Fluorite stability in silicic magmas.. Contributions to Mineralogy
and Petrology, Springer Verlag, 2004, 147, pp.319-329. �10.1007/s00410-004-0559-1�. �hal-00023899�
Fluorite stability in silicic magmas
B. Scaillet, R. Macdonald
Abstract Recent experimental evidence is used to assess the conditions under which fluorite forms an early crystallising phase in silicic magmas. Fluorite solubility primarily depends on the (Na + K)/Al balance in the coexisting silicic melt, reaching a minimum in metaluminous melts. It can display reaction relationships with topaz and titanite, depending on changes in melt composition during crystallisation. An empirical model of fluorite stability in Ca-poor peralkaline rhyolite melts is derived and applied to selected
rocks :
At the F contents preserved in most silicic rocks, fluorite should normally appear late in the crystallisation
sequence, in agreement with petrographic observations. During fluid-absent crustal anatexis, fluorite should melt at a relatively early stage and restitic fluorite is unlikely to persist during prolonged melting. Fluorite may, however, exert a decisive control on the alkali/alumina balance of sub-aluminous anatectic melts and it can affect the liquid line of descent of silicic magmas once extracted from source.
Introduction
A variety of fluoride minerals can precipitate from F-bearing aluminosilicate melts, including fluorite (CaF2), cryolite (Na3AlF6), villiaumite (NaF) and fluor-topaz (Al2SiO4F2). Villiaumite occurs
only in silica-undersaturated, evolved magmas (Stormer and Carmichael 1970) and will not be discussed further here. Fluorite in granites and rhyolites may be primary or secondary, and early or late crystallising. From thermodynamic calculations and observed parageneses, Stormer and Carmichael (1970) concluded that fluorite crystallisation should occur in magmas that are not unusually poor in calcium, whereas cryolite should be the stable fluoride in Ca-poor, silica-oversaturated magmas. Yet, although cryolite has been synthesised in Ca-free haplogranite melts doped with F (Manning 1981), fluorite, with or without topaz, has also been reported to occur in several Ca-poor (CaO <0.5 wt%) rhyolites (Webster et al. 1987; Congdon and Nash 1989, 1991; Marshall et al. 1998) and granites (e.g. Charoy and Raimbault 1994; Happala 1997). Texturally-based interpretations of fluorite paragenesis are commonly equivocal, however. For example, Collins et al. (1982) recorded it as an accessory mineral in A-type granites of the Lachlan Fold Belt of south-eastern Australia, whereas King et al. (1997) suggested that most, if not all, of the fluorite was of subsolidus origin (see also Price et al. 1999). Strong evidence of the early crystallization of fluorite was provided by Price et al. (1996) from the Mount Scott Granite, Wichita province, Oklahoma, where it occurs as euhedral crystals forming inclusions in phenocrysts of hornblende and feldspar. The pressure–temperature conditions during the early stages of crystallisation of the granite have been estimated as 200 MPa and 917–898 °C ; fO2 conditions
were below NNO (Hogan and Gilbert 1995, 1997). Marshall et al. (1998) provided the first report of phenocrystic fluorite in peralkaline rhyolites, from the Greater Olkaria Volcanic Complex in the Kenya Rift Valley. They were unable to estimate the P–T–Pvol conditions under which the magmas
and, thus, the fluorite had formed because of an absence of suitable geothermometers.
Little insight was gained by Marshall et al. (1998) from published experimental studies of the influence of F on silicic melts. Although many experimental systems contained high F abundances (up to 5 wt%), fluorite had not been found as a near-liquidus phase. Indeed, the only experimental study to report fluorite synthesis in a natural silicic melt was that of Webster et al. (1987) on a glassy topaz rhyolite from Spor Mountain, Utah. Fluorite was formed only in run products near the solidus, 50–70 °C below the biotite stability curve. At Olkaria, fluorite
microphenocrysts can occur in rocks with <5% modal phenocrysts, i.e. it must have been a nearliquidus phase. Marshall et al. (1998) concluded that information on the conditions under which the Olkaria fluorite crystallised would best be gained from direct experimentation.
In this paper, we draw on evidence from experimental studies (Webster et al. 1987 ; Price et al. 1999 ; Scaillet and Macdonald 2001, 2003) to comment on the conditions under which early crystallisation of fluorite may occur in silicic magmas and we derive an empirical model of fluorite stability in peralkaline rhyolite melts. We then discuss the most likely conditions for fluorite stability during magma genesis and crystallisation.
Experimental studies of fluorite stability in magmas
Webster et al. (1987) performed crystallisation experiments on a slightly peraluminous F-rich vitrophyre from Spor Mountain, Utah. They did not attempt to draw a stability field for fluorite in their experiments (at pressures between 50 and 200 MPa). Its appears between the biotite-in curve and the inferred solidus indicates that its crystallisation temperature was propably below 750°C. Petrographic observations show that fluorite belongs to the pre-eruptive phenocryst assemblage. In contrast, topaz, a characteristic mineral of such rhyolites, is reported mainly as a vapour phase mineral, deposited in open vugs or fractures after emplacement of the lava flow (Christiansen et al. 1983). Its occurrence alongside haematite suggests crystallisation during vapour exsolution and oxidation, the latter being in contrast to the pre-eruptive reduced character of the rhyolite, near the fayalite–magnetite–quartz buffer (FMQ), as inferred from Fe–Ti oxides. Pre-eruptive conditions for the sample worked on by Webster et al. (1987) were 705±30 °C, pressure >1 kbar, and melt water content of 5 wt%. Given that the fluorite was interpreted as magmatic, those conditions must also correspond to its crystallisation, in agreement with phase equilibrium constraints.
Price et al. (1999) experimentally determined the stability of titanite and fluorite in the A-type Mount Scott Granite, Oklahoma. Experimental conditions were T =850 °C, P =200 MPa and fO2close to the Ni–NiO buffer (NNO). Titanite crystallised as euhedral crystals and as thin rims on relict titanite and FeTi oxide grains, whereas fluorite formed numerous, <1–2 µm, round grains, mainly associated with large biotite and magnetite crystals. Titanite was stable in runs with F melt contents <1.05 wt%, fluorite in runs with F melt contents >1.05 wt%. This change was independent of melt water content, which varied from 1.5 to 7 wt%. Following Hogan and Gilbert (1995), Price et al. (1999) proposed that titanite and fluorite were in reaction relationship in sub-aluminous magmas, defined as having A/NCK <1.1, through the following equilibrium :
Sub-aluminous granites were then categorised by Price et al.(1999) into low F (titanite only), moderate F (titanite and fluorite) and high F (fluorite only) types. They recognised, however, that this compositional sequence was mirrored by decreasing CaO contents and that titanite stability must be dependent on both Ca and F contents. Nevertheless, they concluded that the presence of primary fluorite within high-temperature, low pressure, moderate fO2, sub-aluminous
felsic rocks indicates high (>1 wt%) magmatic F contents.
Scaillet and Macdonald (2001) presented the results of an experimental study of three peralkaline rhyolitic obsidians from the Kenya Rift Valley. The rocks ranged from trivially peralkaline (ND002; molar (Na2O+K2O)/Al2O3=1.03= agpaitic index) to more strongly peralkaline,
verging on pantelleritic (BL575 and SMN49; ~1.3). Full details of the samples, the experimental and analytical techniques, the experimental results and phase diagrams will not be repeated here. It is sufficient to say that the experimental range examined was from 660–800 °C, at 150 MPa and at two redox conditions: NNO-1.6 (or 1.6 unit log below NNO) and NNO+3.6. We shall
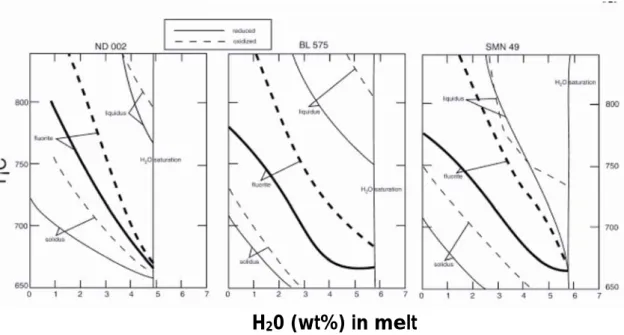
focus our discussion of phase relationships relevant to fluorite stability. These are summarised as fluorite-in stability curves in Fig. 1.
– ND002: At fO2 = NNO-1.6, fluorite occurs mostly in heavily crystallised charges (wt% liquid
<50%) and its stability field runs close and parallel to the solidus (Fig. 1). At NNO+3.6, fluorite crystallises in equilibrium with titanite, its stability field being increased relative to reduced conditions by 10–50°C, depending on melt water contents.
– – BL575: In this composition, at NNO+3.6, fluorite crystallises at ˜ 680 °C at water saturation. Its appearance curve parallels that of quartz and alkali feldspar, such that it precipitates at T>800 _C inmelts with water contents less than _ 2 wt%. Phase relationships at NNO-1.6 differ from those at NNO+3.6, in that Na-amphibole replaces aegirine as the lowest temperature phase and that biotite has a restricted stability field near water saturation (see Scaillet and Macdonald 2001). The fluorite-in curve is similar in shape to that under the more oxidising conditions, yet it is displaced downward by ca. 20–30 °C.
H
20 (wt%) in melt
Fig. 1 Plot of melt-water content against temperature to show the fluorite-in stability curves experimentally determined in three peralkaline rhyolite obsidians by Scaillet and Macdonald (2001, 2003). The curves are for two redox conditions; NN0–1.6 and NNO+3.6. Also shown are the of solidus and liquidus curves for the same rocks under the same redox conditions
– SMN49: The phase relationships in SMN49 at 150 MPa at NNO-1.6 are generally similar to those at the same fO2 in BL575, except that no stability field of oxides was found and there
is a larger temperature difference between the quartz-in and alkali feldspar-in curves. The fluorite-in curve extends to slightly lower temperatures compared with BL575 at high melt-water contents, crystallising at _660 _C at melt-water saturation. As for BL 575, at NNO+3.6, the fluorite-in curve is displaced toward higher temperatures relative to low fO2 conditions, by
ca. 10–50 °C, depending on melt-water contents. Discussion
A significant result of the Scaillet and Macdonald (2001) study is the evidence that fluorite is a stable high-temperature phase in peralkaline rhyolites. Thus, in BL575 and SMN49, fluorite crystallises at temperatures in excess of 800 _C at moderate melt water contents. The fluorite-in curve is, in places, less than 20 _C below that of the liquidus phase. This is perfectly consistent with
petrographic evidence that fluorite co-precipitated with early alkali feldspar in the Olkaria rhyolites (Marshall et al. 1998). Under oxidising conditions (NNO+3.6), the fluoritein curve for SMN49 is displaced, at given melt water contents less than 4–5 wt%, to higher temperatures than that for BL575. The displacement cannot be an effect of either peralkalinity or F content because they are almost identical in both rocks (UK/A ~1.3 and F~1 wt%, respectively, in both compositions). It may, however, be related to the Ca contents of the melts, which is about three times higher in SMN49 than in BL575 (0.29 and 0.10 wt% CaO, respectively). Higher Ca activity in the melt may, therefore, stabilise fluorite crystallisation. On the other hand, the fluorite-in curve for ND002 is displaced, at a given melt water content, to lower temperatures than those of BL575 and SMN49 (Fig. 1), despite its being slightly more calcic than SMN49 (0.44 and 0.29 wt%, respectively). We ascribe this to the more F-rich nature of SMN49 and BL575 ; higher melt F contents thus increases the thermal stability of fluorite. An increase in fO2 increases fluorite stability
in all three compositions, although to different extents. In ND002, the fluorite-in curves for NNO+3.6 and NNO-1.6 converge at melt-water contents higher than 4 wt%. At lower values, they diverge so that fluorite crystallises in the more oxidised charge some 30–40 °C higher than in the more reduced case. Significantly, the co-precipitation of fluorite and titanite under high fO2
suggests that equilibrium (1) cannot fully explain the stability of these phases in peralkaline silicic melts. In SMN49, the fluorite-in curve for NNO-1.6 is located close to that in BL575. That for NNO+3.6 seems, however, to be displaced, at a given temperature, to higher melt water content, except at water saturation. The Ca effect noted above, therefore, may be more marked under oxidising conditions. In both compositions, an increase in fO2 increases the stability
of fluorite, especially at low meltwater contents. The behaviour of fluorite in the Spor Mountain rhyolite experiments is similar to that in ND002, which is only barely peralkaline and has a similar CaO abundance (0.40 wt%). However, the Spor Mountain rhyolite is F-rich (1.2 wt%) and, by analogy with SMN49 and BL575, might be expected to crystallise fluorite at higher temperatures. The explanation may lie in the metaluminous nature of the Spor Mountain rhyolite. Webster et al. (1987) report relatively early crystallisation of plagioclase, particularly in less water-rich melts. This competition for Ca may well have displaced fluorite stability to lower temperatures and/or melt water contents. We suggest therefore, that fluorite is normally absent as an early crystallising phase in metaluminous silicic magmas, except where they are very F-rich (Price et al. 1999). By promoting early plagioclase formation, the excess Al in the melt normally acts to suppress fluorite stability, at least at near-liquidus conditions. A number of field occurrences suggest that, in moderate to strongly peraluminous magmas, fluorite is likely to be replaced by F-rich topaz. The following reaction may account for this substitution:
where ft is fluorite, m is melt and tpz is topaz. This equilibrium implies that, at equivalent levels of F content, an increase in either alumina or silica activities will stabilise topaz over fluorite in silicic melts. The complex CaAl2O4m may be thought of as equivalent to the anorthite activity of the
melt: in peraluminous melts fluorite destabilisation may thus be accompanied by an increase in the anorthite content of the coexisting plagioclase. Given that silica activity generally increases with degree of crystallisation in silicic magmas, reaction (2) predicts that topaz crystallises later than fluorite. However, in F-rich granites and rhyolites, the liquid line of descent trends away from the quartz apex when plotted in the haplogranite system (Manning 1981; Pichavant et al. 1987), which shows that silica activity may decrease during crystallisation. The degree of alumina activity depends primarily on the extent of plagioclase fractionation. Magmas precipitating plagioclase will be prevented from excessive increase in alumina and residual liquids will remain metaluminous all the way down the solidus. In contrast, in peraluminous rhyolites and granites,
crystallisation produces derivatives richer in Al, so long as no strongly peraluminous phases, such as muscovite or andalusite, crystallise (e.g. Pichavant et al. 1987; Scaillet et al. 1995). In these, topaz may appear early relative to fluorite. As noted above, the crystallisation sequence of a topaz rhyolite from Spor Mountain (Webster et al. 1987) indicates fluorite to be the main fluoride phase, not topaz, which suggests that the increase in alumina activity remained moderate during crystallisation. In contrast, topaz crystallising in the Honeycomb rhyolite displays textural characteristics indicative of early crystallisation (Congdon and Nash 1991), and this F-rich rhyolite is indeed richer in alumina than that at Spor Mountain. Note also that, because there is a continuous solid solution between the OH- and F-bearing topaz end members, the water fugacity, and thus the melt water content, may indirectly affect the timing at which reaction (2) operates in silicic magmas, by affecting the OH-F substitution in topaz, and thus its intrinsic thermal stability (Barton 1982). Thus, magmas otherwise similar (particularly in F content), but with different water contents, may crystallise topaz relative to fluorite at different stages. According to Weidner and Martin (1987), high pressure expands topaz stability relative to the tectosilicates, and this may also contribute to early crystallisation of topaz relative to fluorite. Finally, an implication of reaction (2) for plutonic rocks is that fluorite may react out as a result of increasing silica activity during crystallisation, thereby preserving only topaz as a fluoride phase. Thus, a lack of fluorite in holocrystalline rocks does not imply that the magma did not experience fluorite saturation, but rather that silica and/or alumina activities increased beyond the stability field of fluorite. A solubility model for fluorite in peralkaline rhyolites We now use the experimental data of Scaillet and Macdonald (2001, 2003) to build an empirical solubility model for fluorite in peralkaline silicic magmas, similar in principle to those available for other accessory phases in silicic magmas, such as zircon (Watson and Harrison 1983; Baker et al. 2002), monazite (Rapp and Watson 1987; Montel 1993), apatite (Harrison and Watson 1984; Pichavant et al. 1992) and cassiterite (Linnen et al.1995). The rationale has been to select all experimental glasses demonstrably saturated in fluorite (see Scaillet and Macdonald 2001, 2003), and for which the critical compositional data are available (e.g. melt peralkalinity and F content). Then, from standard thermodynamic considerations, we derive an empirical equation to calculate the F content of peralkaline melts equilibrated with fluorite. The critical parameters used to derive the solubility model are reproduced in Table 1. Fluorite crystallisation in silicate melts can be described via the following simple heterogeneous equilibrium :
where m is melt and ft is fluorite. The interaction between fluorite and CaO complexes in silicate melts can be described via the homogeneous equilibrium :
in which F-–and O--are fluorine and oxygen anions in the silicate melt. Reaction (4) states that the
production of one CaF2m complex requires one anion of oxygen to be substituted by two of
fluorine. The oxygens of the silicate melt participating in reaction (4) are those not linked to the tetrahedral framework. Reaction (4) has the following equilibrium constant :
Table 1 Compositional parameters of experimental glasses saturated in fluorite used to derive the empirical model of fluorite solubility in peralkaline rhyolites. ΔNNO the fO2 expressed relative to the Ni–NiO solid buffer; Agp (Na
+K)/Al, in moles; MFe calculated as (Si + Al + Fe3+)/(Na + K+2Ca+Fe2+), using the mole fractions of the respective
elements. The partitioning of iron into Fe2+ and Fe3+ has been calculated using the model of Kress and Carmichael
(1991). The listed oxide concentrations total 100. Actual oxide contents include H2O, Cl, MgO and CaO (Scaillet
and Macdonald 2003)
For melts saturated in fluorite, Eq. (4) can be rewritten as :
whose equilibrium constant is :
Using appropriate standard states for solids and assuming that fluorite is close to stoichiometric CaF2, we have :
A rigorous evaluation of K3 requires that the solution properties of silicate melts be known, which is
currently not the case. We thus make the following simplifying assumptions in order to proceed quantitatively. We firstly assume that O and F anions mix ideally with other melt components. Following the Stolper model (e.g. Silver and Stolper 1985), those complexes are thought to be dominated by bridging and non-bridging oxygens, in addition to free oxygens. There is no way of evaluating exactly the amount of free oxygens in silicate melts, especially hydrous varieties. However, peralkaline melts by definition have an excess of alkalis over alumina. In metaluminous
compositions, most, if not all, Al atoms are tetrahedrally co-ordinated and charge balanced by a neighbouring alkali (Mysen 1988). In peralkaline melts, due to the deficiency in Al, the excess of alkalis is removed from the main tetrahedral framework and is presumably combined with free oxygen anions (Mysen et al. 2003). It follows that the excess of alkalies over alumina (Na + K–Al) can be taken as a proxy of the amount of free oxygen present in the melt. With the ideal approximation, K3 can be written as :
The activity of CaOm cannot be evaluated. However, in the experimental data set of Scaillet and
Macdonald (2001, 2003), variations in melt CaO content are minor. Samples BL575 and SMN 49 have bulk CaO contents of 0.09 and 0.29 wt%, respectively, and fluorite stability fields in both compositions vary only marginally (Fig. 1). This suggests that for these melt compositions the activity terms for CaO are broadly similar. Substituting Na + K–Al for XO– - for the reasons given
above, and assuming that aCaO is constant in our melt compositions, we thus have the simple relationship :
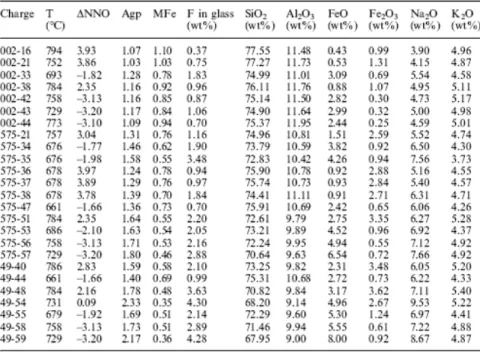
which states that, at fixed P and T, the F content of fluorite-saturated and Ca-poor peralkaline melts is proportional to the square root of excess alkalies times a constant. A log-log plot of XF–-
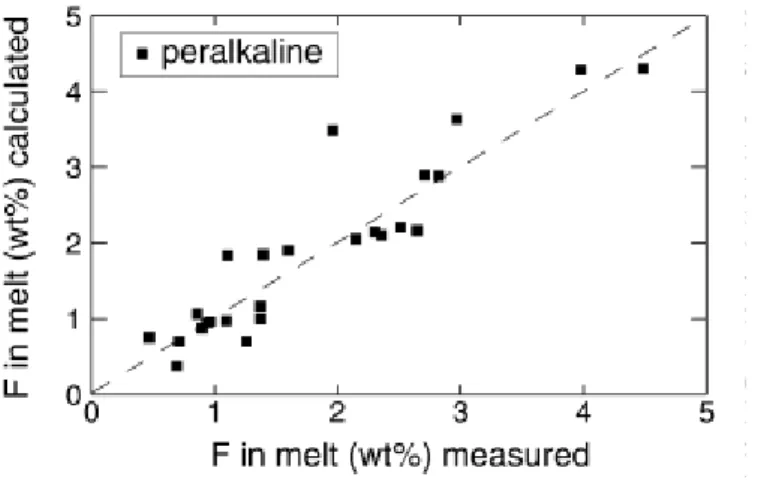
vs. Na + K–Al (Fig. 2) shows that the data indeed define a broad linear trend with an average slope of 0.58, i.e. close to the theoretical one of 0.5, departure being significant in the domain of low peralkalinity, possibly reflecting analytical difficulties in accurately analysing alkalies in hydrous glasses (that is close to the metaluminous divide line, a small error in Na analyses may produce large variations in log scale). The strong correlation between those two parameters suggests that the above approach is qualitatively correct and can serve as a basis for an empirical solubility model. Linear least square regression of the data base using the linearised form of Eq. (6) indeed gives low residuals. However, in order to simplify application of the model to natural rocks, we looked for an expression in which F concentration, instead of its molar fraction, is used to also replace the Na + K–Al difference by the widely used Na + K/Al ratio. Figure 3 shows the relationships between the F content of experimental melts saturated in fluorite versus their peralkalinity, and the overall trend is as good as when XF– is used. We also found that
incorporation of a temperature term significantly improves the fit, although the temperature dependence exhibited by the data set is not as clear as we would wish, in part because of the rather limited temperature range explored (660–800 _C). The simplest empirical equation that best reproduces the data set is:
where Fm is the F content of the melt coexisting with fluorite, and the agpaitic index is calculated
as usual on a molar basis. Implementation of Eq. (7) using additional melt components, in particular CaO and H2O melt contents, or alternative compositional parameters in lieu of
agpaitic index, such as the M cation ratio [Al.Si/(Na+K+2Ca)] as defined by Watson and Harrison (1983) for zircon saturation systematics, all failed to significantly improve the quality of the fit. That
H2Omelt is not needed in the above scheme may seem surprising at first, but it simply reflects the
fact that in the experiments, H2O in the melt and agpaitic index are strongly correlated, so that
any variation in peralkalinity embodies that in H2O. Recent experiments performed by Linnen
(2004) have also shown that water has no detectable influence on the solubility of a variety of accessory minerals in a peralkaline melt. The case for CaO is more complex. In the experiments, the melt CaO content varied between 0.3 and 0.01 wt%. Such a small compositional range precludes a quantitative evaluation of the effect of CaO on fluorite saturation, although this
control is predicted by Eq. (3). Additional experimental constraints are required and, for the time being, we recommend that Eq. (7) be applied only to Ca-poor peralkaline rhyolites. A last aspect of interest lies in the lack of fO2 dependence of F solubility, as expressed by Eq. (7), whilst
the phase relationships of Fig. 1 suggest a more or less strong effect of redox conditions upon fluorite stability. The observed increase of fluorite thermal stability also runs counter to that predicted by the following heterogeneous equilibrium:
Fig. 2 Log–log plot of Na + K–Al difference (moles) versus the mole fraction of fluorine of peralkaline melts equilibrated with fluorite (Scaillet and Macdonald 2003). The theoretical slope of 0.5 is shown dashed
Fig. 3 Plot of Na + K/Al ratio versus the fluorine content of melts equilibrated with fluorite. Black symbols represent peralkaline melt compositions (Scaillet and Macdonald 2003). Grey squares are experiments from Price et al. (1999)
where the subscript g stands for gas. Equilibrium (8) predicts that an increase in fO2 destabilises
fluorite, a trend opposite to experimental results (Fig. 1), if taken at face value. However, this effect is mirrored by increases in solidus and liquidus temperatures with fO2 in all three
compositions (Fig. 1). Thus, for any fixed T–H2O in melt, crystallisation under high fO2 is closer to the
solidus than under low fO2. Given the generally incompatible behaviour of F, this implies that the
co-ordinates. In other words, because high fO2 increases crystallisation at fixed T–H2O in melt, it
leads to higher F2, which drives equilibrium (8) to the right, overcoming any effect due to fO2. In
fact, fitting trials of an equation of the form Eq. (7) in which an fO2 term was explicitly
incorporated, did not decrease the residuals, which suggests that the intrinsic effect of fO2 is
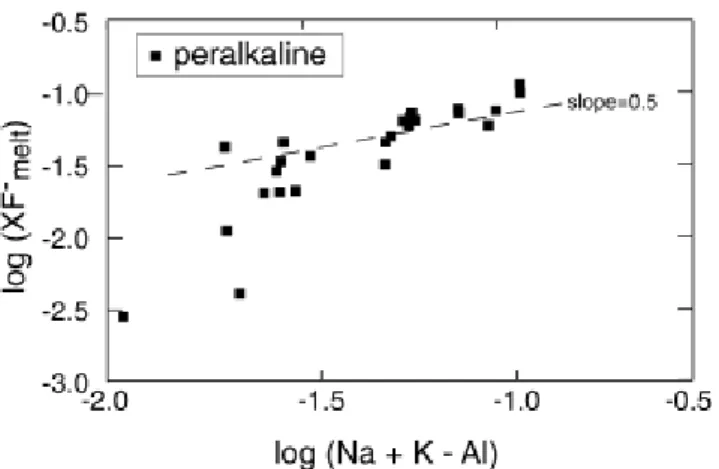
minor compared to that of fF2. Excluding a single outlier, Eq. (7) reproduces the experimental Fmelt to better than 0.5 wt% in the investigated range (Fig. 4)., the difference between calculated and observed concentrations averaging 0.24 wt%. For temperature, the difference between calculated and observed temperatures averages 78 °C, 13 of 24 samples being reproduced to within <50 °C.
Fig. 4 Observed versus calculated F concentrations of experimental fluorite-saturated glasses (Scaillet and Macdonald 2003), using the empirical model of fluorite solubility [Eq. (7), see text for additional explanations]. The dashed line is the 1/1 correlation line
Application of the model to fluorite–phyric peralkaline rhyolites gives maximum temperatures if all the fluorite is phenocrystic, whereas use of the model on fluorite-free rhyolites should give a minimum estimate of magma temperature during extrusion. The temperature calculated for rhyolite SMN49, which is a fluorite-bearing obsidian (Marshall et al. 1998) with residual glass having an agpaitic index of 1.37 and a Fmelt of 1 wt% (Scaillet and Macdonald 2001), is 562 °C, which is
100 °C lower than the preeruptive temperature estimated from phase equilibrium constraints (660 °C). If, however, Fmelt is raised to 1.2 wt%, the calculated temperature is 630 °C, much closer to
the phase equilibrium value, suggesting perhaps that some F loss occurred during eruption or that the reported analysis is slightly low. This illustrates that temperature calculations are extremely sensitive to relatively small variations in either Fmelt or agpaitic index. As an additional
example, charge 002–33 in Scaillet and Macdonald (2001, 2003, Table 1) has an agpaitic index of 1.28 and a Fmelt of 1.83 wt%, which led to a calculated T of 961 °C instead of the 693 °C
measured. If the agpaitic index is raised to 1.4, and Fmelt decreased to 1.6 wt%, the calculated
temperature drops to 730 °C. Temperatures calculated via Eq. (7) should be thus interpreted with caution, especially considering the fact that Na and Fmelt are relatively mobile elements during
crystallisation and secondary hydration of peralkaline rocks. Comparison with metaluminous and peraluminous silicic melts Given that the previous model is based on a direct relationship between excess alkalis over alumina and fluorine, it cannot be used as such on metaluminous or peraluminous melt compositions, even Ca-poor types. This point is illustrated on Fig. 3, where the F contents of weakly to moderately peraluminous melts saturated in fluorite, synthesised by Price et al. (1999), have been plotted against agpaitic index (Table 1). The peraluminous melts exhibit
a solubility trend that is opposite to that displayed by the synthetic peralkaline melts. In peraluminous melts, the Fm content of melts saturated in fluorite seems to increase with increasing
peraluminosity. The lack of fluorite phenocrysts in the F-rich (1.3 wt%), low temperature (620 °C) andalusite-bearing Macusani obsidian (NK/A=0.68, Pichavant et al. 1988) is also indicative of an enhanced solubility of fluorite in peraluminous silicic melts. Crystallisation experiments carried out on the Macusani obsidian produced residual liquids with up to 3.5 wt% F, yet no fluorite was identified (London et al. 1989). Based on phase equilibrium considerations, Manning (1981) has suggested that F forms AlF6 3– units in aluminosilicate melts, evidence for which is the occurrence
of quench cryolite in some run products. Finally, the crystallisation of magmatic topaz as discussed above can be also taken as an indirect evidence of the existence of Al–F complexes in some silicate melts. Therefore, we conclude that the enhanced fluorite solubility in peraluminous relative to metaluminous melts is because part of the F dissolved in the melt is not linked to Ca to form Ca–F complexes, but, instead, is linked to the excess Al. The problem of enhanced fluorite solubility in peraluminous melts relative to metaluminous ones appears to be similar to that of apatite, whose enhanced solubility in peraluminous melts has been explained as due to the existence of P complexes with excess Al (Pichavant et al. 1992). When Fmelt is plotted
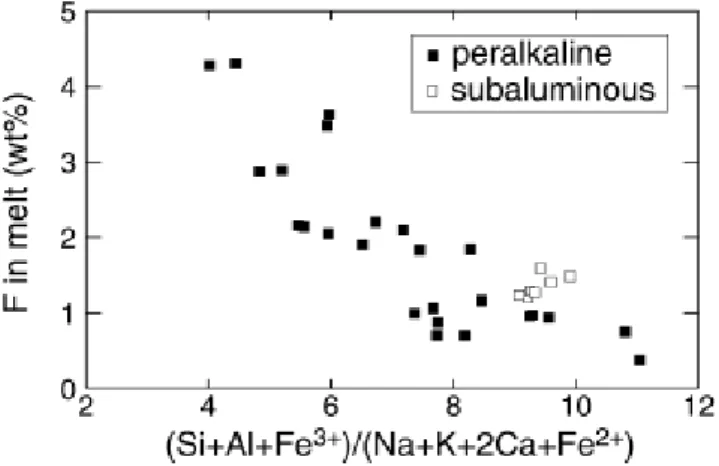
against the cation ratio MFe calculated as :
in which Si....Fe are the mole fractions of the respective elements, the two data sets display generally similar behaviour, the synthetic melts of Price et al. (1999) being, however, displaced towards higher Fmelt content for a given MFe relative to the peralkaline data (Fig. 5), which is
perhaps a result of their higher temperature (850 °C). The ratio MFe is similar to theMparameter of Watson and Harrison (1983), except that it incorporates Fe as either a divalent or a trivalent cation, whose proportions have been calculated with the model of Kress and Carmichael (1991). The inclusion of iron takes into account the fact that, in peralkaline synthetic melts, FeOtotincreases with peralkalinity or degree of crystallisation, reaching values >8 wt% (Scaillet
and Macdonald 2003). At such high levels, it can be anticipated that the Fe content plays an important role in the solution properties of silicic melts. Distinguishing between ferric and ferrous iron is also important because the latter belongs to the network modifier category, whereas the structural role of Fe3+ is believed to be analogous to that of Al3+ in silicate melts (Mysen 1988).
Fig. 5 Plot of the MFe parameter versus the fluorine content of melts equilibrated with fluorite. Black symbols represent peralkaline melt compositions (Scaillet and Macdonald 2003).Grey squares are experiments from Price et al. (1999)
The MFe parameter also takes into account the effect of Ca and, thus, the fact that the synthetic metaluminous melts are richer in Ca than their peralkaline counterparts. Altogether, this compositional parameter can be viewed as the ratio of network-modifying to networkforming cations. However, we note that existing empirical models for calculating the Fe3+/Fe2+ ratio of
silicate melts (e.g. Kress and Carmichael 1991) are still not well calibrated for peralkaline compositions (Gaillard et al. 2001, 2002). The array of data shown on Fig. 5 suggests that a general solubility model of fluorite for all classes of silicic magmas could be derived using a chemical index such as the MFe parameter. However, while it would be easy to model the existing data base using a simple mathematical formalism, the role of some key parameters such as temperature, iron redox state, or melt peraluminosity as discussed above, still need additional experimental constraints. For the time being, the available data can be used to illustrate that magmas having an alumina/alkali balance close to one are possibly those displaying the lowest solubility in fluorite (Fig. 3).
General applications
The solubility model derived in this study can be used to infer the conditions under which fluorite should crystallise in common peralkaline silicic rocks, aside from those on which the phase equilibrium experiments have been performed. In such eruptives, agpaitic indices range up to 2.3, whereas F contents are usually around 0.2–0.4 wt% (Macdonald and Bailey 1973). For such rocks, calculated fluorite saturation temperatures fall in the range 650–750 °C for the less peralkaline varieties, to largely below solidus temperatures for those that are strongly peralkaline (<<500 °C). Thus, if the peralkalinity and F contents of peralkaline obsidians have not been significantly altered during or after extrusion, the solubility model derived in this study confirms that early crystallisation of fluorite is not anticipated in peralkaline rhyolites, unless they are particularly rich in F (>1 wt%), such as at Olkaria. At the level of F contents commonly displayed by peralkaline silicic rocks, only less peralkaline types have the potential to crystallise fluorite early. Plutonic peralkaline rocks often display fluorite (e.g. Upton 1960, 1964; Hamilton 1964; Stormer and Carmichael 1970). During solidification at depth, both Na and F are likely to be lost in significant amounts, as evidenced by the alkali metasomatic aureoles that surround/affect many peralkaline complexes (e.g. Bowden and Turner 1974) and as also shown by the crystallisation behaviour of peralkaline glasses (Noble et al. 1967; Macdonald and Bailey 1973). Obviously such processes may dramatically alter the temperature signature. Application to peralkaline plutonic rocks of the Chilwa, Niger–Nigeria and Lachland Fold Belt intrusive complexes (Bowden and Turner 1974; Woolley and Jones 1987; Whalen et al. 1987) results, however, in temperature maxima of 640 °C for fluorite saturation, which is comparable to those inferred for their extrusive equivalents. Solidus temperatures of silicic magmas are in the range 680–720 °C at ~2 kbar in F-free systems (Tuttle and Bowen 1958), but can be as low as 450–550 °C in magmas with significant amounts of F (Pichavant et al. 1987; Webster et al. 1987; London et al. 1989). This again supports the view that part of the fluorite in F-enriched plutonic rocks is magmatic. Although this survey is by no means exhaustive, it does suggest that, even in plutonic environments, Na and F losses are not necessarily extreme during the final stages of magma solidification. In this respect, Eq. (7) may be viewed as a test of the pristine character of F and Na concentrations in plutonic alkaline rocks.
Implications for crustal anatexis
The insights gained into fluorite stability in peralkaline silicic magmas can be used to infer the general behaviour of this accessory mineral during melting of crustal protoliths. Fluorite has been reported in a number of metamorphic rocks (Bohlen and Essene 1978; Manning and Pichavant 1983), but its relatively small size suggests that it may often be overlooked. To a first approximation, the low saturation temperatures reported above suggest that, unlike zircon, fluorite has little chance of being restitic in most silicic melts produced by partial melting of
crustal lithologies. This depends, however, on the modal abundance of fluorite in metamorphic rocks and on the conditions of melting, in particular, the possibility that melting can occur under fluid-absent or -present conditions. Bohlen and Essene (1978) have explored the topological arrangement of the various mineral equilibria in which fluorite is involved in common metamorphic rocks, and they have calculated their positions in fO2–fF2 space at 7 kbar and 727
°C, which are likely conditions for crustal anatexis. Based on this work, we suggest that a specific reaction is important for the stability of fluorite in marginally peralkaline protoliths during melting in the crust. The critical reaction involves clinopyroxene, quartz and fayalite in addition to fluorite and can be written as :
which will operate under reduced conditions, i.e. below the QFM buffer, which are conditions appropriate for peralkaline magmas in most extensional settings. At fO2 higher than QFM,
magnetite replaces fayalite. This reaction shows that an increase in fF2 displaces the
hedenbergite component from the clinopyroxene. This reaction can take place during melting of a quartzofeldspathic protolith, and the sodic component of the pyroxene may enter the melt, giving it a slightly peralkaline character, i.e. the sodic counterpart of the previous reaction also takes place :
Peralkaline silicic rocks are generally closely associated with mildly alkaline to transitional basalts. Crystallisation and degassing of the basalts may lead to local increases in fF2, which can drive the
two reactions above to the right. Note that reactions (9) and (10) can be equally written by using HF instead of F2, replacing O2 in the right hand sides by H2O, making pyroxene stability sensitive to
variations in water fugacity (fH2O) in lieu of fO2. Specifically, any decrease in fH2O, such as via
fluxing by CO2-rich fluids, will destabilise pyroxene in favour of fluorite. As long as clinopyroxene
and fluorite coexist in reduced partially melted silicic protoliths, reactions (9) and (10) will buffer F2
in the system (provided that fO2 remains more or less constant). If during melting one of the
phases is consumed, presumably fluorite owing to its low modal abundance, then the system runs out of F2 buffering and produces liquids slightly richer in Na via reaction (10). The experiments
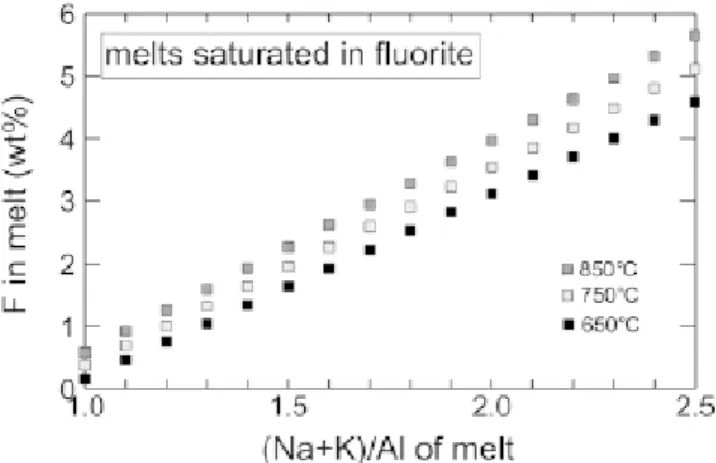
of Scaillet and Macdonald (2003) indicate however that, the Na-enrichment of silicic melts remains moderate as long as clinopyroxene is stable. Only when clinopyroxene has reacted out is a significant increase in melt peralkalinity possible via, for example, subsequent feldspar fractionation, if feldspar is less peralkaline than the coexisting melt. The above considerations remain qualitative because the thermodynamic properties of melts are not sufficiently well known to enable a quantitative evaluation of pyroxene behaviour during partial melting. Our solubility model allows, however, some quantitative estimates to be made about the behaviour of fluorite during crustal anatexis. Fluorite stability in the anatectic melt will be controlled by factors such as the amount and composition of melt produced, the amount of F available, the enclosing relationships of fluorite with the main phases (inter- or intra-grain distribution), the kinetics of fluorite dissolution–crystallisation and the activity–composition relationships of F in silicate melts. In closed systems, given the small amounts of F generally available in the metamorphic protoliths, the extent of F enrichment and, thus, the possibility of fluorite being stable in the source region, may be limited to rather specific conditions. To illustrate this point, Fig. 6 shows the calculated F content of various melts saturated in fluorite at 650, 750 and 850 °C, using Eq. (7). If a rock source contains 0.1 wt% F and perfectly incompatible behaviour during melting is assumed, the melt will have 1 wt% F for a melt fraction of 10 and 0.5 wt% for 20 wt% melt fraction. These are limiting conditions because other F-bearing phases such as micas, amphiboles or apatite will lock up part of the rock’s F budget. At 650 °C, a melt with an agpaitic index of 1.1 will be saturated in fluorite at an F concentration of 0.5 wt%. At 850 °C, nearly twice
this amount is required to reach fluorite saturation. Thus, under fluid-absent conditions, it is likely that protoliths that give rise to strongly peralkaline melts will exhaust all their fluorite budget during melting because of its large solubility in the melt and its low modal abundance in the source. Our results suggest that only at low melt fraction (<10 wt%), and at low temperature (<700 °C) is a marginally peralkaline anatectic melt potentially able to be saturated in fluorite. In contrast, in open systems, where there may be a continuous influx of F, the reactions may proceed until the reactants (pyroxenes) have been consumed, and fluorite may well be stable during a substantial part of the melting interval in the source region, irrespective of the melt composition being produced. Under such conditions, the melts produced will have their F content buffered by the fluorite–melt equilibrium (Fig. 6). Suppose that a melt with an agpaitic index of 1.2 is being produced or stored in the crust at 750 °C. Once fluorite saturation is reached, and if the melt composition remains more or less constant, then the F content will be buffered at a value of ca. 1 wt% (Fig. 6), even if additional amounts of F are introduced into the magma by, for instance, underlying degassing basalts.
Fig. 6 Solubility curves of fluorine in peralkaline silicic melts saturated in fluorite at three temperatures, calculated from Eq. (7). See text for additional explanation
In conclusion, although in contrast to many other accessory minerals the control of fluorite on trace element distribution appears to be negligible (e.g. Marshall et al. 1998), the present work suggests that this phase may have a small, yet decisive, effect on the alkali/alumina balance of melts produced from the melting of subaluminous protoliths. In this respect, fluorite may be the mineralogical expression of the mantle-derived fluxing hypothesis proposed by Bailey and Macdonald (1975, 1987) to account for the F- and alkali-rich characteristics of many evolved rocks in the Kenyan rift.
Acknowledgement : The perceptive and constructive comments of two anonymous reviewers are gratefully
acknowledged References
Bailey DK, Macdonald R (1975) Fluorine and chlorine in peralkaline liquids and the need for magma generation in an open
system. Mineral Mag 40:405–414
Bailey DK, Macdonald R (1987) Dry peralkaline felsic liquids and carbon dioxide flux through the Kenya rift zone. In: Mysen BO (ed) Magmatic processes: physiochemical principles. Geochem Soc Spec Publ 1:91–105
Baker DR, Conte AM, Freda C, Ottolini L (2002) The effect of halogens on Zr diffusion and zircon dissolution in hydrous
Barton MD (1982) The thermodynamic properties of topaz solid solutions and some petrologic applications. Am Mineral
67:956–957
Bohlen SR, Essene EJ (1978) The significance of metamorphic fluorite in the Adirondacks. Geochim Cosmochim Acta
42:1669–1678
Bowden P, Turner DC (1974) Peralkaline and associated ring complexes in the Nigeria–Niger province, West Africa, In:
Sørensen HS (ed) The alkaline rocks. Wiley, Chichester, pp 330–351
Charoy B, Raimbault L (1994) Zr-, Th-, and REE-rich biotite differentiates in the A-type granite pluton of Suzhou (eastern
China): the key role of fluorine. J Petrol 35:919–962
Christiansen EH, Burt DM, Sheridan MF, Wilson RT (1983) The petrogenesis of topaz rhyolites from the western United States. Contrib Mineral Petrol 83:16–30
Collins WJ, Beams SD, White AJR, Chappell BW (1982) Nature and origin of A-type granites with particular reference to
southeastern Australia. Contrib Mineral Petrol 80:189–200
Congdon RD, Nash WP (1989) High-fluorine rhyolite: an eruptive pegmatite magma at the Honeycomb Hills, Utah. Geology
16:1018–1021
Congdon RD, Nash WP (1991) Eruptive pegmatite magma: rhyolite of the Honeycomb Hills, Utah. Am Mineral 76:1261–1278
Gaillard F, Scaillet B, Pichavant M, Be´ ny JM (2001) The effect of water and fO2 on the ferric–ferrous ratio of silicic
melts. Chem Geol 174:255–273
Gaillard F, Scaillet B, Pichavant M (2002) Kinetics of iron oxidation–reduction in hydrous silicic melts. Am Mineral 87:829–837
Hamilton EI (1964) The geochemistry of the northern part of the Ilimaussaq intrusion, SW Greenland. Meddelelser Grønland Bd 162(10)
Happala I (1997) Magmatic and postmagmatic processes in tinmineralized granites: topaz-bearing leucogranite in the Eurajoki Rapakivi granite stock, Finland. J Petrol 38:1645–1659
Harrison TM, Watson EB (1984) The behavior of apatite during crustal anatexis: equilibrium and kinetic considerations. Geochim Cosmochim Acta 48:1467–1477
Hogan JP, Gilbert MC (1995) The A-type Mount Scott Granite sheet. Importance of crustal magma traps. J Geophys Res
100:15779–15792
Hogan JP, Gilbert MC (1997) The intrusive style of A-type sheet granites from the southern Oklahoma aulacogen. In: Ojakangas RW et al. (eds) Middle Proterozoic to Cambrian rifting; midnorth America. Geol Soc Am Spec Pap 312:299–311
King PL, White AJR, Chappell BW, Allen CM (1997) Characterization and origin of aluminous A-type granites from the
Lachlan Fold Belt, southeastern Australia. J Petrol 38:371–391
Kress VC, Carmichael ISE (1991) The compressibility of silicate liquids containing Fe2O3 and the effect of
Linnen RL (2004) The effect of water on accessory phase solubility in subaluminous and peralkaline granitic melts. Lithos (in
press)
Linnen RL, Pichavant M, Holtz F, Burgess S (1995). The effect of fO2 on the solubility, diffusion, and speciation of tin in
haplogranitic melt at 850 °C and 2 kbar. Geochim Cosmochim Acta 59:1579–1588
London D, Morgan GB, Hervig RL (1989) Vapor-undersaturated experiments with Macusani glass + H2O at 200 MPa
, and the internal differentiation of granitic pegmatites. Contrib Mineral Petrol 102:1–17
Macdonald R, Bailey KC (1973) The chemistry of the peralkaline oversaturated obsidians. US Geological Survey Professional Paper 440-N
Manning DAC (1981) The effect of fluorine on liquidus phase relationships in the system Qz–Ab–Or with excess water at
1 kbar. Contrib Mineral Petrol 76:206–215
Manning DAC, PichavantM (1983) The role of fluorine and boron in the generation of granitic melts. In: Atherton MP, Gribble
CD (eds) Migmatites, melting and metamorphism. Shiva, pp 94–109
Marshall AS, Hinton RW, Macdonald R (1998) Phenocrystic fluorite in peralkaline rhyolites, Olkaria, Kenya Rift Valley. Mineral Mag 62:477–486
Montel JM (1993) A model for monazite/melt equilibrium and application to the generation of granitic magmas. Chem Geol
110:127–146
Mysen BO (1988) Structure and properties of silicate melts. Elsevier, New York
Mysen BO, Lucier A, Cody GD (2003) The structural behavior of Al3+ in peralkaline melts and glasses in the system
Na2O–
Al2O3–SiO2. Am Mineral 88:1668–1678
Noble DC, Smith VC, Peck LC (1967) Loss of halogens from crystallised and glassy silicic volcanic rocks. Geochim Cosmochim Acta 31:215–223
Pichavant M, Boher M, Stenger JF, Aissa M, Charoy B (1987) Relations de phase des granites de Beauvoir a` 1 et 3 kbar en
conditions de saturation en H2O. Géol France 1:77–85
Pichavant M, Kontak DJ, Herrera JV, Clark AH (1988) The Miocene–Pliocene Macusani volcanics, SE Peru, I. Mineralogy
and magmatic evolution of two-mica aluminosilicate-bearing ignimbrite suite. Contrib Mineral Petrol 100:300–324 Pichavant M, Montel JM, Richard LR (1992) Apatite solubility in peraluminous liquids: experimental data and an extension of the Harrison–Watson model. Geochim Cosmochim Acta 56:3855–3861
Price JD, Hogan JP, Gilbert MC (1996) Rapakivi texture in the Mount Scott Granite, Wichita Mountains, Oklahoma. Eur J
Mineral 8:435–451
Price JD, Hogan JP, Gilbert MC, London D, Morgan GB VI (1999) Experimental study of titanite–fluorite equilibria in the
A-type Mount Scott Granite; implications for assessing F contents of felsic magma. Geology 27:951–954
Rapp RP, Watson EB (1987) Monazite solubility and dissolution kinetics: implications for the thorium and light rare earth
chemistry of felsic magmas. Contrib Mineral Petrol 94:304–316
Scaillet B, Macdonald R (2001) Phase relations of peralkaline silicic magmas and petrogenetic implications. J Petrol 42:825–845
Scaillet B, Macdonald R (2003) Experimental constraints on the relationships between peralkaline rhyolites of the Kenya Rift
Valley. J Petrol 44:1867–1894
Scaillet B, Pichavant M, Roux J (1995) Experimental crystallisation of leucogranite magmas. J Petrol 36:663–705 Silver L, Stolper EM (1985) A thermodynamic model for hydrous silicate melts. J Geol 93:161–178
Stormer JC, Carmichael ISE (1970) Villiaumite and the occurrence of fluoride minerals in igneous rocks. Am Mineral 55:126–134
Tuttle OF, Bowen NL (1958) Origin of granite in the light of experimental studies in the system NaAlSi3O8–KAlSi3O8–
SiO2–
H2O. Mem Geol Soc Am 74
Upton BGJ (1960) The alkaline igneous complex of Kungnat Fjeld, South Greenland. Meddelelser Grønland Bd 123(4)
Upton BGJ (1964) The geology of Tugtutoq and neighbouring islands, South Greenland. Meddelelser Grønland Bd 169(2)
Watson EB, Harrison TM (1983) Zircon saturation revisited: temperature and composition effects in a variety of crustal
magma types. Earth Planet Sci Lett 64:295–304
Webster JD, Holloway JR, Hervig RL (1987) Phase equilibria of a Be, U and F-enriched vitrophyre from Spor Mountain, Utah.
Geochim Cosmochim Acta 51:389–402
Weidner JR, Martin RF (1987) Phase equilibria of a fluorine-rich leucogranite from the St Austell pluton, Cornwall. Geochim
Cosmochim Acta 51:1591–1597
Whalen JB, Currie KL, Chappell BW (1987) A-type granites: geochemical characteristics, discrimination and petrogenesis.
Contrib Mineral Petrol 95:407–419
Woolley AR, Jones GC (1987) The petrochemistry of the northern part of the Chilwa alkaline province Malawi. In: Fitton JG,