HAL Id: hal-00154314
https://hal.archives-ouvertes.fr/hal-00154314
Submitted on 24 Apr 2020HAL is a multi-disciplinary open access
archive for the deposit and dissemination of sci-entific research documents, whether they are pub-lished or not. The documents may come from teaching and research institutions in France or abroad, or from public or private research centers.
L’archive ouverte pluridisciplinaire HAL, est destinée au dépôt et à la diffusion de documents scientifiques de niveau recherche, publiés ou non, émanant des établissements d’enseignement et de recherche français ou étrangers, des laboratoires publics ou privés.
Electrostatic and electromagnetic emissions near the
plasmasphere. A case event: 27 May 2003
F. El-Lemdani Mazouz, S. Grimald, Jean-Louis Rauch, Pierrette Décréau, G.
Bozan, G. Le Rouzic, X. Suraud, X. Vallières, Jean-Gabriel Trotignon, P.
Canu, et al.
To cite this version:
F. El-Lemdani Mazouz, S. Grimald, Jean-Louis Rauch, Pierrette Décréau, G. Bozan, et al.. Electro-static and electromagnetic emissions near the plasmasphere. A case event: 27 May 2003. Cluster and Double Star Symposium. 5th Anniversary of Cluster in Space. ESA SP-598, Sep 2005, Noordwijk, Netherlands. �hal-00154314�
ELECTROSTATIC AND ELECTROMAGNETIC EMISSIONS NEAR THE
PLASMASPHERE. A CASE EVENT: 27 MAY 2003
F. El-Lemdani Mazouz(1), S. Grimald(1), J.L. Rauch(1), P.M.E. Décréau(1), G. Bozan(1), G. Le Rouzic(1), X. Suraud(1), X. Vallières(1), J. G. Trotignon(1), P. Canu(2), F. Darrouzet(3), S. Boardsen(4).
(1)
LPCE, 3A avenue de la Recherche Scientifique, 45071 Orléans, FRANCE
(2)
CETP,10 avenue de l’Europe, 78140 Vélizy-Villacoublay, FRANCE
(3)
IASB-BIRA, Avenue Circulaire, 3, B- 1180 Brussels, BELGIUM
(4)
NASA, Goddard Space Flight Center, Greenbelt, Maryland, USA
ABSTRACT
We present in this paper a review of electric emissions in the high frequency range (2-80 kHz) by the CLUSTER constellation crossing the outer plasmasphere at its perigee. During the considered
event, dated 27th May 2003, the constellation separation
was large (5000 km) and the geomagnetic activity high (Kp ~ 4 - 5). A large panel of natural emissions are observed, in particular non thermal continuum emissions (NTC) and electrostatic emissions related to
fce, where fce is the local electron gyrofrequency. Intense
NTC emissions visible in the northern hemisphere can be related with simultaneous observations from the IMAGE satellite, informing about large scale beaming properties. We present details about equatorial
emissions at (n+ ½) fce and emissions at (n+1.1) fce
observed at higher latitude. Lastly, intense emissions
near the local plasma frequency fp are observed within
large scale density irregularities.
1. INTRODUCTION.
Plasmasphere is a large toroïdal region of the inner magnetosphere, composed by dense (10–1000
particles/cm3) ion and electron populations of
ionospheric origin trapped along magnetic field lines [1]. Several kinds of natural emissions have been observed in the plasmasphere region by previous satellites [2], [3], such as non thermal continuum
emission (NTC), bandwidth emissions at (n+ ½) fce,
where fce is the local electron gyrofrequency,
plasmaspheric hiss, or chorus.
In this work we are using data of Whisper (Wave of HIgh frequency and Sounder for Probing of Electron density by Relaxation) instrument [4] on the CLUSTER mission [5]. WHISPER instrument records the natural
waves and yields a diagnostic of the electron density ne
using the sounding technique in the band 2-83 kHz. The electron density is related to the plasma frequency by
) ( 9 )
(kHz = n cm−3
fp e . The four identical satellites
(named C1, C2, C3, C4, hereafter) are placed in a
tetrahedron layout with a polar orbit (perigee at 4 RE,
apogee at 19.6 RE). The perigee passes provide excellent
opportunities to study plasmapause equatorial regions
During the 2003, 27th May, plasmasphere crossing,
some of these natural emissions can be observed particularly NTC, Auroral Kilometric Radiation and
electrostatic emission at (n+ ½) fce. In this paper a
detailed examination of the equatorial emissions is presented. NTC emission is also studied using CLUSTER and conjunction with IMAGE satellite.
2. CASE PRESENTATION
During the 27th may 2003, the four CLUSTER
spacecraft cross the plasmasphere between 19 UT and 23 UT. These satellites orbit at 19 hours MLT with a separation of 5000 km. Their orbit configuration is plotted in Fig. 1 in SM coordinates. The magnetic equator is crossed between 20:10 and 21:30 UT
Fig.1 Orbit configuration of the plasmasphere crossing between 19 UT and 23 UT in SM coordinates.
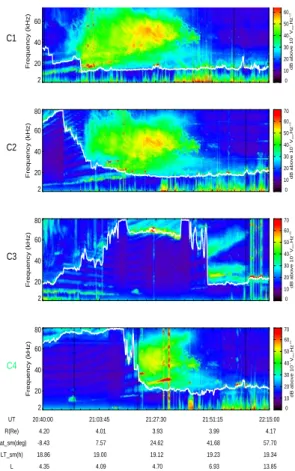
In the spectrograms shown in Fig. 2, we can observe waves recorded by Whisper instrument on the four CLUSTER satellites between 19:00 and 22:10 UT. The orbit parameters are given for C4 in SM coordinates. The plasma frequency is recognized as the narrow banded thermal noise (greenish feature) which rises and falls in frequency position with time, reaching 80 kHz around 20:00 UT for C1. The four time intervals
21 UT
_________________________________________________________________ Proceedings Cluster and Double Star Symposium – 5th Anniversary of Cluster in Space,
at highest frequency values correspond to the four plasmasphere crossings. The plasma frequency variations, hence density variations, along the orbits are not smooth, however. Irregularities and large scale features are showing up. The large scale features seen on both sides of the equator, i.e. at ~ 21:15 UT and 21:45 UT for C3 are plumes, or plasmaspheric tails. Attached to the plasmasphere body, each one is encountered twice, as each satellite crosses the corresponding range of L shells first in the southern hemisphere, then in the northern hemisphere. In this particular case, the main plume is placed closer to the plasmasphere body at smaller longitudes (C3 close-by crossings at ~ 18.8 MLT, compared to larger apart C1 crossings at ~ 19.15 MLT), in contrast with typical plume configuration [6]. 0 10 20 30 40 50 60 70 dB above 10 -7 V rms .Hz -1/2 2 20 40 60 80 Frequency (kHz) C1 0 10 20 30 40 50 60 70 dB above 10 -7 V rms .Hz -1/2 2 20 40 60 80 Frequency (kHz) C2 0 10 20 30 40 50 60 70 dB above 10 -7 V rms .Hz -1/2 2 20 40 60 80 Frequency (kHz) C3 0 10 20 30 40 50 60 70 dB above 10 -7 V rms .Hz -1/2 2 20 40 60 80 Frequency (kHz) C4 UT 19:00:00 19:23:45 19:47:30 20:11:15 20:35:00 20:58:45 21:22:30 21:46:15 22:10:00 R(Re) 5.82 5.37 4.95 4.57 4.26 4.04 3.93 3.96 4.12 Lat_sm(deg) -56.68 -47.89 -37.58 -25.52 -11.60 4.08 20.99 38.14 54.46 LT_sm(h) 17.82 18.17 18.44 18.65 18.83 18.97 19.10 19.21 19.32 Lat_Inv(deg) 76.41 72.90 69.01 65.10 61.86 60.32 61.80 66.41 72.94 L 18.12 11.56 7.79 5.64 4.49 4.08 4.48 6.25 11.62
Fig. 2 Dynamic spectrograms of HF electric field produced by WHISPER
Most emissions appear differently according to the observing satellite, which is not a surprise considering their large separation. Indeed, even electromagnetic emissions propagating mainly in free space (Auroral Kilometric Radiation, AKR, and NTC), which reach thus all SC almost simultaneously, will have encountered different plasma regions along the ray paths, eventually blocking part of the spectrum. This is
the case for instance with the intense AKR radiation appearing shortly after 20 UT. AKR emission will not be further described in this study.
The first emissions we can examine are emissions
related to fce. Equatorial ones, positioned in frequency at
(n+1/2) fce, appear near the magnetic equator on C2
(~20:30 UT), C3 (21:20 UT) and C4 (20:50 UT). Other
emissions related to fce appear for latitudes up to 30
degrees, both in the southern and the northern hemisphere and below the local plasma frequency. Besides, intense emissions are observed near the local
plasma frequency (intensity about 10-5 Vrms m Hz-1 -1/2)
for C3 at about 21:22 UT, i.e. within the density notch placed between the plume and the plasmasphere body. Another type of emission, is observed by C3 in the same region of space: faint, “narrow band” features at
frequency positions along nfce (see blow up in Fig. 8)
Furthermore, we can clearly survey electromagnetic emissions in an energetic and large form between 20:30 and 21:46 UT for C1. Similar emissions appear on C2 and C4 whereas they are blocked on C3, which is travelling inside the outer plasmasphere at this time. We interpret those intense emissions as NTC, owing to the latitude of observation, despite rather unusual spectral characteristics, i.e. narrow band elements, rapidly decreasing with frequency. Satellite C3 crosses an NTC beam shortly after 21:45UT, with spectral characteristics more frequently observed on CLUSTER, i.e. two large frequency bands, here at central frequencies increasing with latitude. Those bands are not visible from the three other viewpoints at that time. Details about both types of NTC are presented below.
3. ELECTROSTATIC EMISSIONS RELATED TO
f
ceIntense emissions related to the electron gyrofrequency are observed during the plasmasphere crossing. These emissions appear at different magnetic latitude and with different forms. Large emissions near
(n+1/2)fce take place near magnetic equator and narrow
bands at (n+1.1)fce come into view at higher magnetic
latitude.
3.1 Equatorial emissions at (n+1/2) fce
The equatorial region of the plasmasphere is a favoured area where wave-particle interaction and wave generation can occur. Near magnetic equator intense
emissions at (n+1/2)fce can take place. These emissions
have been observed for the first time by the mission OGO5 [7].
In the 27th may 2003 CLUSTER perigee pass, the
(n+1/2) fce appear on C2, C3, C4 respectively while no
emission appears in C1. In fig. 3 we can clearly observe different number of harmonics for the three satellites
with various intensities levels and various time durations.
Three harmonics are observed by C2 between 20:25 and
20:37 UT respectively at 1/2 fce,, 3/2 fce and 5/2 fce.,
where fce.=6kHz.
One harmonic is observed by C3 between 21:16 and
21:23 UT at 1/2 fce, where fce.=7kHz.
One harmonic is observed by C4 between 20:49 and
20:55 UT at 1/2 fce, where fce.=8kHz
Fig. 3 Equatorial emissions at (n+1/2) fce.
The good sensitivity of the WHISPER instrument allows a precise determination of the maximum frequency of the harmonic. Intensity variation of the
waves shows a maximum about 10-4 Vrms m-1 Hz-1/2. at
the magnetic equator corresponding to a maximum value of the bandwidth about 3kHz.
3.2 Higher latitude emissions at (n+1.1) fce
Another kind of electrostatic emissions related to fce
can be observed at higher magnetic latitude, both in the northern and in the southern hemisphere. Fig. 4
underlines in white colour one of these “1.1 fce“
emissions. It is observed by C1 between 20:20 and 20:55 UT for the northern hemisphere.
0 10 20 30 40 50 60 70 dB above 10 -7 V rms .Hz -1/2 2 20 40 60 80 Frequency (kHz) C1 UT 20:20:00 20:28:45 20:37:30 20:46:15 20:55:00 R(Re) 4.71 4.66 4.62 4.60 4.58 Lat_sm(deg) 2.67 7.53 12.47 17.47 22.50
Fig. 4 Emission at 1.1 fce recorded by C1
We can observe that these emissions appears below
the plasma frequency and at (n+1.1)fce. They show up
on the four CLUSTER satellites with various numbers of harmonics in each hemisphere.
We have represented the frequency time variation of these emissions in Fig. 5, for each spacecraft. In this figure, the plasma frequency is plotted in black colour,
the experimental (n+1.1) fce in green and the local
corresponding value of (n+1.1)fce is red.
1 9 : 3 0 1 9 : 4 0 1 9 : 5 0 2 0 : 0 0 2 0 : 1 0 2 0 : 2 0 2 0 : 3 0 2 0 : 4 0 2 0 : 5 0 2 1 : 0 0 0 2 0 4 0 6 0 8 0 t i me fr eq ue nc y C1 1 9 : 3 00 1 9 : 4 0 1 9 : 5 0 2 0 : 0 0 2 0 : 1 0 2 0 : 2 0 2 0 : 3 0 2 0 : 4 0 2 0 : 5 0 2 1 : 0 0 2 0 4 0 6 0 8 0 t i me fr eq ue n cy 0 10 20 30 40 50 60 70 dB above 10 -7 V rms .Hz -1/2 C2 2 0 : 3 00 2 0 : 4 0 2 0 : 5 0 2 1 : 0 0 2 1 : 1 0 2 1 : 2 0 2 1 : 3 0 2 1 : 4 0 2 1 : 5 0 2 2 : 0 0 2 0 4 0 6 0 8 0 t i me fr eq u enc y C3 2 0 : 0 00 2 0 : 1 0 2 0 : 2 0 2 0 : 3 0 2 0 : 4 0 2 0 : 5 0 2 1 : 0 0 2 1 : 1 0 2 1 : 2 0 2 1 : 3 0 2 0 4 0 6 0 8 0 t i me fr eq u enc y C4
Fig. 5 Evolution with time of (n+1.1) fce frequencies.
We can observe that these emissions appear in an
harmonic form respectively at 1.1 fce, 2.1 fce, 3.1 fce and
4.1 fce for the four satellites. No emission appear in the
southern hemisphere for C1, whereas one emission appear on C2 (discontinue in time) between 19:00 and 20:00 UT, two emissions for C3 between 20:40 and 21:10 UT, and four emissions for C4 around 20:30 UT. In the northern hemisphere, we can notice four emissions on C1, two emissions on C2, one emission on C3 and two emissions on C4.
4. NON THERMAL CONTINUUM EMISSION
NTC radiation is an electromagnetic wave of weak intensity, observed usually during long time intervals. steady in time It has first been observed in the Earth environment at frequencies above 500 Hz [8] and propagating in the L-O mode [9].
In this case event, NTC emissions are observed by three of the four CLUSTER satellites at a particularly intense level, as stated above, in this particular case up
to 10-5 Vrms m-1 Hz-1/2. Electromagnetic emissions 2 10 20 30 40 Frequency (kHz) C2 UT 20:25:00 20:28:00 20:31:00 20:34:00 20:37:00 R(Re) 4.50 4.48 4.45 4.43 4.41 Lat_sm(deg) -4.28 -2.54 -0.78 0.99 2.78 7 7//22 ffcce e 5 5//22 ffcce e 3 3//22 ffcce e 0 10 20 30 40 50 60 70 dB above 10 -7 V rms .Hz -1/2 2 10 20 30 40 Frequency (kHz) C3 UT 21:13:00 21:16:00 21:19:00 21:22:00 21:25:00 R(Re) 4.33 4.30 4.27 4.25 4.22 Lat_sm(deg) -4.11 -2.28 -0.42 1.47 3.37 3 3//22 ffccee 0 10 20 30 40 50 60 70 dB above 10 -7 V rms .Hz -1/2 2 10 20 30 40 Frequency (kHz) C4 UT 20:46:00 20:49:00 20:52:00 20:55:00 20:58:00 R(Re) 4.14 4.12 4.09 4.07 4.04 Lat_sm(deg) -4.53 -2.54 -0.53 1.51 3.57 3 3//22 ffccee
observed by the IMAGE satellite during the time span of the studied event is shown in Fig. 6.
Fig. 6 IMAGE observation of AKR and NTC The two successive AKR features showing up between 20:00 and 20:40 UT match in time the two main AKR occurrences observed on C3 (Fig.2). The emissions observed after 20:50 UT match in time and frequency the intense NTC occurrence observed by C1, C2 and C4. The orbit configuration of the four observatories between 20:55 and 21:40 UT is shown in Fig .7. 0 1 2 3 4 5 6 7 YGSE -4 -2 0 2 4 6 ZGSE
Fig . 7 Orbit configuration of C1, C2, C4 and IMAGE (deep purple) in GSE coordinates (20:55 – 21:40 UT) A blow up of WHISPER observation of NTC is shown in Fig. 8. NTC appears after the plasmasphere crossing: between 20:50 and 21:50 UT for C1 and C2 in a large and energetic form covering the 20 to 80 kHz band. C4 observes the same phenomenon for a shorter time period. The extinction of the waves below the plasma frequency (plotted as a white line in the figure) indicates a cut off frequency of the ordinary mode. IMAGE observation of the continuum, displayed in Fig. 6, shows the same large and energetic band. NTC observation by IMAGE is made at the same time as by CLUSTER. Moreover, Fig. 7 indicates that it is observed at the same magnetic latitude range. We interpret this as all four observatories, C1, C2, C4 and IMAGE being placed in the same large scale NTC beam. 0 10 20 30 40 50 60 dB above 10 -7 V rms .Hz -1/2 2 20 40 60 Frequency (kHz) C1 0 10 20 30 40 50 60 70 dB above 10 -7 V rms .Hz -1/2 2 20 40 60 80 Frequency (kHz) C2 0 10 20 30 40 50 60 70 dB above 10 -7 V rms .Hz -1/2 2 20 40 60 80 Frequency (kHz) C3 0 10 20 30 40 50 60 70 dB above 10 -7 V rms .Hz -1/2 2 20 40 60 80 Frequency (kHz) C4 UT 20:40:00 21:03:45 21:27:30 21:51:15 22:15:00 R(Re) 4.20 4.01 3.93 3.99 4.17 Lat_sm(deg) -8.43 7.57 24.62 41.68 57.70 LT_sm(h) 18.86 19.00 19.12 19.23 19.34 L 4.35 4.09 4.70 6.93 13.85
Fig. 8 Blow up of NTC emissions observed by CLUSTER
One hour later C3, going out from the plasmasphere, encounters an NTC beam with different spectral characteristics, as indicated in section 2. Such spectral forms, i.e. smooth frequency bands at weak intensity are observed more frequently. A close look at NTC forms observed on C4 around 21:30 UT (Fig. 8) indicates that C4 observes both types of NTC superposed: the intense beam (with falling frequency tunes), and the weaker form (above 60 kHz, with globally rising frequency tunes). The latter form does not match (in time and frequency) similar features shown on C3. It is likely, thus, that the second type of NTC is linked to spatial properties of the beams, rather than to temporal properties.
5. CONCLUSION
Several kinds of natural emissions have been observed
during the 27th May 2003 plasmasphere crossing.
Emissions related to the local gyrofrequency fce have
been observed near equatorial regions at (n+1/2) fce and
at higher magnetic latitude at (n+1.1) fce. Intense NTC
continuum features have been observed in conjunction with IMAGE satellite, i.e. at the same time and at the same magnetic latitude, showing that all SC are placed inside the same beam. Further analysis is needed to explore possible relationships between some of the
various electrostatic emissions observed and the generation of NTC.
6. REFERENCES
1. Lemaire, J. F., and K. I. Gringauz, The Earth’s
plasmasphere, Cambridge Univ. Press, Cambridge,
1998
2. Christiansen, P. J., Gough, M. P., Martelli, G., Bloch, J. J., Cornilleau, N., Etcheto, J., Gendrin, R., Beghin, C., Décréau, P. M. E., and Jones, D.: “Geos-1 observations of electrostatic waves and their relationship with plasma parameters”, Space. Sci. Rev., 22,283–400, 1978. 3. Olsen, R. C. ,S. D Shawhan, D. L. Gallagher, J. L. Green, C. R. Chappel, and R. R. Anderson, “Plasma observations at the earth’s magnetic equator”, J.
Geophys. Res., 92, 2385, 1987.
4. Décréau, P. M. E., Fergeau, P., Krasnoselskikh, V., Lévêque, M., Martin, Ph., Randriamboarison, O., Sené, F. X., Trotignon, J. G., Canu, P., Mogensen, P. B., and Whisper investigators, “Whisper, a resonance sounder and wave analyser: performances and perspectives for the CLUSTER mission”, Space Sci. Rev., 79, 157–193,
1997.
5. Escoubet, C. P., Russell, C. T., and Schmidt, R. The
Cluster and Phoenix Missions, Kluwer Academic
Publishers, 1997.
6. Darrouzet, F., De Keyser, J., Décréau, P. M. E., Gallagher, D. L., Pierrard, V., Lemaire, J. F., Sandel, B. R., Dandouras, I., Matsui, H., Dunlop, M., Cabrera, J., Masson, A., Canu, P., Trotignon, J. G., Rauch, J. L., André, M, Analysis of plasmaspheric plumes: CLUSTER and IMAGE observations and numerical simulations, Cluster and Double Star symposium 5th
anniversary of Cluster in Space,this issue.
7. Kennel, C. F., F. V. Scarf, R. W. Fredricks, J. H. Mcgehee, and F. V. Coroniti, VLF electric field observations in the magnetosphere, J. Geophys. Res., 75, 6136 1970.
8. Gurnett, D. A., The earth as a radio source: the nonthermal continuum, J. Geophys. Res., 80, 2751, 1975.
9. Gurnett, D. A., W. Calvert, R. L. Huff, D. Jones, and M. Sugiura, The polarization of escaping terrestrial continuum radiation, J. Geophys. Re., 93, 12817, 1988.