HAL Id: inserm-01150367
https://www.hal.inserm.fr/inserm-01150367
Submitted on 11 May 2015
HAL is a multi-disciplinary open access
archive for the deposit and dissemination of
sci-entific research documents, whether they are
pub-lished or not. The documents may come from
teaching and research institutions in France or
abroad, or from public or private research centers.
L’archive ouverte pluridisciplinaire HAL, est
destinée au dépôt et à la diffusion de documents
scientifiques de niveau recherche, publiés ou non,
émanant des établissements d’enseignement et de
recherche français ou étrangers, des laboratoires
publics ou privés.
Alcohol consumption, drinking patterns, and cognitive
function in older Eastern European adults.
Pia Horvat, Marcus Richards, Ruzena Kubinova, Andrzej Pajak, Sofia
Malyutina, Sergey Shishkin, Hynek Pikhart, Anne Peasey, Michael Marmot,
Archana Singh-Manoux, et al.
To cite this version:
Pia Horvat, Marcus Richards, Ruzena Kubinova, Andrzej Pajak, Sofia Malyutina, et al.. Alcohol
consumption, drinking patterns, and cognitive function in older Eastern European adults..
Neurol-ogy, American Academy of NeurolNeurol-ogy, 2015, 84 (3), pp.287-95. �10.1212/WNL.0000000000001164�.
�inserm-01150367�
Pia Horvat, PhD
Marcus Richards, PhD
Ruzena Kubinova, MD
Andrzej Pajak, MD, PhD
Sofia Malyutina, MD,
PhD
Sergey Shishkin, MD
Hynek Pikhart, PhD
Anne Peasey, PhD
M.G. Marmot, FRCP
Archana Singh-Manoux,
PhD
Martin Bobak, MD, PhD
Correspondence to Dr. Horvat: [email protected] Supplemental data at Neurology.orgAlcohol consumption, drinking patterns,
and cognitive function in older Eastern
European adults
ABSTRACT
Objective:
To investigate associations of frequency, quantity, binge, and problem drinking with
cognitive function in older Eastern European adults.
Methods:
The investigation included 14,575 participants, aged 47 to 78 years at cognitive
assessment in 2006–2008 from Novosibirsk (Russia), Krakow (Poland), and 6 Czech towns
par-ticipating in the HAPIEE (Health, Alcohol, and Psychosocial Factors in Eastern Europe)
prospec-tive cohort study. Average response rates were 59% at baseline (2002–2005) and 63% in
2006–2008. Alcohol consumption was assessed at baseline and in 2006–2008. Cognitive tests
included immediate and delayed word recall, semantic fluency (animal naming), and letter
cancel-lation. Associations between alcohol indices and cognitive scores were analyzed
cross-sectionally (all measures from 2006 to 2008) and prospectively (alcohol and covariates from
2002 to 2005 and cognition from 2006 to 2008).
Results:
In cross-sectional analyses, nondrinkers had lower cognitive scores and female moderate
drinkers had better cognitive performance than light drinkers. Heavy, binge, and problem drinking
were not consistently associated with cognitive function. Few associations were replicated in
prospective analyses. Participants who stopped drinking during follow-up had worse cognition
than stable drinkers; in men, regression coefficients (95% confidence interval) ranged from
20.26 (20.36, 20.16) for immediate recall to 20.14 (20.24, 20.04) for fluency.
Conclusion:
Regular and episodic heavy drinking were not consistently associated with cognitive
function. Worse cognition in participants who stopped drinking during follow-up suggests that
inclusion of less healthy ex-drinkers may partly explain poorer cognition in nondrinkers.
Neurology®2015;84:287–295GLOSSARY
CAGE5 cutting down, annoyance by criticism, guilty feeling, and eye-openers; CVD 5 cardiovascular disease; GFQ 5 graduated frequency questionnaire; HAPIEE5 Health, Alcohol, and Psychosocial Factors in Eastern Europe.
Cognitive function is essential for well-being and independent living and is a strong predictor of
dementia.
1Better cognitive test performance as well as lower risk of all types of dementia in light
to moderate drinkers than abstainers has been widely reported by observational studies,
2but
more research is needed to better understand whether the observed relationship is causal or
merely associational.
Chronic heavy alcohol misuse is known to cause neurocognitive impairment, but results
of population-based studies in older adults are inconsistent, with some showing an inverted
U-shaped association (i.e., worse cognition in heavy drinkers and abstainers),
3,4some showing
a linear protective effect,
5and some showing subgroup-specific
6or cognitive domain–specific
associations,
3,7although a recent study reported faster cognitive decline in heavy vs moderate
From the Department of Epidemiology & Public Health (P.H., H.P., A. Peasey, M.G.M., A.S.-M., M.B.), and MRC Unit for Lifelong Health and Ageing at UCL (M.R.), University College London, UK; National Institute of Public Health (R.K.), Prague, Czech Republic; Department of Epidemiology and Population Studies (A. Pajak), Jagellonian University Collegium Medicum, Krakow, Poland; Institute of Internal and Preventive Medicine Siberian Branch under the Russian Academy of Medical Sciences (S.M., S.S.), Novosibirsk; Novosibirsk State Medical University (S.M.), Novosibirsk, Russia; and INSERM (A.S.-M.), U1018, Hopital Paul Brousse, Villejuif, France.Go to Neurology.org for full disclosures. Funding information and disclosures deemed relevant by the authors, if any, are provided at the end of the article. The Article Processing Charge was paid by Wellcome Trust.
This is an open access article distributed under the Creative Commons Attribution License, which permits unrestricted use, distribution, and reproduction in any medium, provided the original work is properly cited.
drinkers.
8These inconsistencies may partly
reflect the relatively small numbers of heavy
drinkers in most studies.
9Potential effects of regular or episodic heavy
drinking (binge drinking) on cognition have
received less empirical attention. We identified
2 reports from one cohort, in which binge
drinking was found to increase the risk of
cog-nitive impairment
10and dementia.
11There is
emerging evidence that binge drinking
indepen-dently increases cardiovascular disease (CVD)
risk,
12and because CVD is associated with
cog-nitive aging,
13a link between binge drinking
and cognitive function seems plausible.
Our aim was to investigate the associations
of quantity, frequency, binge, and problem
drinking with cognitive function in older
adults, using data from 3 Eastern European
populations, where alcohol is an important
cause of morbidity and premature mortality.
14METHODS Study populations and participants. The HAPIEE (Health, Alcohol, and Psychosocial Factors in Eastern Europe) Study is a multicenter prospective cohort study con-ducted in Novosibirsk (Russia), Krakow (Poland), and 6 Czech towns. Details of the study protocol have been reported else-where.15Briefly, 28,947 men and women aged 45 to 69 years
at baseline (2002–2005) were randomly selected from population registers and electoral lists (Novosibirsk). Response rates were 61% in Krakow and Novosibirsk and 55% in Czech towns. At baseline, participants completed an extensive health questionnaire and a brief physical examination. Russian and Czech participants were invited for examination in a clinic, while Polish participants were visited and examined in their homes. Reexamination of participants was completed in 2006–2008 (response rate 63%). At baseline, cognitive tests were performed on all participants older than 60 years, and in a random sample of approximately 20% of adults aged 45 to 59 years (n5 12,594). At reexamina-tion, cognition was assessed in all returning participants (n5 17,543). The eligible sample for this study consisted of all par-ticipants with cognitive data at reexamination; for 54% (n5 9,436) of them, it was their first assessment of cognitive function.
Standard protocol approvals, registrations, and patient consents.The study was approved by ethics committees at Uni-versity College London and UniUni-versity College Hospital and local ethics committees in each participating center. All participants gave written informed consent.
Measurements. Cognitive function (assessed 2006–2008).
Cognitive function was assessed by trained nurses using 4 neuro-psychological tests. First, 10-word list recall was used to assess verbal memory and learning. Word lists, consisting of 10 com-mon nouns, were the same in each center. Immediate recall was assessed by correctly recalled words summed over 3 consecutive 1-minute trials (range 0–30). Delayed recall was assessed after an interval during which other cognitive tests were administered (range 0–10). Second, verbal fluency was assessed by asking participants to name as many animals as possible within 1 min-ute. Third, letter cancellation test was used to assess attention,
mental speed, and concentration. Participants were instructed to cross out 2 target letters, P and W (P andШ in Novosibirsk), embedded in a random letter grid as quickly and as accurately as possible within 1 minute (range 0–65).
Alcohol consumption (assessed 2002–2005 and 2006– 2008). Self-reported alcohol intake in the past year was measured using the graduated frequency questionnaire (GFQ).16The
base-line questionnaire contained 9 mutually exclusive categories of frequency (ranging from“never” to “almost every day”) and 6 mutually exclusive categories of amounts, expressed in local units of beer, wine, and spirits ($10, 7–9, 5–6, 3–4, 1–2, and 0.5 drink; 1 drink equals 0.5 L of beer, 0.2 L of wine, and 0.05 L of spirits or 20 g of ethanol). Because only 3 categories of amounts ($5, 3–4, 2–0.5 drinks) were used at reexamination, the data were harmonized across the waves. Several alcohol indices were derived from harmonized GFQ data for both data waves. First, drinking frequency in the past year was categorized as follows: never,,1 monthly, 1–3 times monthly, 1–4 times weekly, and 51 times weekly. Second, the frequency of consuming a given number of alcoholic drinks in the past year was converted into total amount of alcohol consumed in grams and divided by 365 to obtain an estimate of average daily alcohol consumption. Partic-ipants were then grouped into 4 categories of average daily alcohol intake, using lower cutoffs in women: nondrinkers (0 g/d), light (#5/10 g/d), moderate (5–20/10–40 g/d), and heavy drinkers ($20/40 g/d). Third, binge drinking was defined as consuming $60 and 100 g of ethanol in women and men in one episode at least monthly. Baseline information on long-term abstention was not available. Therefore, for all measures, participants reporting no alcohol consumption in the past year were categorized as nondrinkers. Weekly alcohol consumption and alcohol intake in the last 3 months were also available, but were not used for these analyses, because they correlated strongly with the GFQ.
Finally, using average daily alcohol intake at baseline and re-examination, participants were categorized into the following: sta-ble nondrinkers (consistently abstained), ex-drinkers (abstained at follow-up but not baseline), stable drinkers (stable consumption), reduced drinking (higher consumption at baseline), increased drinking (higher consumption at follow-up), and those who started drinking (abstained at baseline but not follow-up).
Problem drinking (assessed 2002–2005 and 2006–2008). Problem drinking was assessed by the CAGE (cutting down, annoyance by criticism, guilty feeling, and eye-openers) ques-tionnaire17on both survey occasions. Positive responses to 2 or
more items indicate potential problem drinking.
Covariates (assessed 2002–2005 and 2006–2008). Covari-ates included study center, age, education (primary or less, voca-tional, secondary, and university), household asset index (microwave, dishwasher, washing machine, color TV, car, freezer, satellite TV, VCR, camcorder, mobile phone and telephone; range 0–11 for the number of items owned), smoking status (never, current, former), leisure-time physical activity (none vs some), high depressive symptoms (yes vs no) measured by the CESD-10 (Center for Epidemiologic Studies Depression Scale), and self-reported chronic conditions (CVD, diabetes, and hypertension; all yes vs no). Because some of the health con-ditions could either mediate or confound the association between alcohol and cognition, we show analyses unadjusted and adjusted for chronic conditions.
Statistical analysis.Cognitive test results obtained at reexami-nation, the main outcome of these analyses, were converted to z scores (mean5 0; SD 5 1) using whole sample means and SDs to allow comparison between tests. Cross-sectional and prospective associations between alcohol and cognitive
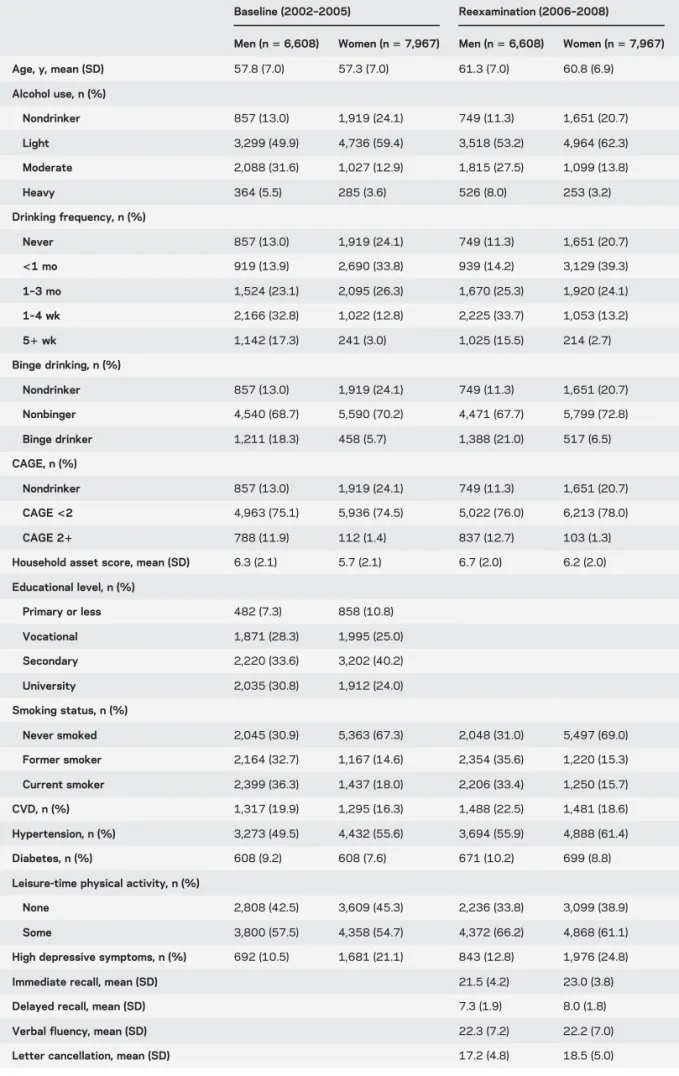
Table 1 Descriptive characteristics of the study sample
Baseline (2002–2005) Reexamination (2006–2008) Men (n5 6,608) Women (n5 7,967) Men (n5 6,608) Women (n5 7,967) Age, y, mean (SD) 57.8 (7.0) 57.3 (7.0) 61.3 (7.0) 60.8 (6.9) Alcohol use, n (%) Nondrinker 857 (13.0) 1,919 (24.1) 749 (11.3) 1,651 (20.7) Light 3,299 (49.9) 4,736 (59.4) 3,518 (53.2) 4,964 (62.3) Moderate 2,088 (31.6) 1,027 (12.9) 1,815 (27.5) 1,099 (13.8) Heavy 364 (5.5) 285 (3.6) 526 (8.0) 253 (3.2) Drinking frequency, n (%) Never 857 (13.0) 1,919 (24.1) 749 (11.3) 1,651 (20.7) <1 mo 919 (13.9) 2,690 (33.8) 939 (14.2) 3,129 (39.3) 1–3 mo 1,524 (23.1) 2,095 (26.3) 1,670 (25.3) 1,920 (24.1) 1–4 wk 2,166 (32.8) 1,022 (12.8) 2,225 (33.7) 1,053 (13.2) 51 wk 1,142 (17.3) 241 (3.0) 1,025 (15.5) 214 (2.7) Binge drinking, n (%) Nondrinker 857 (13.0) 1,919 (24.1) 749 (11.3) 1,651 (20.7) Nonbinger 4,540 (68.7) 5,590 (70.2) 4,471 (67.7) 5,799 (72.8) Binge drinker 1,211 (18.3) 458 (5.7) 1,388 (21.0) 517 (6.5) CAGE, n (%) Nondrinker 857 (13.0) 1,919 (24.1) 749 (11.3) 1,651 (20.7) CAGE<2 4,963 (75.1) 5,936 (74.5) 5,022 (76.0) 6,213 (78.0) CAGE 21 788 (11.9) 112 (1.4) 837 (12.7) 103 (1.3) Household asset score, mean (SD) 6.3 (2.1) 5.7 (2.1) 6.7 (2.0) 6.2 (2.0) Educational level, n (%) Primary or less 482 (7.3) 858 (10.8) Vocational 1,871 (28.3) 1,995 (25.0) Secondary 2,220 (33.6) 3,202 (40.2) University 2,035 (30.8) 1,912 (24.0) Smoking status, n (%) Never smoked 2,045 (30.9) 5,363 (67.3) 2,048 (31.0) 5,497 (69.0) Former smoker 2,164 (32.7) 1,167 (14.6) 2,354 (35.6) 1,220 (15.3) Current smoker 2,399 (36.3) 1,437 (18.0) 2,206 (33.4) 1,250 (15.7) CVD, n (%) 1,317 (19.9) 1,295 (16.3) 1,488 (22.5) 1,481 (18.6) Hypertension, n (%) 3,273 (49.5) 4,432 (55.6) 3,694 (55.9) 4,888 (61.4) Diabetes, n (%) 608 (9.2) 608 (7.6) 671 (10.2) 699 (8.8) Leisure-time physical activity, n (%)
None 2,808 (42.5) 3,609 (45.3) 2,236 (33.8) 3,099 (38.9) Some 3,800 (57.5) 4,358 (54.7) 4,372 (66.2) 4,868 (61.1) High depressive symptoms, n (%) 692 (10.5) 1,681 (21.1) 843 (12.8) 1,976 (24.8) Immediate recall, mean (SD) 21.5 (4.2) 23.0 (3.8) Delayed recall, mean (SD) 7.3 (1.9) 8.0 (1.8) Verbal fluency, mean (SD) 22.3 (7.2) 22.2 (7.0) Letter cancellation, mean (SD) 17.2 (4.8) 18.5 (5.0)
Abbreviations: CAGE5 cutting down, annoyance by criticism, guilty feeling, and eye-openers; CVD 5 cardiovascular disease.
Figures are means (SDs) for continuous variables and counts (%) for categorical variables. For categories of average daily alcohol intake (lower cutoffs are for women): nondrinker 0 g, light #5/10 g, moderate 5–20/10–40 g, and heavy $20/40 g. Neurology 84 January 20, 2015 289
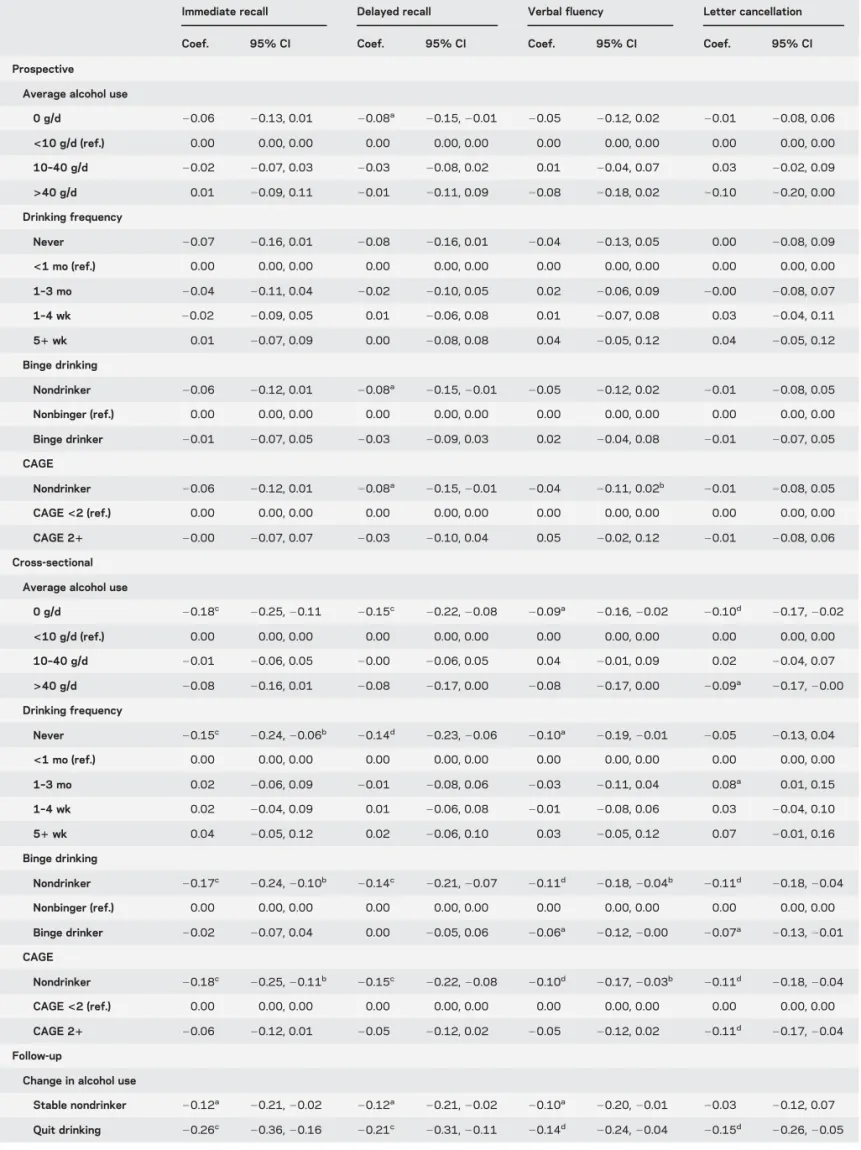
Table 2 Regression results for alcohol consumption and standardized cognitive scores in men (n5 6,608)
Immediate recall Delayed recall Verbal fluency Letter cancellation
Coef. 95% CI Coef. 95% CI Coef. 95% CI Coef. 95% CI Prospective
Average alcohol use
0 g/d 20.06 20.13, 0.01 20.08a 20.15, 20.01 20.05 20.12, 0.02 20.01 20.08, 0.06 <10 g/d (ref.) 0.00 0.00, 0.00 0.00 0.00, 0.00 0.00 0.00, 0.00 0.00 0.00, 0.00 10–40 g/d 20.02 20.07, 0.03 20.03 20.08, 0.02 0.01 20.04, 0.07 0.03 20.02, 0.09 >40 g/d 0.01 20.09, 0.11 20.01 20.11, 0.09 20.08 20.18, 0.02 20.10 20.20, 0.00 Drinking frequency Never 20.07 20.16, 0.01 20.08 20.16, 0.01 20.04 20.13, 0.05 0.00 20.08, 0.09 <1 mo (ref.) 0.00 0.00, 0.00 0.00 0.00, 0.00 0.00 0.00, 0.00 0.00 0.00, 0.00 1–3 mo 20.04 20.11, 0.04 20.02 20.10, 0.05 0.02 20.06, 0.09 20.00 20.08, 0.07 1–4 wk 20.02 20.09, 0.05 0.01 20.06, 0.08 0.01 20.07, 0.08 0.03 20.04, 0.11 51 wk 0.01 20.07, 0.09 0.00 20.08, 0.08 0.04 20.05, 0.12 0.04 20.05, 0.12 Binge drinking Nondrinker 20.06 20.12, 0.01 20.08a 20.15, 20.01 20.05 20.12, 0.02 20.01 20.08, 0.05 Nonbinger (ref.) 0.00 0.00, 0.00 0.00 0.00, 0.00 0.00 0.00, 0.00 0.00 0.00, 0.00 Binge drinker 20.01 20.07, 0.05 20.03 20.09, 0.03 0.02 20.04, 0.08 20.01 20.07, 0.05 CAGE Nondrinker 20.06 20.12, 0.01 20.08a 20.15, 20.01 20.04 20.11, 0.02b 20.01 20.08, 0.05 CAGE<2 (ref.) 0.00 0.00, 0.00 0.00 0.00, 0.00 0.00 0.00, 0.00 0.00 0.00, 0.00 CAGE 21 20.00 20.07, 0.07 20.03 20.10, 0.04 0.05 20.02, 0.12 20.01 20.08, 0.06 Cross-sectional
Average alcohol use
0 g/d 20.18c 20.25, 20.11 20.15c 20.22, 20.08 20.09a 20.16, 20.02 20.10d 20.17, 20.02 <10 g/d (ref.) 0.00 0.00, 0.00 0.00 0.00, 0.00 0.00 0.00, 0.00 0.00 0.00, 0.00 10–40 g/d 20.01 20.06, 0.05 20.00 20.06, 0.05 0.04 20.01, 0.09 0.02 20.04, 0.07 >40 g/d 20.08 20.16, 0.01 20.08 20.17, 0.00 20.08 20.17, 0.00 20.09a 20.17, 20.00 Drinking frequency Never 20.15c 20.24, 20.06b 20.14d 20.23, 20.06 20.10a 20.19, 20.01 20.05 20.13, 0.04 <1 mo (ref.) 0.00 0.00, 0.00 0.00 0.00, 0.00 0.00 0.00, 0.00 0.00 0.00, 0.00 1–3 mo 0.02 20.06, 0.09 20.01 20.08, 0.06 20.03 20.11, 0.04 0.08a 0.01, 0.15 1–4 wk 0.02 20.04, 0.09 0.01 20.06, 0.08 20.01 20.08, 0.06 0.03 20.04, 0.10 51 wk 0.04 20.05, 0.12 0.02 20.06, 0.10 0.03 20.05, 0.12 0.07 20.01, 0.16 Binge drinking Nondrinker 20.17c 20.24, 20.10b 20.14c 20.21, 20.07 20.11d 20.18, 20.04b 20.11d 20.18, 20.04 Nonbinger (ref.) 0.00 0.00, 0.00 0.00 0.00, 0.00 0.00 0.00, 0.00 0.00 0.00, 0.00 Binge drinker 20.02 20.07, 0.04 0.00 20.05, 0.06 20.06a 20.12, 20.00 20.07a 20.13, 20.01 CAGE Nondrinker 20.18c 20.25, 20.11b 20.15c 20.22, 20.08 20.10d 20.17, 20.03b 20.11d 20.18, 20.04 CAGE<2 (ref.) 0.00 0.00, 0.00 0.00 0.00, 0.00 0.00 0.00, 0.00 0.00 0.00, 0.00 CAGE 21 20.06 20.12, 0.01 20.05 20.12, 0.02 20.05 20.12, 0.02 20.11d 20.17, 20.04 Follow-up
Change in alcohol use
Stable nondrinker 20.12a 20.21, 20.02 20.12a 20.21, 20.02 20.10a 20.20, 20.01 20.03 20.12, 0.07 Quit drinking 20.26c 20.36, 20.16 20.21c 20.31, 20.11 20.14d 20.24, 20.04 20.15d 20.26, 20.05 Continued 290 Neurology 84 January 20, 2015
functions were estimated using multiple linear regression. In cross-sectional analyses, only variables measured at reexamination were used; in prospective analyses, we used cognition from reexamination and alcohol and covariates from baseline. All regression analyses were adjusted for cognitive measurement occasion (first vs repeated).
Analyses were conducted separately by sex because of large dif-ferences in alcohol consumption between men and women. To for-mally test for heterogeneity, alcohol–sex interactions were included in regression models. Heterogeneity of associations between study centers was examined by including interactions between alcohol measures and center, and by conducting analyses stratified by cen-ter. For alcohol indices, the lowest level of drinking was used as the reference group. In additional analyses, models for binge drinking were further adjusted for, or stratified by, alcohol volume. Sensitiv-ity analyses were conducted to account for missing covariate data and attrition. Analyses were conducted in Stata 13.18
RESULTS
Complete data on all cognitive tests were
available for 17,022 participants in 2006–2008,
14,575 of whom also had data on alcohol and all
covariates and were included in the analytic sample.
Table 1 shows baseline and follow-up characteristics
of included participants (descriptive statistics by
alcohol use categories are shown in table e-1 on the
Neurology
®Web site at Neurology.org). Proportions
of binge drinkers and problem drinkers as well as
average alcohol use were higher in men than in
women; baseline median daily alcohol intake was 5.
3 and 0.6 g, respectively.
Baseline and follow-up alcohol measures were
strongly associated with each other. Spearman
coeffi-cients were 0.62 and 0.58 for quantity and frequency
of drinking. Tetrachoric coefficient for binge
drink-ing was 0.60. For categories of alcohol intake, 58%
of participants were in the same group on both
occa-sions, and 44% of participants were in the same or
adjacent category for drinking frequency.
In regression analyses, heterogeneity between
centers was observed in only a few instances and was
mostly weak. In fully adjusted models, several
alcohol–sex interactions, especially for recall tests, were
evident at p
, 0.05. Results of regression analyses
adjusted for potential confounders are shown in table 2
(men) and table 3 (women). Age-adjusted regression
results are available in the online supplement (table e-2
[men] and table e-3 [women]). In men, the quantity
and frequency of drinking were generally not
signifi-cantly associated with cognitive test scores, either
pro-spectively or cross-sectionally, after adjusting for
socioeconomic and lifestyle confounders. The only
consistent exception was lower cognitive scores in
nondrinkers compared with the reference group in
cross-sectional models.
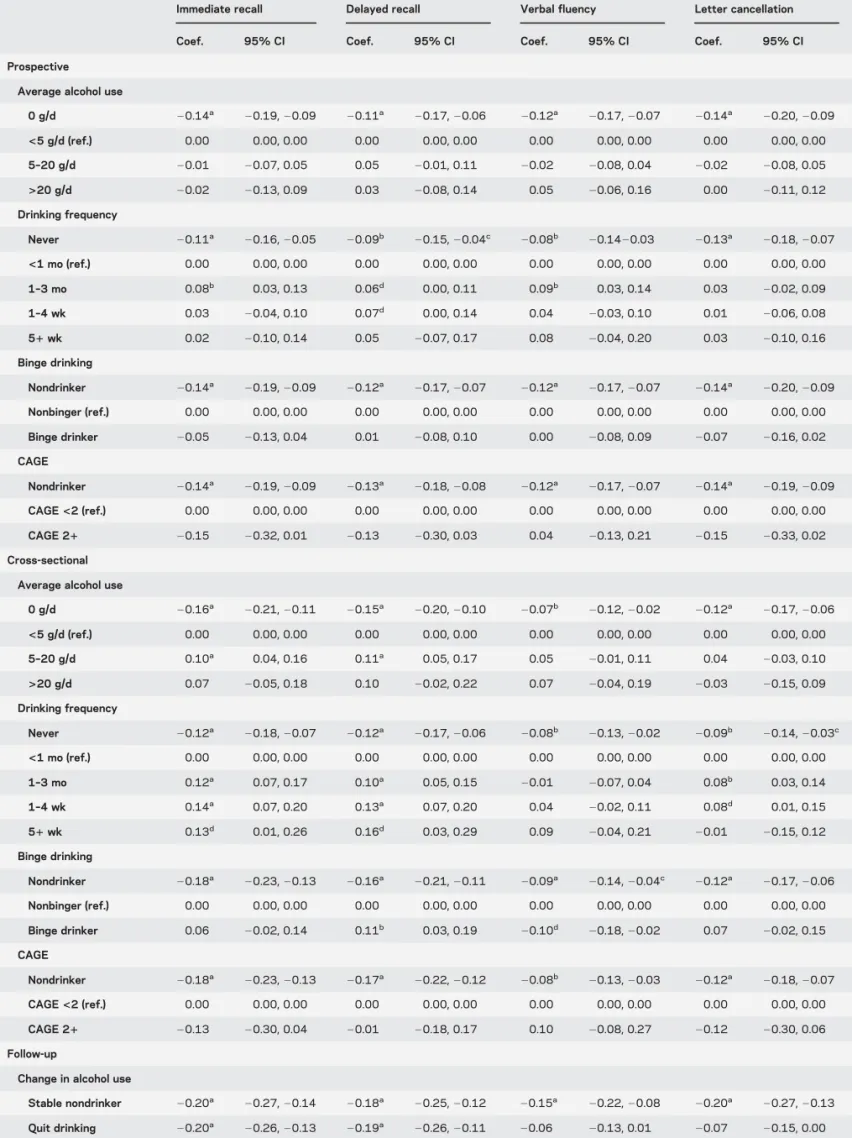
In women, nondrinkers had consistently lower
cognitive scores than light drinkers in both
prospec-tive and cross-sectional analyses. Better cogniprospec-tive
performance in moderate drinkers observed in
age-adjusted models (table e-3) was largely attenuated
by subsequent adjustment for socioeconomic and
life-style factors. In cross-sectional analyses, moderate
drinking frequency and intake were associated with
better scores, compared with lower levels of drinking.
In prospective analyses, only women drinking a few
times a month showed better performance on the
ver-bal cognitive tests than those who drank less
fre-quently than that, whereas average intake was not
associated with better cognition.
Binge drinking was not significantly associated
with cognitive performance in either sex in
prospec-tive analyses; cross-sectional associations were also
few and inconsistent. CAGE was also not related to
cognitive performance, although in women, the
num-ber of problem drinkers was relatively small.
Results for drinking pattern, measured by
combin-ing data on frequency and quantity per occasion, did
not yield any additional insights and are reported in
the online supplement separately for men (table e-4)
and women (table e-5).
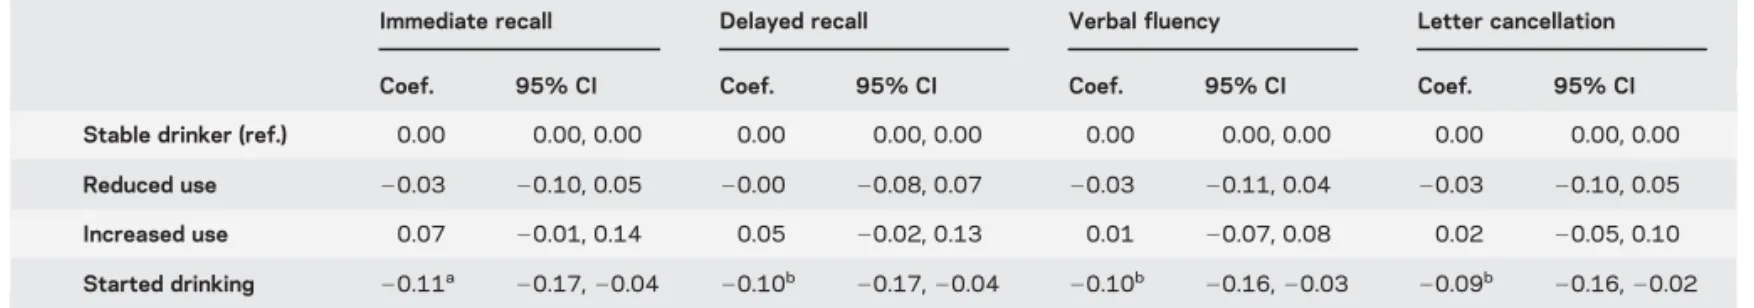
Results for change in alcohol intake during follow-up
showed that, especially in men, participants who stopped
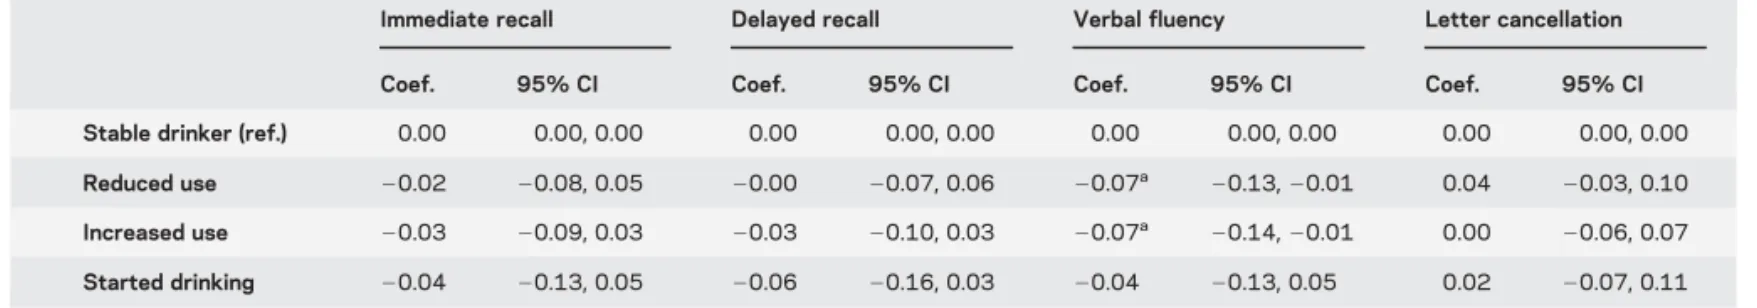
Table 2 ContinuedImmediate recall Delayed recall Verbal fluency Letter cancellation
Coef. 95% CI Coef. 95% CI Coef. 95% CI Coef. 95% CI Stable drinker (ref.) 0.00 0.00, 0.00 0.00 0.00, 0.00 0.00 0.00, 0.00 0.00 0.00, 0.00 Reduced use 20.02 20.08, 0.05 20.00 20.07, 0.06 20.07a
20.13, 20.01 0.04 20.03, 0.10 Increased use 20.03 20.09, 0.03 20.03 20.10, 0.03 20.07a
20.14, 20.01 0.00 20.06, 0.07 Started drinking 20.04 20.13, 0.05 20.06 20.16, 0.03 20.04 20.13, 0.05 0.02 20.07, 0.11 Abbreviations: CAGE5 cutting down, annoyance by criticism, guilty feeling, and eye-openers; CI 5 confidence interval; coef. 5 coefficient; ref. 5 reference. Models are adjusted for age, center, cognitive measurement occasion, education, household asset score, smoking, physical activity, and depressive symptoms.
a
p , 0.05.
b
Overall p value for alcohol categories by study center interaction significant at ,0.05.
c
p , 0.001.
d
p , 0.01.
Table 3 Regression results for alcohol consumption and standardized cognitive scores in women (n5 7,967)
Immediate recall Delayed recall Verbal fluency Letter cancellation
Coef. 95% CI Coef. 95% CI Coef. 95% CI Coef. 95% CI Prospective
Average alcohol use
0 g/d 20.14a 20.19, 20.09 20.11a 20.17, 20.06 20.12a 20.17, 20.07 20.14a 20.20, 20.09 <5 g/d (ref.) 0.00 0.00, 0.00 0.00 0.00, 0.00 0.00 0.00, 0.00 0.00 0.00, 0.00 5–20 g/d 20.01 20.07, 0.05 0.05 20.01, 0.11 20.02 20.08, 0.04 20.02 20.08, 0.05 >20 g/d 20.02 20.13, 0.09 0.03 20.08, 0.14 0.05 20.06, 0.16 0.00 20.11, 0.12 Drinking frequency Never 20.11a 20.16, 20.05 20.09b 20.15, 20.04c 20.08b 20.1420.03 20.13a 20.18, 20.07 <1 mo (ref.) 0.00 0.00, 0.00 0.00 0.00, 0.00 0.00 0.00, 0.00 0.00 0.00, 0.00 1–3 mo 0.08b 0.03, 0.13 0.06d 0.00, 0.11 0.09b 0.03, 0.14 0.03 20.02, 0.09 1–4 wk 0.03 20.04, 0.10 0.07d 0.00, 0.14 0.04 20.03, 0.10 0.01 20.06, 0.08 51 wk 0.02 20.10, 0.14 0.05 20.07, 0.17 0.08 20.04, 0.20 0.03 20.10, 0.16 Binge drinking Nondrinker 20.14a 20.19, 20.09 20.12a 20.17, 20.07 20.12a 20.17, 20.07 20.14a 20.20, 20.09 Nonbinger (ref.) 0.00 0.00, 0.00 0.00 0.00, 0.00 0.00 0.00, 0.00 0.00 0.00, 0.00 Binge drinker 20.05 20.13, 0.04 0.01 20.08, 0.10 0.00 20.08, 0.09 20.07 20.16, 0.02 CAGE Nondrinker 20.14a 20.19, 20.09 20.13a 20.18, 20.08 20.12a 20.17, 20.07 20.14a 20.19, 20.09 CAGE<2 (ref.) 0.00 0.00, 0.00 0.00 0.00, 0.00 0.00 0.00, 0.00 0.00 0.00, 0.00 CAGE 21 20.15 20.32, 0.01 20.13 20.30, 0.03 0.04 20.13, 0.21 20.15 20.33, 0.02 Cross-sectional
Average alcohol use
0 g/d 20.16a 20.21, 20.11 20.15a 20.20, 20.10 20.07b 20.12, 20.02 20.12a 20.17, 20.06 <5 g/d (ref.) 0.00 0.00, 0.00 0.00 0.00, 0.00 0.00 0.00, 0.00 0.00 0.00, 0.00 5–20 g/d 0.10a 0.04, 0.16 0.11a 0.05, 0.17 0.05 20.01, 0.11 0.04 20.03, 0.10 >20 g/d 0.07 20.05, 0.18 0.10 20.02, 0.22 0.07 20.04, 0.19 20.03 20.15, 0.09 Drinking frequency Never 20.12a 20.18, 20.07 20.12a 20.17, 20.06 20.08b 20.13, 20.02 20.09b 20.14, 20.03c <1 mo (ref.) 0.00 0.00, 0.00 0.00 0.00, 0.00 0.00 0.00, 0.00 0.00 0.00, 0.00 1–3 mo 0.12a 0.07, 0.17 0.10a 0.05, 0.15 20.01 20.07, 0.04 0.08b 0.03, 0.14 1–4 wk 0.14a 0.07, 0.20 0.13a 0.07, 0.20 0.04 20.02, 0.11 0.08d 0.01, 0.15 51 wk 0.13d 0.01, 0.26 0.16d 0.03, 0.29 0.09 20.04, 0.21 20.01 20.15, 0.12 Binge drinking Nondrinker 20.18a 20.23, 20.13 20.16a 20.21, 20.11 20.09a 20.14, 20.04c 20.12a 20.17, 20.06 Nonbinger (ref.) 0.00 0.00, 0.00 0.00 0.00, 0.00 0.00 0.00, 0.00 0.00 0.00, 0.00 Binge drinker 0.06 20.02, 0.14 0.11b 0.03, 0.19 20.10d 20.18, 20.02 0.07 20.02, 0.15 CAGE Nondrinker 20.18a 20.23, 20.13 20.17a 20.22, 20.12 20.08b 20.13, 20.03 20.12a 20.18, 20.07 CAGE<2 (ref.) 0.00 0.00, 0.00 0.00 0.00, 0.00 0.00 0.00, 0.00 0.00 0.00, 0.00 CAGE 21 20.13 20.30, 0.04 20.01 20.18, 0.17 0.10 20.08, 0.27 20.12 20.30, 0.06 Follow-up
Change in alcohol use
Stable nondrinker 20.20a 20.27, 20.14 20.18a 20.25, 20.12 20.15a 20.22, 20.08 20.20a 20.27, 20.13 Quit drinking 20.20a 20.26, 20.13 20.19a 20.26, 20.11 20.06 20.13, 0.01 20.07 20.15, 0.00 Continued 292 Neurology 84 January 20, 2015
drinking had significantly lower cognitive scores than
stable drinkers. There were almost no statistically
signif-icant differences between stable drinkers and other
drinkers. In women, stable nondrinkers and those who
started drinking during follow-up also had lower
cogni-tive scores. In men, lower verbal performance in stable
nondrinkers was marginally significant. Results for
change in drinking frequency or combining information
on frequency and intake during follow-up were similar
(table e-6).
Finally, additional adjustment for health
condi-tions resulted in little change in associacondi-tions with
cog-nition for all alcohol measures (tables e-7 and e-8).
Results of sensitivity analyses using inverse
proba-bility weighting to account for longitudinal attrition
(table e-9) and multiple imputation to account for
missing covariate data (tables e-10 and e-11) are
avail-able in the online supplement.
DISCUSSION
In this large Eastern European study
with relatively high levels of male regular and episodic
heavy drinking, we found only modest associations
between different measures of alcohol consumption
and cognitive performance in older persons. Quantity
and frequency of drinking were not associated with
cognitive performance in men, whereas in women,
moderate drinkers had slightly better cognition than
those drinking less, particularly in cross-sectional
analyses. The most consistent findings were worse
cognitive performance in female nondrinkers and
those who stopped drinking during follow-up.
Binge and problem drinking were not consistently
associated with cognitive function.
Our study has limitations. First, the analytic
sam-ple was restricted to participants with cognitive
meas-ures at follow-up. Attrition was higher in participants
with lower cognitive scores, nondrinkers, and frequent
drinkers at baseline, and could possibly bias the results
of our study. However, sensitivity analysis accounting
for missing cognition data by inverse probability
weighting yielded similar results (table e-6).
Second, self-reported alcohol measures typically
underestimate actual consumption.
19In this study,
systematic underreporting among men seems unlikely
but, because of sex differences in social acceptability
of drinking, underreporting may be greater in
women.
20Among available alcohol measures, the
GFQ appeared to be least prone to underreporting.
In addition, correlations between different alcohol
measures were generally high, and serum GGT
(g-glutamyltransferase) values showed expected
asso-ciations with alcohol, although the correlations were
weaker in women.
Third, alcohol measures used may not fully
reflect lifelong consumption. Particularly,
partici-pants may have stopped or reduced drinking before
the baseline, and those who stopped drinking during
follow-up had worse cognition than stable drinkers.
However, unstable drinkers generally did not differ
from stable drinkers, and the few significant
differ-ences may be attributable to chance. While this
would suggest that results for drinkers were not
affected by inclusion of those who had reduced their
consumption, it is also possible that regression to the
mean affected our estimates in relation to change in
alcohol consumption, leading to regression dilution
bias. However, this does not affect our prospective
and cross-sectional results.
Fourth, response rates were relatively low and
res-ponders were healthier than nonresres-ponders.
15While
this is also true of most contemporary studies, it
sug-gests that heavier drinkers and individuals with
cog-nitive impairment may have been less likely to
participate. Low response and differences in
charac-teristics between responders and nonresponders do
not inevitably bias estimates of associations.
21How-ever, if in our study heavy drinkers had lower
partic-ipation rates and higher likelihood of cognitive
Table 3 ContinuedImmediate recall Delayed recall Verbal fluency Letter cancellation
Coef. 95% CI Coef. 95% CI Coef. 95% CI Coef. 95% CI Stable drinker (ref.) 0.00 0.00, 0.00 0.00 0.00, 0.00 0.00 0.00, 0.00 0.00 0.00, 0.00 Reduced use 20.03 20.10, 0.05 20.00 20.08, 0.07 20.03 20.11, 0.04 20.03 20.10, 0.05 Increased use 0.07 20.01, 0.14 0.05 20.02, 0.13 0.01 20.07, 0.08 0.02 20.05, 0.10 Started drinking 20.11a 20.17, 20.04 20.10b 20.17, 20.04 20.10b 20.16, 20.03 20.09b 20.16, 20.02
Abbreviations: CAGE5 cutting down, annoyance by criticism, guilty feeling, and eye-openers; CI 5 confidence interval; coef. 5 coefficient; ref. 5 reference. Models are adjusted for age, center, cognitive measurement occasion, education, household asset score, smoking, physical activity, and depressive symptoms. a p , 0.001. b p , 0.01. c
Overall p value for alcohol categories by country interaction significant at ,0.05.
d
p , 0.05.
impairment, it is possible that associations between
heavy
drinking
and
cognitive
function
were
underestimated.
Finally, the study did not examine nationally
rep-resentative samples and extrapolation beyond urban
settings requires caution.
A particular strength of this study is the use of
Eastern European population samples with relatively
high alcohol consumption and rates of male binge
drinking in the former Soviet Union,
22and a higher
proportion of CVD and premature mortality
esti-mated to be attributable to alcohol than elsewhere
in Europe.
14Indeed, our study had a high prevalence
of male binge and problem drinking. Second, the
GFQ is well suited for identifying heavy and binge
drinkers.
16Third, the large numbers in the pooled
sample provide adequate statistical power in men,
although the numbers of heavy drinkers were small
in women. Finally, unlike most previous studies, our
emphasis was on the cognitive effects of regular and
episodic heavy drinking, not just light to moderate
drinking.
We did not find convincing evidence of worse
cog-nitive performance in heavy drinkers. More specific
tests of executive function could show greater sensitivity
to the effects of alcohol, as previously reported for
phonemic fluency.
3A study in British civil servants
reported faster cognitive decline in middle-aged men
drinking $36 g/d, compared with
,20 g/d, but no
effect in women.
8It is possible that regular and/or
episodic heavy alcohol use is associated with faster
cog-nitive decline in Eastern European populations, but we
do not yet have a long enough follow-up to examine
trajectories of cognitive decline.
In our study, binge drinking was not consistently
associated with cognitive performance. We were
therefore unable to replicate findings from one study
of Finish twins, in which binge drinking was
indepen-dently associated with cognitive impairment
10and
dementia.
11The main hypothesized mechanism for the
associ-ation between alcohol and cognition involves effects
on the cardio- and cerebrovascular systems.
13Heavy
drinking and abstention have been linked to higher
cardiovascular risk than light to moderate drinking,
and binge drinking may independently increase
car-diovascular risk.
12In a prospective study in
Novosi-birsk, regular but not episodic heavy drinking
increased risk of cardiovascular death.
23Binge
drink-ing was also not consistently associated with high
blood pressure
24or all-cause and cardiovascular
mor-tality in this cohort (unpublished findings). Thus, the
absence of association between binge drinking and
cognitive performance could plausibly reflect the
apparent lack of adverse effects of binge drinking on
CVD in this cohort.
Most observational studies report moderate
drink-ing to be beneficial for cognitive function in mid- to
later life
2with anti-inflammatory effects postulated
among the underlying mechanisms.
25Consistent
with this, we observed significantly better cognitive
scores in moderate drinkers than low-level drinkers in
women. However, compared with cross-sectional
re-sults, the prospective associations were modest and
inconsistent. This discrepancy suggests that reverse
causality, selection, or confounding by social or
life-style factors may partly account for the positive
cor-relation between moderate drinking and cognitive
performance, as previously suggested.
26,27A causal
association was also not supported by negative
find-ings of mendelian randomization studies in Chinese
men
28and Europeans.
29However, a recent study in a
Scottish birth cohort suggested that the effects of
alcohol on late-life cognition may be modified by
genetic ability to metabolize alcohol.
30Similarly, lower cognitive scores in participants
who stopped drinking during follow-up may partly
reflect confounding by poor health. In fact, at
reex-amination, more than half of these participants
re-ported stopping drinking because of poor health.
However, adjustment for self-reported chronic
condi-tions had little effect on the associacondi-tions.
Our study has implications. Better cognitive
per-formance was only inconsistently associated with
moderate drinking, with some of the associations
pos-sibly explained by selection bias or confounding. This
cautions against specific recommendations about
ben-eficial drinking levels for cognitive function. Poorer
cognition in current nondrinkers and recent quitters
suggests greater attention should be given to the
health status of this group. Although adverse effects
of binge drinking on cognition were not detected over
a short follow-up period or cross-sectionally, our
find-ings do not preclude the possibility of faster cognitive
decline in the long term among binge drinkers.
AUTHOR CONTRIBUTIONS
M.B. and P.H. conceptualized the study. P.H. performed statistical anal-ysis and wrote first and successive drafts of manuscript. M.B., M.R., R.K., A. Pajak, S.M., S.S., H.P., A. Peasey, M.M., and A.S.-M. inter-preted the results and commented on drafts.
STUDY FUNDING
This work was supported by the Wellcome Trust (grants 064947 and 081081); the US National Institute on Aging (grant R01 AG23522); and MacArthur Foundation Research Network (grant 712058).
DISCLOSURE
P. Horvat reports no disclosures relevant to the manuscript. M. Richards receives research support from the UK Medical Research Council and the British Heart Foundation. R. Kubinova, A. Pajak, S. Malyutina, S. Shish-kin, H. Pikhart, A. Peasey, and M. Marmot report no disclosures relevant to the manuscript. A. Singh-Manoux receives research support from the US NIH (R01AG013196; R01AG034454). M. Bobak reports no disclo-sures relevant to the manuscript. Go to Neurology.org for full disclodisclo-sures.
Received July 10, 2014. Accepted in final form September 24, 2014.
REFERENCES
1. Amieva H, Jacqmin-Gadda H, Orgogozo JM, et al. The 9 year cognitive decline before dementia of the Alzheimer type: a prospective population-based study. Brain 2005; 128:1093–1101.
2. Neafsey EJ, Collins MA. Moderate alcohol consumption and cognitive risk. Neuropsychiatr Dis Treat 2011;7:465–484. 3. Gross AL, Rebok GW, Ford DE, et al. Alcohol
consump-tion and domain-specific cognitive funcconsump-tion in older adults: longitudinal data from the Johns Hopkins Precursors Study. J Gerontol B Psychol Sci Soc Sci 2011;66:39–47. 4. Bond GE, Burr R, McCurry SM, Graves AB, Larson EB.
Alcohol, aging, and cognitive performance in a cohort of Japanese Americans aged 65 and older: the Kame Project. Int Psychogeriatr 2001;13:207–223.
5. Britton A, Singh-Manoux A, Marmot M. Alcohol con-sumption and cognitive function in the Whitehall II Study. Am J Epidemiol 2004;160:240–247.
6. Sabia S, Gueguen A, Berr C, et al. High alcohol consump-tion in middle-aged adults is associated with poorer cog-nitive performance only in the low socio-economic group: results from the GAZEL cohort study. Addiction 2011; 106:93–101.
7. Richards M, Hardy R, Wadsworth ME. Alcohol consump-tion and midlife cognitive change in the British 1946 birth cohort study. Alcohol Alcohol 2005;40:112–117. 8. Sabia S, Elbaz A, Britton A, et al. Alcohol consumption
and cognitive decline in early old age. Neurology 2014;82: 332–339.
9. Anstey KJ, Mack HA, Cherbuin N. Alcohol consumption as a risk factor for dementia and cognitive decline: meta-analysis of prospective studies. Am J Geriatr Psychiatry 2009;17:542–555.
10. Virtaa JJ, Jarvenpaa T, Heikkila K, et al. Midlife alcohol consumption and later risk of cognitive impairment: a twin follow-up study. J Alzheimers Dis 2010;22:939–948. 11. Jarvenpaa T, Rinne JO, Koskenvuo M, Raiha I, Kaprio J. Binge drinking in midlife and dementia risk. Epidemiol-ogy 2005;16:766–771.
12. Rehm J, Sempos CT, Trevisan M. Alcohol and cardiovas-cular disease: more than one paradox to consider. Average volume of alcohol consumption, patterns of drinking and risk of coronary heart disease—a review. J Cardiovasc Risk 2003;10:15–20.
13. Spiro A, Brady CB. Integrating health into cognitive aging: toward a preventive cognitive neuroscience of aging. J Gerontol B Psychol Sci Soc Sci 2011;66:17–25. 14. Rehm J, Sulkowska U, Manczuk M, et al. Alcohol
ac-counts for a high proportion of premature mortality in Central and Eastern Europe. Int J Epidemiol 2007;36: 458–467.
15. Peasey A, Bobak M, Kubinova R, et al. Determinants of cardiovascular disease and other non-communicable dis-eases in Central and Eastern Europe: rationale and design of the HAPIEE Study. BMC Public Health 2006;6:255. 16. Rehm J. Measuring quantity, frequency, and volume of
drinking. Alcohol Clin Exp Res 1998;22:4S–14S. 17. Ewing JA. Detecting alcoholism: the CAGE questionnaire.
JAMA 1984;252:1905–1907.
18. Stata Statistical Software: Release 13 [Computer Program]. College Station, TX: StataCorp LP; 2013.
19. Stockwell T, Donath S, Cooper-Stanbury M, Chikritzhs T, Catalano P, Mateo C. Under-reporting of alcohol consumption in household surveys: a comparison of quantity-frequency, graduated-frequency and recent recall. Addiction 2004;99:1024–1033.
20. Bobrova N, West R, Malyutina D, Malyutina S, Bobak M. Gender differences in drinking practices in middle aged and older Russians. Alcohol Alcohol 2010;45: 573–580.
21. Stang A. Nonresponse research: an underdeveloped field in epidemiology. Eur J Epidemiol 2003;18:929–932. 22. Popova S, Rehm J, Patra J, Zatonski W. Comparing
alco-hol consumption in Central and Eastern Europe to other European countries. Alcohol Alcohol 2007;42:465–473. 23. Malyutina S, Bobak M, Kurilovitch S, et al. Relation
between heavy and binge drinking and all-cause and car-diovascular mortality in Novosibirsk, Russia: a prospective cohort study. Lancet 2002;360:1448–1454.
24. Pajak A, Szafraniec K, Kubinova R, et al. Binge drinking and blood pressure: cross-sectional results of the HAPIEE Study. PLoS One 2013;8:e65856.
25. Collins MA, Neafsey EJ, Mukamal KJ, et al. Alcohol in moderation, cardioprotection, and neuroprotection: epide-miological considerations and mechanistic studies. Alcohol Clin Exp Res 2009;33:206–219.
26. Corley J, Jia XL, Brett CE, et al. Alcohol intake and cog-nitive abilities in old age: the Lothian Birth Cohort 1936 Study. Neuropsychology 2011;25:166–175.
27. Cooper C, Bebbington P, Meltzer H, et al. Alcohol in moderation, premorbid intelligence and cognition in older adults: results from the Psychiatric Morbidity Survey. J Neurol Neurosurg Psychiatry 2009;80:1236–1239. 28. Yeung SLA, Jiang CQ, Cheng KK, et al. Evaluation of
moderate alcohol use and cognitive function among men using a mendelian randomization design in the Guangz-hou Biobank Cohort Study. Am J Epidemiol 2012;175: 1021–1028.
29. Kumari M, Holmes MV, Dale CE, et al. Alcohol con-sumption and cognitive performance: a mendelian ran-domization study. Addiction 2014;109:1462–1471. 30. Ritchie SJ, Bates TC, Corley J, et al. Alcohol consumption
and lifetime change in cognitive ability: a gene3 environ-ment interaction study. Age 2014;36:9638.