THÈSE PRÉSENTÉE À
L’UNIVERSITÉ DU QUÉBEC À CHICOUTIMI
COMME EXIGENCE PARTIELLE
DU DOCTORAT EN INGÉNIERIE
PAR
Mohamed Gamal Ramadan Mahmoud
EFFETS DE L’AJOUT DES METAUX TERRES RARES SUR
LES PERFORMANCES DES ALLIAGES Al-Cu et Al-Si-Cu
THESIS PRESENTED TO THE
UNIVERSITY OF QUEBEC AT CHICOUTIMI
IN PARTIAL FULFILLMENT OF THE
REQUIREMENT FOR THE DEGREE OF
DOCTOR OF PHILOSOPHY IN ENGINEERING
BY
Mohamed Gamal Ramadan Mahmoud
EFFECTS OF RARE EARTH METAL ADDITIONS ON THE
PERFORMANCE OF Al-Cu AND Al-Si-Cu BASED ALLOYS
DEDICATION
My dear son Omar, I know that your brain is different from others however; the thoughts and emotions in it are as real, as valid, as beautiful and as important as anyone’s. Omar, it is my pleasure to dedicate this thesis to you.
ىنبلأ ءادهإ زيزعلا
RÉSUMÉ
La crise de l'énergie fossile et la direction mondiale pour réduire les émissions de gaz à effet de serre, ont attiré l'attention des chercheurs sur la recherche de matériaux légers pour les applications d'économie d'énergie, en particulier dans les secteurs de l'industrie automobile. Des alliages à base d'aluminium, légers et à haute résistance, avec une résistance comparable à celle des matériaux lourds, tels que les aciers inoxydables et la fonte, pourraient révolutionner l’industrie automobile. Cependant, des facteurs majeurs limitants peuvent entraver leurs applications industrielles. L'un de ces facteurs est que la plupart des alliages d'aluminium ne sont pas capables de maintenir leurs propriétés optimales à des températures supérieures à 150 °C ou 200 °C. En conséquence, d'autres études sont encore nécessaires pour une compréhension globale du comportement des alliages d'aluminium dans le contexte des composants automobiles. La présente étude de recherche à été entreprise pour cette raison. Le projet visait à étudier l'effet de l’ajout des éléments de terres rares (Ce et La) individuellement pour améliorer les performances des alliages étudiés (B0) Al-1.2Si-2.4Cu-0.4Mg-0.4Fe-0.6Mn-0.15Ti (poids %) et (DO) Al-8,0Si-2,4Cu-0,4Mg-0,4Fe-0,6Mn-0,15Ti (% en poids).
La première phase de ce travail consistait à étudier l'effet d'ajouts de 1,0 et 5,0% en poids de RE (Ce/La) sur le comportement de solidification et la caractérisation microstructurale des alliages (AC) étudiés sous faible taux de refroidissement (0,7 °C / s). Les expériences d'analyse thermique (TA) et DSC ont permis d'examiner le comportement de solidification des alliages, tandis que la caractérisation microstructurale a été réalisée à l'aide de SEM / EDS et EPMA / WDS. Les résultats de l'analyse thermique ont révélé que les principales phases observées dans les alliages étudiés sont α-Al, α-Fe, Al-Si, Al2Cu + Q. Les résultats ont également présenté une baisse des paramètres de solidification, y compris les températures de nucléation (α-Al) et la température eutectique (Al-Si) est causée par l'ajout de RE (Ce / La), la baisse est plus nette avec l'ajout de 5,0 wt % de 1,0% en poids de RE (Ce / La). DSC a révélé que l'addition de métaux RE (La ou Ce) conduit à l'apparition de pics exothermiques dans les courbes de solidification et de chauffage entre la précipitation de la phase primaire α-Al et la réaction eutectique (Al-Al2Cu). De plus, les résultats de DSC
montrent que dans ce cas, le pic correspondant à la phase Al2Cu est clairement perceptible
dans les alliages de base et devient très réduit avec 1,0% en poids de RE (Ce / La), et disparaît avec 5,0% en poids de RE La) ajouts. Les résultats de la microstructure ont révélé que deux types principaux d'intermétalliques contenant des ER ont été documentés: une phase grise sous la forme de boue avec une composition fixe (Al21Ti2RE (Ce / La)). En outre, RE (Ce /
La) réagirait avec Si, Fe et Cu conduisant à la formation de phase intermétallique contenant du RE blanc avec plusieurs compositions: (i) Alliage B0 (Al11RE (Ce / La) 3 (Cu, Fe) 4Si2,
Al4Ce3Si2, Al5La3Si2 et Al6La2 (Cu, Fe) 2Si); (ii) un alliage D0 (Al9RE (Ce / La) 4Cu2Si4,
Al2RE (Ce / La) Si et Al2CeSi). Lanthane et Ce peuvent se remplacer.
La seconde phase de l’étude a consisté à comprendre l'influence de l’ajout de 0,2 de 0,5 et 1,0% en poids de RE (Ce / La) sur les propriétés de traction des alliages testés à température ambiante, suivant diverses conditions de traitement thermique: AC) et solution traitée thermiquement (SHT). Les traitements de vieillissement (T5, T6 et T7) en référencent aux propriétés mécaniques présentées par les alliages de base et leurs équivalents modifiés par Sr ont également été considérés. Pour soutenir les résultats obtenus, l'analyse quantitative des phases secondaires et la mesure des particules de Si pour les alliages Al-Si-Cu (D0) ont été analysées pour les alliages étudiés. Les résultats ont révélé que lorsque l'addition de RE (Ce / La) augmente de 0,2 à 1,0% en poids, les quantités relatives d'intermétalliques augmentent, ce qui est attribué à la formation de nouveaux composés intermétalliques contenant des RE qui sont observés dans les régions interdendritiques. Les phases RE-intermétalliques sont également observées dans les échantillons traités thermiquement AC et T6 indiquant la nature insoluble de la phase La-intermétallique. Comme attendu, dans l'alliage D0 modifié de Sr moulé a montré la morphologie fibreuse du silicium eutectique. Alors que l'addition de 0,2% en poids de RE (Ce / La) a entraîné une modification partielle de la structure du silicium eutectique. L'efficacité de la modification, cependant, dépend du niveau d'addition de RE (Ce / La). Les résultats des essais de traction ont montré que pour tous les alliages, que ce soit l'alliage de base, le Sr modifié ou ceux contenant des ajouts de RE, les alliages T6 traités thermiquement présentent des valeurs élevées (UTS) par rapport aux SHT, T5 et T7 conditions de traitement. Les alliages traités thermiquement en solution présentent des valeurs de ductilité supérieures à celles obtenues dans les autres conditions. En ce qui concerne l'effet des ajouts de terres rares, les résultats ont indiqué que le niveau utilisé de RE joue un rôle efficace dans la détermination de l'influence de La et Ce sur les propriétés de traction de l'alliage. Les alliages présentant de faibles niveaux d'additions de Ce et de La présentent des valeurs UTS relativement meilleures, qui tendent à diminuer avec une concentration de RE plus élevée. Les résultats ont également conclu que l'influence de 0,2% en poids de RE (Ce / La) sur les propriétés de traction est plus ou moins la même que celle provoquée par l'addition de 150 ppm de Sr.
La dernière phase de ce travail était axée sur l'étude de l'impact de l’ajout de 0,2 de 0,5 et 1,0% en poids de RE (Ce / La) sur les propriétés de traction des alliages traités au T6 à haute température (250 oC) après 1 et 200 heures de stabilisation à 250 oC avant les essais. En plus d'étudier les caractéristiques de rupture des échantillons testés en traction dans les directions parallèle et perpendiculaire à l'axe de traction en utilisant la microscopie électronique à balayage (SEM) et la microscopie optique (OM), respectivement. En général, pour les deux alliages B0 et D0, les résultats ont montré que 200 heures de stabilisation à 250 °C entraînent une forte diminution de l'UTS et du YS, couplée à une forte augmentation de la ductilité par rapport aux valeurs obtenues après une heure de stabilisation à même
temperature. En ce qui concerne l'effet des ajouts de terres rares, semblable aux résultats de la température ambiante, 0,2% en poids. % Ce ou l’améliore l'UTS et YS de l'alliage B0 et D0 d'environ 10-15 MPa après une stabilisation d'une heure, avec peu ou pas de changement dans la ductilité. Comparer aux résultats des tests de traction à température ambiante, les alliages à RE plus élevé (Ce / La) conservant de bonnes propriétés de résistance à haute température avec une diminution négligeable comparable à celle des alliages de base, après une stabilisation d'une heure. L'examen au MEB des surfaces fracturées des alliages de base traités à T6 obtenus après 200 h de stabilisation à 250 °C a révélé la présence d'une microvoid, une structure de fossettes fine et uniformément répartie, indiquant une plus grande déformation plastique avant la fracture, en particulier les alliages B0. Dans le cas des alliages renfermant 1,0% en poids de RE (Ce), les fractographes au MEB ont révélé des caractéristiques considérablement différentes avec une grande taille de fossettes, plutôt que des fossettes distribuées uniformes observées dans l'alliage de base. En outre, une fracture de clivage, considérée comme une caractéristique d'une fracture fragile, a été observée. Le résumé des résultats de fractographie au microscope optique a montré que le processus de dommages des alliages étudiés se compose de trois événements mixtes: (i) fissuration des particules (α-Fe, Si), (ii) la formation et la croissance des microfissures, et (iii) microfissures. Cependant, la présence de composés intermétalliques contenant du RE influence le comportement à la rupture des alliages en fonction du pourcentage de RE ajouté. Lors de la déformation plastique, des contraintes sont imposées par la matrice (α-Al) sur les particules dans les microstructures. Des contraintes internes peuvent être induites sur les composés intermétalliques contenant de l'α-Fe, du silicium eutectique et du RE en raison d'une déformation inhomogène dans les alliages étudiés avec addition de RE.
ABSTRACT
The fossil fuel energy crisis and worldwide direction to reduce greenhouse gas emissions have triggered the attention of researchers to look for lightweight materials for energy saving applications especially in the automotive industry. High-strength, lightweight aluminum based alloys with strengths comparable to heavy materials such as stainless steel and cast iron could revolutionize the automobile industry and contribute in solving environmental concerns. However, certain limiting factors may hinder their industrial application. One of these factors is that most aluminum alloys are not able to maintain their optimum properties at temperatures above 150°C or 200 oC. Accordingly, further investigations are still required, to acquire a comprehensive understanding of the behavior of aluminum alloys in the context of elevated temperature applications. The present research study aims at investigating the effect of individual additions of Ce and La rare earth elements on improving the performance of Al-1.2Si-2.4Cu-0.4Mg-0.4Fe-0.6Mn-0.15Ti (wt.%) and Al-8.0Si-2.4Cu-0.4Mg-0.4Fe-0.6Mn-0.15Ti (wt.%) alloys, coded B0 and D0, respectively. The first phase of this work was to study the effect of 1.0 and 5.0 wt.% additions of RE (Ce/La) on the solidification behavior and microstructural characteristics of the as-cast (AC) alloys under low cooling rate conditions (0.7 oC/s). Thermal analysis (TA) and differential scanning calorimetry (DSC) were used to examine the solidification behavior of the alloys. Microstructural characteristics were examined using scanning electron microscopy/energy dispersive spectrometry (SEM/EDS) and electron probe microanalysis/wavelength dispersive spectroscopy (EPMA/WDS) techniques. The thermal analysis results revealed that the main phases observed in the investigated alloys are α-Al, α-Fe, Al-Si, Al2Cu and Q-
Al5Cu2Mg8Si6 phases. The results also showed a drop in the nucleation temperature of α-Al
and eutectic temperature (Al-Si) caused by the addition of RE (Ce/La); the drop was more clearly observed with the 5.0 wt.% RE (Ce/La) addition. DSC analysis revealed that addition of La or Ce leads to the appearance of exothermic peaks between the precipitation of the primary α-Al phase and the (Al–Al2Cu) eutectic reaction in the solidification and heating
curves. Also, the peak corresponding to the formation of the Al2Cu phase is clearly noticeable
in the base alloys (B0 and D0), becomes smaller with 1.0 wt.% RE(Ce/La), and disappears with 5.0 wt.% RE(Ce/La) additions. Microstructures revealed that two main types of RE-containing intermetallic phases were formed: a grey phase in the form of sludge, with a fixed composition Al21Ti2RE (Ce/La), and white RE-containing intermetallic phases (resulting
from reaction of the RE (Ce/La) with Si, Fe, and Cu); The latter exhibited several compositions: (Al11RE (Ce/La)3(Cu,Fe)4Si2, Al4Ce3Si2, Al5La3Si2, and Al6La2(Cu,Fe)2Si) in
the B0 alloys, and (ii) (Al9RE (Ce/La)4Cu2Si4 , Al2RE(Ce/La)Si ,and Al2CeSi) in the D0
alloys. Lanthanum and Ce can substitute each other.
The second phase of this study focused on understanding the influence of 0.2, 0.5, 1.0 wt.% additions of RE (Ce/La) on the room temperature tensile properties of the alloys, following various heat treatment conditions: as-cast (AC), solution heat-treatment (SHT), and aging (T5, T6 and T7), with reference to the properties exhibited by the base alloys and their Sr-modified counterparts. To support the results obtained, quantitative measurements of the volume faction of intermetallic phases and Si particle characteristics were carried out for the investigated alloys. The results revealed that increasing the RE (Ce/La) addition from 0.2 to 1.0 wt.%, increases the relative amount of intermetallics formed, which are attributed
to the formation of new RE-containing intermetallic compounds observed in the interdendritic regions. The RE-intermetallic phases are also observed in both the AC and T6 heat-treated samples indicating the insoluble nature of the La-intermetallic phase. As expected, the eutectic silicon particles in the as-cast Sr modified D0 alloy had fibrous morphology. While addition of 0.2 wt.% RE (Ce/La) resulted in partial modification of the eutectic silicon structure, the modification efficiency, however, depended on the addition level of RE (Ce/La). The tensile test results showed that the T6-treated alloys, whether the base alloy, the Sr-modified one, or those containing RE additions, exhibited higher (UTS) values compared to the SHT, T5, and T7 heat-treatment conditions. The solution heat-treated alloys displayed ductility values higher than those obtained for the other conditions. With respect to the effect of rare earth additions, the results indicated that the added amount of RE plays an effective role in determining the tensile properties. Alloys with low levels of Ce and La additions exhibited relatively better UTS values than those with higher RE concentrations. The results also revealed that the influence of 0.2 wt.% RE(Ce/La) on the tensile properties is more or less the same as that caused by the addition of 150 ppm Sr.
The last phase of this work investigated the impact of 0.2, 0.5, 1.0 wt.% additions of RE (Ce/La) on the tensile properties of the T6-treated alloys tested at high temperature (250
oC) after 1 and 200 hrs of stabilization at 250 oC prior to testing. The fracture characteristics
of the tensile-tested samples in both parallel and perpendicular directions to the tensile axis were examined, using optical microscopy (OM) and scanning electron microscopy (SEM), respectively. In general, for both B0 and D0 alloys, the results showed that 200 hrs of stabilization at 250 oC produces a sharp decrease in the UTS and YS, coupled with a noticeable increase in ductility values, compared to the values obtained following one hour of stabilization at the same temperature. Regarding the effect of rare earth element additions, 0.2 wt.% Ce or La improved the UTS and YS of the B0 and D0 alloys by about 10-15 MPa following one hour of stabilization, with little or no change in the ductility. Compared to the room temperature tensile test results, alloys with higher RE (Ce/La) still maintained good strength values at 250 oC, with negligible decrease compared to those of the base alloys, following one hour of stabilization. SEM examination of the fractured surfaces of the T6-treated base alloys obtained after 200 hrs of stabilization at 250 oC revealed the presence of
microvoids, and a fine, and uniformly distributed dimple structure, indicating a larger amount of plastic deformation prior to fracture especially in the B0 alloys. In the case of alloys containing 1.0 wt.% RE(Ce) the SEM fractographs, revealed considerably different characteristics, with large size dimples, rather than the uniformly distributed dimples observed in the base alloy. In addition, cleavage fracture, which considered as a characteristic of a brittle fracture, was observed. Examination of longitudinal sections beneath the fracture surface using an optical microscope showed that the damage process in the investigated alloys consists of three mixed events: (i) particle cracking (α-Fe, Si), (ii) microcrack formation and growth, and (iii) local linkage of microcracks. However, the presence of RE-containing intermetallic compounds influenced the fracture behavior of the alloys as a function of the percentage of the added RE amount. During plastic deformation, stresses are imposed by the matrix (α-Al) on the particles in the microstructures. Internal stresses may be induced on the α-Fe, eutectic silicon, and RE-containing intermetallic compounds due to inhomogeneous deformation in the alloys with RE additions.
ACKNOWLEDGEMENTS
I would like to take this opportunity to express my sincere thanks to my supervisor, Prof. Fawzy Hosny Samuel, for providing me with the opportunity to work on this project. His continued guidance, invaluable advice, motivation and patience while working on this project is greatly appreciated.
I would also like to express my heartiest gratitude to Prof. Agnes M.Samuel for her helpful support. Her advice and guidance throughout this work has been of immeasurable help not only in academic work, but also in my development as a whole.
I gratefully acknowledge General Motors Powertrain Group (USA) and Nemak (Canada and Mexico) for providing the financial support for this study.
Beyond that, many thanks are also addressed to all members and staff in TAMLA research group who attended me during my work for the familiar atmosphere.
Special thanks go to the external examiners for my doctoral committee, Prof. Iman Elmahallawi (Cairo university, Egypt), Dr.Herbert Doty (General Motors (GM), USA) and Dr.Salvador Valtierra (Nemak, Mexico) for their valuable suggestions and corrections.
I wish to acknowledge my late professor, Prof.Yehia Shash as being the most inspiring person I have ever met in my career life. Rest in peace, my professor.
I just want to thank my friends and everyone who helped and encouraged me in this work. Thank you for always having my back and being there for me, when I need you.
I want to give my thanks to my wife, Amina Abdelraheem for being my soul-mate and my backbone in the difficult days and providing me with a harmonious atmosphere so conducive to study. I am grateful you are in my life. I would not be where I am without you. I am extremely grateful to my little son, Ahmed who was so well behaved and cooperative and never fussed about me not being able to spend time with him. Thank you PAPA for being such a darling and I promise I will compensate for all the lost fun.
Finally, and most importantly, I am eternally grateful to my parents, for their love and support through my whole life. I owe a big thank to my brothers, and sisters, Ahmed and Mahmoud, Ekram and Mona for their moral support during the entire period of my research.
PUBLICATIONS
Publications arising from the present PhD research study
1. A. M. Samuel, E. M. Elgallad, M. G. Mahmoud, H. W. Doty, S. Valtierra, F. H. Samuel, “Rare Earth Metal-Based Intermetallic Formation in Al-Cu-Mg and Al-Si-Cu-Mg Alloys: A Metallographic Study,” Advances in Materials Science and Engineering, 2018.
Publications arising from other studies relating to the same PhD research topic
2. M. G. Mahmoud, A. M. Samuel, H. W. Doty, S. Valtierra, F. H. Samuel, “Effect of Rare Earth Metals, Sr, and Ti Addition on the Microstructural Characterization of A413.1 Alloy,” Advances in Materials Science and Engineering, 2017.
3. M. G. Mahmoud, A. M. Samuel, H. W. Doty, S. Valtierra, F. H. Samuel, “Effect of Solidification Rate and Rare Earth Metal Addition on the Microstructural Characteristics and Porosity Formation in A356 Alloy,” Advances in Materials Science and Engineering, 2017.
4. M. G. Mahmoud, E. M. Elgallad, M. F. Ibrahim, F. H. Samuel, “Effect of Rare Earth Metals on Porosity Formation in A356 Alloy,” International Journal of Metalcasting, 2017.
TABLE OF CONTENTS
DEDICATION ... iv RÉSUMÉ... v ABSTRACT ... viii ACKNOWLEDGEMENTS... x PUBLICATIONS ... xiTABLE OF CONTENTS... xii
LIST OF FIGURES ... xv
LIST OF TABLES ... xxiv
CHAPTER 1 INTRODUCTION AND OBJECTIVES ... 1
1.1 MOTIVATION BEHIND THE THESIS ... 2
1.2 ORIGINALITY OF THE WORK ... 4
1.3 DEFINITION OF THE PROBLEM ... 7
1.4 THESIS OBJECTIVES ... 10
1.5 THESIS ORGANIZATION ... 11
CHAPTER 2 LITERATURE REVIEW ... 13
2.1 FUNDAMENTALS BACKGROUND OF Al-Cu ALLOYS ... 14
2.1.1 Microstructure of Al-Cu Alloys ... 14
2.1.2 Heat Treatment of Al-Cu Alloys ... 15
2.2 QUALITY INDICES OF ALUMINUM-SILICON ALLOYS ... 20
2.2.1 Concept of the Quality Index ... 20
2.2.2 Quality Index (Q) Proposed by Drouzy et al. ... 21
2.2.3 Quality Index (Qc) proposed by Câceres ... 22
2.3 REVIEW ON THE EFFECTS OF RARE EARTH METALS ... 26
2.3.1 Effects of Mischmetal (MM) Additions ... 27
2.3.2 Effects of Cerium Additions ... 32
2.3.3 Effects of Lanthanum Additions ... 37
2.3.4 Effects of Mixed Cerium and Lanthanum Additions ... 42
CHAPTER 3 EXPERIMENTAL PROCEDURES ... 44
3.1 INTRODUCTION ... 45
3.2 MATERIALS SELECTION... 47
3.3 MATERIAL PROCESSING ... 49
3.3.1 Casting Procedures ... 49
3.3.2 Heat Treatment Procedures ... 50
3.4 MATERIAL CHARACTERIZATION TESTS ... 52
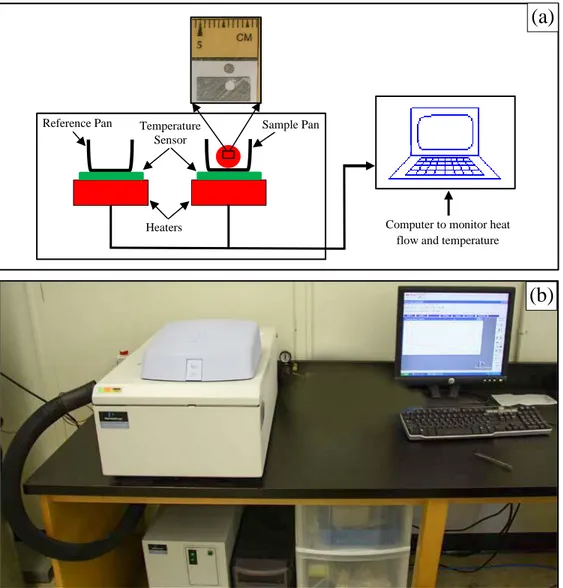
3.4.1 Characterization of Solidification Behavior... 52
3.4.2 Microstructural Characterization ... 56
3.4.3 Mechanical Tensile Testing ... 60
CHAPTER 4 CHARACTERIZATION OF SOLIDIFICATION BEHAVIOUR ... 63
4.1 THERMAL ANALYSIS ... 64
4.1.1 Al-Cu (B0) Alloy ... 64
4.1.2 Al-Si-Cu (D0) Alloy ... 68
4.2 DIFFERENTIAL SCANNING CALORIMETRY (DSC) RESULTS ... 73
4.2.1 Al-Cu (B0) Alloy ... 73
4.2.2 Al-Si-Cu (D0) Alloy ... 77
CHAPTER 5 MICROSTRUCTURAL CHARACTERIZATION... 87
5.1 INTRODUCTION ... 88
5.2 SEM OBSERVATIONS ... 89
5.2.1 Al-Cu (B0) Alloy ... 89
5.2.2 Al-Si-Cu (D0) Alloy ... 100
5.3 ELECTRON PROBE MICROANALYSIS (EPMA) ... 111
5.3.1 AL-Cu (B0) Alloy ... 111
5.3.2 Al-Si-Cu (D0) Alloy ... 119
CHAPTER 6 ROOM TEMPERATURE TENSILE TESTING RESULTS . 128 6.1 QUANTITATIVE METALLOGRAPHIC ANALYSIS ... 129
6.1.1 Quantitative Analysis of Secondary Phases ... 129
6.1.2 Silicon Particle Characterization ... 139
6.2.1 Mechanical properties (UTS, YS and %El) ... 144
6.2.2 Construction Methodology of the Quality Charts ... 151
6.2.3 Statistical analysis ... 160
CHAPTER 7 HIGH TEMPERARURE TENSILE TEST RESULTS ... 166
7.1 TENSILE PROPERTIES AT HIGH TEMPERATURE ... 167
7.1.1 Al- Cu (B0) Alloy ... 169
7.1.2 Al-Si-Cu (D0) Alloy ... 172
7.2 FRACTOGRAPHY RESULTS ... 175
7.2.1 SEM Fractography ... 175
7.2.2 Examination of Longitudinal Sections beneath the Fracture Surface .. 184
CHAPTER 8 CONCLUSIONS ... 195
RECOMMENDATIONS FOR FUTURE WORK ... 206
REFERANCES... 207
APPENDICES ... 231
Appendix A. SEM IMAGES AND EDS SPECTRA OF Al-15% Ce and Al-15% La MASTER ALLOYS ... 232
Appendix B. ACTUAL CHEMICAL COMPOSITION OF ALLOYS TESTED ... ... 233
Appendix C. OPTIMIZATION OF THE SHT OF B0 AND D0 ALLOYS ... 234
Appendix D. THERMAL ANALYSIS DATA SMOOTHING PROGRAM CODE ... 236
Appendix E. METALLOGRAPHIC CHARACTERIZATION IMAGES ... 240
Appendix F. EQUATIONS USED FOR CACERCES QUALITY INDEX MODEL ANALYSIS ... 243
LIST OF FIGURES
CHAPTER 1: INTRODUCTION AND OBJECTIVES
Figure 1.1: (a) Total world liquids consumption , transportation liquids consumption and other sectors liquids consumption between 2007 and 2035 (GJ) [2], (b) Road
vehicles fuel consumption vs Mass [3]. ... 2
Figure 1.2: Evolution of aluminum as a cylinder head material over approximately the past two decades [4, 5]. ... 3
Figure 1.3: Ratio of atomic radii vs. atomic number [21]. ... 9
CHAPTER 2:LITERATURE REVIEW Figure 2.1: Effect of alloying elements on the performance of Al-Cu alloys [27]. ... 15
Figure 2.2: Heat treatment temperature range for heat treating of Al-Cu alloys [31]. ... 16
Figure 2.3: Partial equilibrium diagram of Al-Cu alloys representing the solvus lines of the metastable and equilibrium phases [45] ... 19
Figure 2.4: Example of quality chart proposed by Drouzy et al. [46] ... 22
Figure 2.5: True stress strain -curve plotted in log scale ... 23
Figure 2.6: The quality index chart proposed by Câceres for A356 alloy [48]. ... 25
CHAPTER 3:EXPERIMENTAL PROCEDURES Figure 3.1: Synopsis of experimental procedure ... 46
Figure 3.2:GM220B and GM220D as received ingots ... 47
Figure 3.3: (a) Melting setup, (b) ASTMB-108 permanent mold, (c) actual tensile test casting, and (d) Geometry of the tensile test bar (Dimension in mm). The labeled arrows in (a) indicate (1) electrical resistance furnace, (2) K-type thermocouple, (3) temperature control units, (4) graphite degassing impeller, (5) argons supply hoses, (6) step motor, (7) chemical analysis sampling mold, and (8) Chemical analysis sample. ... 50
Figure 3.4: Lindberg Blue M Electric Furnace. ... 51
Figure 3.5:(a) Schematic diagram, and (b) actual set-up used for thermal analysis. The arrows in (b) indicate (1) final casting, (2) graphite mold, (3) K-type thermocouple, (4) 2-kg capcity crucible, (5) NI SCXI-1000 data acquisition system, and (6) DASYLAB software. ... 53
Figure 3.6:(a) Schematic of DSC analysis, (b) Perkin-Elmer DSC 8000 used for conducting the DSC analysis. ... 55
Figure 3.8: JEOL JSM-6480LV scanning electron microscope equipped with an energy dispersive X-ray spectrometer (EDS). ... 58 Figure 3.9 : JEOL JXA 8900L WD/ED electron probe microanalyzer coupled with a wavelength dispersive spectrometer (WDS). ... 58 Figure 3.10: (L) Struers LaboPresss-3 and (R) TegraForce-5 machines, for mounting and polishing samples for metallography. ... 59 Figure 3.11: (a) MTS tensile testing machine (b) Strain gauge extensometer attached to tensile bar being tested, and (c) tested sample. The arrows indicate (1) hydraulic grips, (2) extensometer, and (3) tested sample. ... 61 Figure 3.12: (a) Instron Universal mechanical testing machine (b) chamber for elevated temperature testing, and (c) tested samples. The arrows indicate (1) thread grips, (2) tested samples, (3) thermocouple, (4) air circulation fan, and (5) induction heating coil. ... 62
CHAPTER 4:CHARACTERIZATION OF SOLIDIFICATION BEHAVIOUR
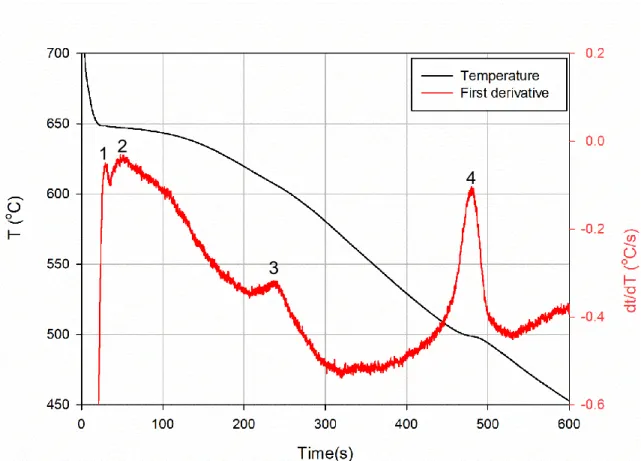
Figure 4.1: The typical cooling curve and first derivative obtained from the thermal analysis of B0 alloys. ... 65 Figure 4.2: Solidification parameters: minimum temperature (TM), growth temperature (TG)
and recalescence (ΔTR). ... 66
Figure 4.3: Assembly of cooling curves depicting the solidification of primary α-Al in B0 alloys with Ce additions. ... 67 Figure 4.4: Assembly of cooling curves depicting the solidification of a primary α-Al in B0 alloys with La additions. ... 68 Figure 4.5: The Typical cooling curve and first derivative obtained from the thermal analysis of D0 alloy. ... 69 Figure 4.6: Assembly of cooling curves depicting on the solidification of a primary α-Al and Al-Si eutectic phases in D0 alloy with Ce additions. ... 71 Figure 4.7: Assembly of cooling curves depicting the solidification of a primary α-Al and Al-Si eutectic phases in D0 alloy with La additions. ... 72 Figure 4.8: DSC melting curves of B0 alloy with 1.0 and 5.0 wt.% of Ce additions. ... 74 Figure 4.9: DSC solidification curves of B0 alloy with 1.0 and 5.0 wt.% of Ce additions.
... 75 Figure 4.10: DSC melting curves of B0 alloy with 1.0 and 5.0 wt.% of La additions. ... 76 Figure 4.11: DSC solidification curves of B0 alloy with 1.0 and 5.0 wt.% of La additions.
... 77 Figure 4.12: DSC melting curves of D0 alloy with 1.0 and 5.0 wt.% of Ce additions. ... 78 Figure 4.13: DSC solidification curves of D0 alloy with 1.0 and 5.0 wt.% of Ce additions.
... 79 Figure 4.14: DSC melting curves of D0 alloy with 1.0 and 5.0 wt.% of La additions. ... 80
Figure 4.15: DSC solidification curves of D0 alloy with 1.0 and 5.0 wt.% of La additions. ... 81 Figure 4.16: Optical micrographs of as-cast B0 alloys containing (a) 0.0 wt.%RE, (b) 1.0 wt.% Ce, and (c) 5.0 wt.% Ce. ... 83 Figure 4.17: Optical micrographs of as-cast B0 alloys containing (a) 0.0 wt.%RE, (b) 1.0 wt.% La, and (c) 5.0 wt.% La. ... 84 Figure 4.18: Optical micrographs of as-cast D0 alloys containing (a) 0.0 wt.%RE, (b) 1.0 wt.% Ce, and (c) 5.0 wt.% Ce. ... 85 Figure 4.19: Optical micrographs of as-cast B0 alloys containing (a) 0.0 wt.%RE, (b) 1.0 wt.% La, and (c) 5.0 wt.% La. ... 86
CHAPTER 5: MICROSTRUCTURAL CHARACTERIZATION
Figure 5.1: Backscattered electron (BSE) images showing the microstructure of as-cast B0 base alloy at (a) low magnification, (b) high magnification, and (c) EDS analysis of locations marked A, B and C in (b). The arrows indicate (1) α-Al15(Fe,Mn)3Si2, (2) Q-Al5Mg8Si6Cu2, and (3) θ-Al2Cu. ... 90
Figure 5.2: Backscattered electron (BSE) images showing the microstructure of as-cast B0 alloy with 1.0 wt.% Ce addition at (a) low magnification, (b) high magnification, and (c) EDS analysis of locations marked A, B and C in (b). The arrows indicate (1) α-Fe, (2) Al2Cu, (3) grey phase AlTiCeCu, and (4) white
phase AlSiCuCe. ... 91 Figure 5.3: Backscattered electron (BSE) images showing the microstructure of as-cast B0 alloy with 5.0 wt.% Ce addition at (a) Low magnification, (b) high magnification, and (c) EDS analysis of locations marked A, B, and C in (b). The arrows indicate (1) α-Fe, (2) Mg2Si, (3) grey phase AlTiCe, (4) white phase
AlSiCe, and (5) white phase AlSiCuCe. ... 92 Figure 5.4: Backscattered electron (BSE) images showing the microstructure of as-cast B0 alloy with 1.0 wt.% La addition at (a) low magnification, (b) high magnification, and (c) EDS analysis of locations marked A, B, and C in (b). The arrows indicate (1) α-Fe, (2) Al2Cu, (3) grey phase AlTiLa, and (4) white
phase AlSiCuLa. ... 94 Figure 5.5: Backscattered electron (BSE) images showing the microstructure of as-cast B0 alloy with 5.0 wt.% La addition at (a) low magnification, (b) high magnification, and (c) EDS analysis of locations marked A, B, and C in (b). The arrows indicate (1) α-Fe, (2) Mg2Si, (3) grey phase AlTiLa, (4) white phase
AlSiLa, and (5) white phase AlSiCuLa. ... 95 Figure 5.6: Backscattered electron (BSE) images showing the microstructures of as-cast B0 alloy containing (a) 0.0 wt.%RE, (b) 1.0 wt.% Ce, and (c) 5.0 wt.% Ce. ... 96
Figure 5.7: Backscattered electron (BSE) images showing the microstructures of as-cast B0 alloy containing (a) 0.0 wt.%RE, (b) 1.0 wt.% La, and (c) 5.0 wt.% La. ... 97 Figure 5.8: Key parameters of %volume fraction, roundness and aspect ratio describing the characteristics of intermetallic compounds in as-cast B0 alloy with various additions of Ce (0.0, 1.0, and 5.0 wt.% ). ... 98 Figure 5.9: Key parameters of %volume fraction, roundness and aspect ratio describing the characteristics of intermetallic compounds in as-cast B0 alloy with various additions of La (0.0, 1.0, and 5.0 wt.% ). ... 99 Figure 5.10: Backscattered electron (BSE) images showing the microstructures of as-cast D0 base alloy at (a) low magnification, (b) high magnification and (c) EDS analysis of locations marked A, B and C in (b). The arrows indicate (1) α-Al15(Fe,Mn)3Si2, (2) eutectic Si, (3) Q-Al5Mg8Si6Cu2, and (4) θ-Al2Cu. ... 100
Figure 5.11: Backscattered electron (BSE) images showing the microstructures of as-cast D0 alloy with 1.0 wt.% Ce addition at (a) low magnification, (b) high magnification and (c) EDS analysis of locations marked A, B and C in (b). The arrows indicate (1) α-Al15(Fe,Mn)3Si2, (2) eutectic Si, (3) θ-Al2Cu, (4) grey
phase AlTiCe, (5) white phase AlSiCe, and (6) white phase AlSiCuCe. ... 102 Figure 5.12: Backscattered electron (BSE) images showing the microstructures of as-cast D0 alloy with 5.0 wt.% Ce addition at (a) low magnification, (b) high magnification and (c) EDS analysis of locations marked A, B and C in (b). The arrows indicate (1) α-Al15(Fe,Mn)3Si2, (2) Mg2Si (3) grey phase AlTiCe, (4)
white phase AlSiCe, and (5) white phase AlSiCuCe... 103 Figure 5.13: Backscattered electron (BSE) images showing the microstructures of as-cast D0 alloy with 1.0 wt.% La addition at (a) low magnification, (b) high magnification and (c) EDS analysis of locations marked (A), (B) and (C) in (b). The arrows indicate (1) α-Al15(Fe,Mn)3Si2, (2) eutectic Si, (3)θ-Al2Cu, (4)grey
phase AlTiLa, (5) white phase AlSiLa, and (6) white phase AlSiCuLa. ... 104 Figure 5.14: Backscattered electron (BSE) images showing the microstructures of as-cast D0 alloy with 5.0 wt.% La addition at (a) low magnification, (b) high magnification, and (c) EDS analysis of locations marked A, B, and C in (b). The arrows indicate (1) α-Al15(Fe,Mn)3Si2, (2) Mg2Si (3) grey phase AlTiLa,
(4)white phase AlSiLa, and (5) white phase AlSiCuLa. ... 105 Figure 5.15: Backscattered electron (BSE) images showing the microstructures of as-cast D0 alloys containing (a) 0.0 wt.%RE, (b) 1.0 wt.% Ce, and (c) 5.0 wt.% Ce. ... 107 Figure 5.16: Backscattered electron (BSE) images showing the microstructures of D0
as-cast alloys contaning (a) 0.0 wt.%RE, (b) 1.0 wt.% La, and (c) 5.0 wt.% La. ... 108 Figure 5.17: Key parameters of %volume fraction, roundness and aspect ratio describing the characteristics of intermetallic compounds in as-cast D0 alloy with various additions of Ce (0.0, 1.0, and 5.0 wt.% ). ... 109
Figure 5.18: Key parameters of %volume fraction, roundness and aspect ratio describing the characteristics of intermetallic compounds in as-cast D0 alloy with various additions of La (0.0, 1.0, and 5.0 wt.% ). ... 110 Figure 5.19: Backscattered electron image of as-cast B0 alloy with 1.0 wt.% Ce addition and corresponding X-ray images of Al, Ce, Cu, Fe, Si and Ti. ... 113 Figure 5.20: EDS spectra of locations marked A and B in Figure 5.19, corresponding to (a) grey phase, and (b) white phase. ... 113 Figure 5.21: Backscattered electron image of as-cast B0 alloy with 5.0 wt.% Ce addition and corresponding X-ray images of Al, Cu, Ce and Ti. ... 114 Figure 5.22: Backscattered electron image of as-cast B0 alloy with 1.0 wt.% La addition and corresponding X-ray images of Al, La, Cu, Fe, Si and Ti. ... 116 Figure 5.23: EDS spectra of locations marked A and B in Figure 5.22, corresponding to (a) grey phase, and (b) white phase. ... 116 Figure 5.24: Backscattered electron image of as-cast B0 alloy with 5.0 wt.% La addition and corresponding X-ray images of Al, Cu, La and Ti. ... 117 Figure 5.25: Backscattered electron image of as-cast D0 alloy with 1.0 wt.% Ce addition and corresponding X-ray images of Al, La, Cu, Fe, Si and Ti. ... 121 Figure 5.26: EDS spectra of locations marked A and B in Figure 5.25, corresponding to (a) grey phase, and (b) white phase. ... 121 Figure 5.27: Backscattered electron image of as-cast D0 alloy with 5.0 wt.% Ce addition and corresponding X-ray images of Ce and Ti. ... 122 Figure 5.28: EDS spectra of locations marked A, B, and C in Figure 5.27 corresponding to (a) grey phase, (b) white phase AlSiCe, and (b) white phase AlSiCuCe. ... 123 Figure 5.29: Backscattered electron image of as-cast D0 alloy with 1.0 wt.% La addition and corresponding X-ray images of Al, La, Cu, Fe, Si and Ti. ... 125 Figure 5.30: EDS spectra of locations marked A and B in Figure 5.29, corresponding to (a) grey phase, and (b) white phase. ... 125 Figure 5.31: (a) Backscattered electron image of as-cast D0 alloy with 5.0 wt.% La addition and corresponding X-ray images of Cu, La, and Ti, (b) enlarged image of selected area in (a). ... 126 Figure 5.32: EDS spectra of locations marked A in Figure 5.31(b) corresponding to grey phase. ... 126
CHAPTER 6: ROOM TEMPERATURE TENSILE TESTING RESULTS
Figure 6.1: Backscattered electron (BSE) images showing the microstructures of the B0 alloys: (a) 0.0 wt.% RE, (b) 0.2 wt.% Ce, (c) 0.5 wt.% Ce, (d) 1.0 wt.% Ce. The arrows indicate (1) α-Fe, (2) Al2Cu, (3) Ce containing intermetallic phase, and
Figure 6.2: Backscattered electron (BSE) images showing the microstructures of the B0 alloys: (a) 0.0 wt.% RE, (b) 0.2 wt.% La, (c) 0.5 wt.% La, (d) 1.0 wt.% La. The arrows indicate (1) α-Fe, (2) Al2Cu, (3) La containing intermetallic phase, and
(4) La rich containing intermetallic phase. ... 131 Figure 6.3: Key parameters of %volume fraction, roundness and aspect ratio describing the characteristics of intermetallic compounds in as-cast B0 alloy with various additions of Ce. ... 132 Figure 6.4: Key parameters of %volume fraction, roundness and aspect ratio describing the characteristics of intermetallic compounds in as-cast B0 alloy with various additions of La. ... 133 Figure 6.5 : Backscattered electron (BSE) images showing the microstructures of the D0 alloys: (a) 0.0 wt.% RE, (b) 0.2 wt.% Ce, (c) 0.5 wt.% Ce, (d) 1.0 wt.% Ce. The arrows indicate (1) α-Fe, (2) Al2Cu, (3) Ce containing intermetallic phase, (4)
Ce rich containing intermetallic phase, and (5) Ce containing intermetallic phase (Cu free)... 134 Figure 6.6: Backscattered electron (BSE) images showing the microstructures of the D0 alloys. (a) 0.0 wt.% RE, (b) 0.2 wt.% La, (c) 0.5 wt.% La, (d) 1.0 wt.% La. The arrows indicate (1) α-Fe, (2) Al2Cu, (3) La containing intermetallic phase, (4)
La rich containing intermetallic phase, and (5) La containing intermetallic phase (Cu free). ... 135 Figure 6.7: Key parameters of %volume fraction, roundness and aspect ratio describing the characteristics of intermetallic compounds in as-cast D0 alloy with various additions of Ce. ... 137 Figure 6.8: Key parameters of %volume fraction, roundness and aspect ratio describing the characteristics of intermetallic compounds in as-cast D0 alloy with various additions of La. ... 138 Figure 6.9: Typical optical microstructures showing the morphology of eutectic silicon in D0 alloys in the as-cast (a, c, e) and T6 (b, d, f) conditions: (a, b) 0.0 wt.% RE; (c, d) 150 ppm Sr; (e, f) 0.2 wt.% Ce. The arrows indicate (1) α-Fe, (2) Al2Cu,
(3) blocky eutectic Si, (4) acicular eutectic Si, (5) fibrous eutectic Si, and (6) Ce-containing intermetallic phase. ... 140 Figure 6.10: Parameters describing eutectic silicon particles in the D0 alloys as a function of Ce additions. (a) mean diameter, (b) roundness, (c) circularity and (d) aspect ratio. ... 141 Figure 6.11: Typical optical microstructures showing the morphology of eutectic silicon of the D0 alloys under As cast (a, c, e) and T6 (b, d, f) conditions. (a, b) 0.0 wt.% RE; (c, d) 150 ppm Sr; (e, f) 0.2 wt.% La. The arrows indicate (1) α-Fe, (2) Al2Cu, (3) blocky eutectic Si, (4) acicular eutectic Si, (5) fibrous eutectic Si,
Figure 6.12: Parameters describing eutectic silicon particles in the D0 alloys as a function of La additions. (a) mean diameter, (b) roundness, (c) circularity and (d) aspect ratio. ... 143 Figure 6.13: Effect of Sr and RE Ce addition on the mechanical properties (UTS, YS, and %El) of B0 alloys. ... 146 Figure 6.14: Effect of Sr and RE La addition on the mechanical properties (UTS, YS, and %El) of B0 alloys. ... 147 Figure 6.15: Effect of Sr and RE Ce addition on the mechanical properties (UTS, YS, and %El) of D0 alloys. ... 149 Figure 6.16: Effect of Sr and RE La addition on the mechanical properties (UTS, YS, and %El) of D0 alloys. ... 150 Figure 6.17: Equations required to obtain true stress-strain curves (TUTS, TYS, TEf)
parameters, strain hardening exponent (n), and the strength coefficient (K). Detailed explanation of these equations is provided in Appendix F. ... 152 Figure 6.18: Quality map showing the relation between UTS and %El for the B0 alloys with Sr and Ce additions for various heat treatment conditions. ... 155 Figure 6.19: Quality map showing the relation between UTS and %El for the B0 alloys with Sr and La additions for various heat treatment conditions. ... 156 Figure 6.20: Quality map showing the relation between UTS and %El for the D0 alloys with Sr and Ce additions for various heat treatment conditions. ... 158 Figure 6.21: Quality map showing the relation between UTS and %El for the D0 alloys with Sr and La additions for various heat treatment conditions. ... 159 Figure 6.22: Comparison of tensile properties (UTS, YS, %El) of Sr-modified, and (a)
Ce-, (b) La-containing B0 alloys relative to those of the as-cast B0 base alloy. 163 Figure 6.23: Comparison of tensile properties (UTS, YS, %El) of Sr-modified and (a)Ce-, (b) La-containing D0 alloys relative to those of the as-cast D0 base alloy. .. 165
CHAPTER 7: HIGH TEMPERARURE TENSILE TEST RESULTS
Figure 7.1 : Effect of Ce additions and stabilization time on the tensile properties (UTS, YS, and %El) of B0 alloys at elevated temperature 250 oC. ... 170 Figure 7.2 : Effect of La additions and stabilization time on the tensile properties (UTS, YS, and %El) of B0 alloys at elevated temperature 250 oC. ... 171
Figure 7.3 : Effect of Ce additions and stabilization time on the tensile properties (UTS, YS, and %El) of D0 alloys at elevated temperature 250 oC. ... 173 Figure 7.4 : Effect of La additions and stabilization time on the tensile properties (UTS, YS, and %El) of D0 alloys at elevated temperature 250 oC. ... 174 Figure 7.5: (a) Secondary electron image showing the fracture surface of T6-treated B0 base alloy; (b) enlarged BSE image of circled area in (a); (C) EDS spectrum
corresponding to the α-Fe phase (b).The arrows indicate (1) α-Fe phase, and (2) Al2Cu precipitation. ... 177
Figure 7.6: (a) Secondary electron image showing the fracture surface of T6-treated B0 alloy with 1.0 wt.% Ce; (b) enlarged BSE image of circled area in (a); (C) EDS spectrum corresponding to the Ce containing intermetallic (AlSiCuCe) phase. The arrows indicate (1) α-Fe phase, (2) Al2Cu precipatation, (3) AlSiCuCe
phase, and (4) cracked particles. ... 178 Figure 7.7: (a) Secondary electron image showing the fracture surface of T6-treated B0 alloy with 1.0 wt.% La; (b) enlarged BSE image of the circled area in (a); (C) EDS spectrum corresponding to La containing intermetallic (AlSiCuLa) phase. The arrows indicate (1) α-Fe phase, (2) Al2Cu precipatation, (3) AlSiCuLa
phase, and (4) cracked particles. ... 180 Figure 7.8: (a) Secondary electron image showing the fracture surface of T6-treated D0 base alloy; (b) enlarged BSE image of circled area in (a); (c) EDS spectrum corresponding to the α-Fe phase in (b). The arrows indicate (1) α-Fe phase, (2) Si, and (3) crack. ... 181 Figure 7.9: (a) Seconday electron images showing the fracture surface of T6-treated D0 alloy with 1.0 wt.% Ce; (b) enlarged BSE image of circled area in (a); (c) EDS spectrum corresponding to Ce-containing intermetallic (AlSiCuCe). The arrows indicate (1) AlSiCuCe phase, and (2) cracks. ... 182 Figure 7.10: (a) Secondary electron image showing the fracture surface of T6-treated D0 alloy with 1.0 wt.% La; (b) enlarged BSE image of circled area in (a); (C) EDS spectrum corresponding to La-containing intermetallic (AlSiCuLa). The arrows indicate (1) AlSiCuLa phase, and (2) cracks. ... 184 Figure 7.11: Optical micrographs showing longitudinal sections below the fracture surface of B0 alloy, taken at: (a) low, (b) high, and (c) very high magnification. The arrows indicate (1) inderdendritic shrinkage, (2) debonding crack, (3) intercrystalline crack, and (4) α-Fe phase... 186 Figure 7.12: Optical micrographs showing longitudinal sections below the fracture of B0 alloy with 1.0 wt.% Ce, taken at: (a) low, (b) high, and (c) very high magnification. The arrows indicate (1) inderdendritic shrinkage, (2) debonding crack, (3) intercrystalline crack, (4) white intermetallic phase, (5) grey Ce-intermetallic phase, and (6) α-Fe phase. ... 187 Figure 7.13: Optical micrographs showing longitudinal sections below the fracture surface of B0 alloy with 1.0 wt.% La, taken at: (a) low, (b) high, and (c) very high magnification. The arrows indicate (1) inderdendritic shrinkage, (2) debonding crack, (3) intercrystalline crack, (4) white intermetallic phase, (5) grey La-intermetallic phase, and (6) α-Fe phase. ... 189 Figure 7.14: Optical micrographs showing longitudinal sections below the fracture surface of T6-treated D0 base alloy, taken at: (a) low, (b) high, and (c) very high magnification. The arrows indicate (1) inderdendritic shrinkage, (2) debonding
crack, (3) intercrystalline crack, (4) round eutecti Si particles, and (5) α-Fe phase. ... 191 Figure 7.15: Optical micrographs showing longitudinal sections below the fracture surface of T6-treated D0 base alloy with 1.0 wt.% Ce, take at: (a) low, (b) high, and (c) very high magnification. The arrows indicate (1) inderdendritic shrinkage, (2) debonding crack, (3) intercrystalline crack, (4) eutectic Si, (5) white Ce intermetallic phase, and (6) α-Fe phase. ... 192 Figure 7.16: Optical micrographs showing longitudinal sections below the fracture surface of the T6-treated D0 alloy with 1.0 wt.% La, taken at: (a) low, (b) high, and (c) very high magnification. The arrows indicate (1) inderdendritic shrinkage, (2) debonding crack, (3) intercrystalline crack , (4) eutectic Si, (5) white La intermetallic phase, and (6) α-Fe phase. ... 194
Appendix A: SEM IMAGES AND EDS SPECTRA OF Al-15% Ce and Al-15% La MASTER ALLOYS
Figure A-1: (a, b) SEM images of (a) Al-15%Ce and (b) Al-15%La master alloys; (c, d) EDS analysis of locations marked A in (a) and B in (b). ... 232
Appendix C: OPTIMIZATION OF THE SHT OF B0 AND D0 ALLOYS
Figure C-1: DSC melting curves of B0 alloy in the as-cast and different solution heat-treated (SHT) conditions. ... 235 Figure C-2: Effect of solution heat teatment condition on the tensile properties of B0 and D0 alloys. ... 235
Appendix D: THERMAL ANALYSIS DATA SMOOTHING PROGRAM CODE Figure D-1: Graphical user interface of the thermal analysis data smoothing program. . 236
Appendix E: METALLOGRAPHIC CHARACTERIZATION IMAGES
Figure E-1: Backscattered electron image of as-cast B0 alloy with 5.0 wt.% Ce addition, and corresponding X-ray images of Al, Cu, Ce, and Ti. ... 241 Figure E-2: Backscattered electron image of as-cast B0 alloy with 5.0 wt.% La addition, and corresponding X-ray images of Al, Cu, La and Ti. ... 242
LIST OF TABLES
CHAPTER 3: EXPERIMENTAL PROCEDURES
Table 3.1: Classification of alloys tested in the current study ... 48 Table 3.2: Heat treatments for the cast alloys tested. ... 51 Table 3.3: Microscopic techniques used for microstructural characterization. ... 56
CHAPTER 4: CHARACTERIZATION OF SOLIDIFICATION BEHAVIOUR
Table 4.1: Solidification reactions observed in the B0 alloy. ... 66 Table 4.2: Solidification reactions observed in the D0 alloy. ... 69
CHAPTER 5: MICROSTRUCTURAL CHARACTERIZATION
Table 5.1: WDS analysis of the RE intermetallic phases observed in B0 alloy with 1.0 wt.% Ce. ... 115 Table 5.2: WDS analysis of the RE intermetallic phases observed in B0 alloy with 5.0
wt.% Ce. ... 115 Table 5.3: WDS analysis of the RE intermetallic phases observed in B0 alloy with 1.0
wt.% La. ... 118 Table 5.4: WDS analysis of the RE intermetallic phases observed in B0 alloy with 5.0
wt.% La. ... 118 Table 5.5: WDS analysis of the RE intermetallic phases observed in D0 alloy with 1.0
wt.% Ce ... 124 Table 5.6: WDS analysis of the RE intermetallic phases observed in D0 alloy with 5.0
wt.% Ce ... 124 Table 5.7: WDS analysis of the RE intermetallic phases observed in D0 alloy with 1.0
wt.% La ... 127 Table 5.8: WDS analysis of the RE intermetallic phases observed in D0 alloy with 5.0
wt.% La ... 127
Appendix B: ACTUAL CHEMICAL COMPOSITION OF ALLOYS TESTED Table B.1: Actual chemical composition of the alloys prepared for this study. ... 233
CHAPTER 1
CHAPTER 1
INTRODUCTION AND OBJECTIVES
1.1 MOTIVATION BEHIND THE THESIS
A growing environmental awareness in both the political and public perspective has led to new guidelines and market demands for limitations of greenhouse gas emissions in many industries, especially for those related to transportation (Figure 1.1(a)). One approach to conserving energy and reducing emissions is by minimizing moving masses (Figure 1.1 (b)). In addition, the rapid escalation of energy prices in the recent years has driven an increase in industrial demand for weight-saving materials in the automotive and aerospace industry as well as throughout the rail and road transport sector [1, 2].
Figure 1.1: (a) Total world liquids consumption , transportation liquids consumption and other sectors liquids consumption between 2007 and 2035 (GJ) [2], (b) Road vehicles
fuel consumption vs Mass [3].
(a)
Aluminum based alloys are of great interest in this area of application due to their relatively high strength-to-weight ratio, low cost, and provision of affordable improvement in the fuel efficiency(as shown in Figure 1.2). However, still most of aluminum alloys are soft and have inherently low mechanical strength, which hinders more widespread industrial application so further investigation and development of aluminum alloys are still needed. For this reason, the current study was motivated by interesting challenges arising from an interest in the development of aluminum-based alloys for automotive applications.
Figure 1.2: Evolution of aluminum as a cylinder head material over approximately the past two decades [4, 5].
1.2 ORIGINALITY OF THE WORK
Aluminum-copper (Al-Cu) based alloys are well known for their excellent properties such as high strength-to-weight ratio, excellent ductility, and good casting performance. In particular, such properties are very attractive to the transport industry, from aerospace to the automotive and naval sectors, where better performance and lower environmental impact can be achieved by decreasing the vehicle weight as maintained in the previous section. Nevertheless, these alloys cannot be produced by recycling aluminum scrap because a high degree of purity is required for casting which, in turn, increases the production cost. In addition, the high copper content in the Al-Cu casting alloys increases the density and cost of this category of alloys since the density of Cu is 9.92 g/cm3. For example, if the amount of copper is decreased from 3.5 wt.% to 2 wt.%, it decreases the calculated alloy density from approximately 2.93 g/cm3 to 2.78 g/ cm3, this can be a good achievement, especially when taking into consideration the size of the cast component which will be produced from the new alloy [6]. Another issue to consider is that if the Al-Cu alloy contains a high Si content, this increases the free Si in the aluminum matrix which causes problems from the machinability point of view [7, 8]. To overcome the limitation of Al-Cu alloys, extensive efforts have been made for producing new lightweight Al-Cu casting alloys with acceptable levels of tensile properties, and that are easy to recycle. One of these new alloys is GM220 alloy, being developed by TAMLA (
T
echnologieA
vancée desM
étauxL
égers pour lesA
pplications Automobiles) research group at Université du Québec à Chicoutimi (UQAC) and General Motors, as a promising alloy for use in engine block and cylinder head applications [9].GM220 alloy contains 2.4 wt.% Cu, 1.2 wt.% Si, 0.4 wt.% Mg, 0.4 wt.% Mn and 0.15 wt.% Ti. Based on this composition, the new alloy has the same phases found in A319 alloy expect for the Al-Si eutectic phase, which ensures a significant response to the precipitation hardening process; in addition to this, its chemical composition makes the new alloy lighter and cheaper to produce than A319 alloys that contains 5.5-6.5 wt.% Si and around 4.0 wt.% Cu. Accordingly, the new alloy can replace 319 alloys in similar applications since it provides higher yield and tensile strengths than does the 319 alloy [7].
Despite the good properties expected of the new alloy, it exhibits a high susceptibility to hot tearing which, in turn, leads to a decrease in the castability and lowers the casting quality, thus leading to deterioration in the tensile properties. The reasons for hot tearing in the new alloy are the low content of Si and Cu which decreases the amount of eutectic silicon formed and results in the long freezing range of the alloy [7].
These drawbacks hindered the use of the Al-Cu alloy GM220 in the industrial sector, so that the alloy required further research and development. In this context, the TAMLA research group conducted various studies to enhance the performance of this alloy to make it suitable for automotive industrial applications. The findings of these studies are discussed briefly and summarized in the following paragraphs.
Nabawy [7] investigated the influence of zirconium (Zr) and scandium (Sc) additions, on the microstructure, tensile properties, and hot tearing susceptibility (HTS) of GM220 alloy. It was found that the hot tearing susceptibility (HTS) decreased proportionally as the mold temperature was increased, decreasing from 21 to 3.0 as the mold temperature was increased from 250 o to 450 oC. Also, it was found that Ti-B or Zr-Ti-B grain refinement additions enhanced the hot tearing resistance of the alloy to a significant level, whereas increasing the Si content reduced the HTS of GM220 alloy [10, 11].
Elgallad [8] investigated the effect of additives of Sr, Ti, Zr, Fe, Mn, and Ag as well as free cutting elements, specifically Sn and Bi, on the mechanical properties and machinability of GM220 alloy in both the as-cast and heat treated conditions. The results showed that:
The additions of Sr refined the morphology of the α-Fe Chinese script phase and led to a slight improvement in the ductility.
The additions of Zr improved the tensile properties due to grain refining action. Increasing the amount of Fe increased the precipitation of the Chinese script α-Fe
phase particles, thus decreasing the tensile properties.
The addition of Ag has no obvious effect to the strength; this is attributed to the presence of Si, which hinders the vital role of Ag in precipitation hardening.
The addition of Bi reduces the strength properties in the heat -treated conditions as a result of the Bi-Mg interaction which suppresses the precipitation of the Mg-hardening phases.
The addition of Sn decreases the strength properties due to the softening effect of Sn and the replacement of Si with Sn in the Mg-hardening phase Mg2Si, as well as the
formation of porosity arising from the melting of Sn during solution heat treatment. From the machinability point, the results showed that, with respect to machining
performance, GM220 alloys display an acceptable compromise in machining performance between that of A356 and B319 alloys on the one hand, and that of the A319 alloy on the other [12, 13].
In another study, Zaki [14] investigated the effects of different alloying additions of Sr, Ti, Zr, Sc, and Ag, individually or in combination, on the performance of GM220 alloy.
The tensile test bars used in this study were prepared employing the low pressure die casting (LPDC) technique. The results showed that the alloy containing (0.5 % Zr + 0.15% Ti ) was the most effective in maximizing the alloy tensile properties over the range of aging temperatures from 155 o to 300 oC. Also, adding Ag simultaneously with 0.27 wt.% Zr was beneficial at high aging temperatures, in the range of 240 o-300 oC; with high addition of Zr (about 0.62 wt%), however, addition of Ag was less effective at the same level of Ti [6].
In spite of these previous studies, further investigations are still needed to fill in missing gaps of information in regard to the effects all metallurgical parameters (alloying additions, heat treatment conditions and testing temperature ) on the mechanical properties of this alloy to acquire a comprehensive understanding of its behavior in the context of automotive components, particularly in regard to its performance under high temperature service conditions. The present research study was undertaken for this reason.
1.3 DEFINITION OF THE PROBLEM
Eutectic silicon is a dominant constituent phase in Al-Si alloys, and refining its morphology can further enhance the attractive characteristics of these alloys. The practice of eutectic modification has been developed to produce a refined eutectic structure and can be brought about by using modifier additions, termed chemical modification [15, 16] and/or by applying a high cooling rate, termed quench or chill modification [17, 18].
In chemical modification, commonly used modifier additions such as strontium (Sr), sodium (Na), calcium (Ca), and antimony (Sb) are added to the alloy melt in trace amounts to modify the eutectic silicon morphology from an acicular to a fine fibrous form. However, these traditional modifiers are associated with certain limitations such as fast fading in the case of Na, formation of porosity with the addition of Sr, and toxicity in the case of Sb.
Nevertheless, strontium is most commonly used in industry due to its overall advantages compared to the others. However, the fact that its utilization increases the amount of dross restricts its usage in practice.
Rare earth (RE) metals have also been investigated as modifiers, one of the reasons being their availability in abundance in nature in the form of mischmetal (MM). Cerium (Ce) and Lanthanum (La) elements together comprise approximately 90% of mischmetal (MM) in addition to praseodymium (Pr) and neodymium (Nd). These two elements La and Ce are also the cheapest among the sixteen members of the rare earth metal family [19].
In the case of RE metals, their atomic radii relative to that of silicon (r/rsi( lies in the
order of ~1.65, a value conducive to modification via the twin plane re-entrant edge )TPRE( mechanism, which promotes the fibrous coral-like growth of the eutectic silicon phase. Generally, from the point of view of modification of the Si phase, all the rare earth metals have an atomic radius ratio that theoretically satisfies the modification efficiency criterion in that the ratio of the modifier element atomic radius relative to that of Si, viz., r/rSi, is close to
the optimal value of ~1.65, as shown in Figure 1.3.
Although the previous studies reported in the literature [19] investigated the modification effects of rare earth metals, the mechanism of modification using these elements is still unclear. For example, Nogita et al. [20] investigated the role of Eu and Yb in the modification of Al-10%Si alloys, selecting these two rare earth elements as having the most optimal r/rSi ratios. They found, however, that despite these optimal ratios, only Eu showed
a uniform distribution of the modified eutectic Si fibres, similar to the case of Sr modification; whereas Yb precipitated, but not in the eutectic Si or Al, resulting in a refinement of the plate-like eutectic Si rather than a flake-to-fibrous transition. They concluded that the r/rSi ratio used to predict impurity-induced twinning behavior observed in
Si fibres is not sufficient in itself and that all microstructures exhibiting fibrous eutectic silicon must exhibit a uniform distribution of the modifier in the Si phase.
Figure 1.3: Ratio of atomic radii vs. atomic number [21].
In addition to eutectic modification, the ability of RE metals to refine the microstructure of an aluminum alloy, namely the grain size [22], secondary dendrite arm spacing (SDAS) [23, 24] and the β-iron Al5FeSi intermetallic phase has also been documented in the literature
[25]. However, previous literature reveals that there is a lack of investigations on (i) the morphology, size and distribution of the RE-containing intermetallic compounds formed, and (ii) their influence on the tensile properties.
As the use of RE as modifiers has increased in the recent past, this area of research has become increasingly important and needs to be addressed more comprehensively. With this in mind, the main contribution of the current study was to investigate thoroughly the
effects of Cerium (Ce) and Lanthanum (La) on the microstructure and performance of GM220 alloy. A small addition of Strontium (Sr), in the amount of 150 ppm, was also used for purposes of comparison.
1.4 THESIS OBJECTIVES
The main aim of this Ph.D. research project was to investigate the effects of La and Ce additions on the tensile properties of two series of GM220 alloys, subjected to various heat treatment conditions. The two series were prepared using: (i) low Si (1.2 wt.%) B0 alloy, and (ii) high Si (8.0 wt.%) D0 alloy as the base alloys. The influence of individual additions of La and Ce on the microstructure, and the resulting properties and fracture behaviour were also studied. The main objectives of the current study therefore covered:
1. Examining the influence of 1.0 and 5.0 wt.% of Ce and La on the microstructural features and solidification behaviour of the alloys prepared in order to have a better understanding of the phases and intermetallics present in the structure.
2. Studying the effect of the following metallurgical parameters on the tensile properties and the quality index values of B0 and D0 alloys :
i. La additions (0.2, 0.5, 1.0 wt.%); ii. Ce additions (0.2, 0.5, 1.0 wt.%); iii. Sr addition (150 ppm);
iv. Heat treatment conditions.
Solution heat treatment (SHT) at 510 oC for 8 hours ;
T5 (aging at 180 oC for 8 hours) ;
T6 (SHT at 510 oC for 8 hours followed by 8 hours aging at 180 oC);
3. Studying the high temperature tensile properties of T6-heated B0 and D0 alloys subjected to one and 200 hrs of stabilization at the testing temperature of 250 oC with the different additions of Ce and La (0.2, 0.5, 1.0 wt.%).
4. Correlating the room and high temperature mechanical properties with the microstructural features of the corresponding alloys.
5. Using quality charts based on the tensile properties obtained for various alloy/heat treatment conditions in order to recommend the optimum parameters /conditions for improving the properties of GM220 alloys for use in specific industrial applications.
1.5 THESIS ORGANIZATION
This thesis is scientifically organized into eight chapters as follows:
The opening chapter, CHAPTER 1, defines the motivation and objectives of this research work.
CHAPTER 2 pertains to the literature review covering the general aspects of Al-Cu alloys, followed by an extensive review of the previous studies and investigations on the effect of different types of RE metals on the performance of aluminum alloys.
CHAPTER 3 presents the experimental procedures used and provides details of the alloys and additives used in the current study, the casting and heat treatment procedures used, and the various mechanical testing and microstructural characterization methods employed for determining the alloy properties and examining the microstructures of the alloys obtained in this study.
CHAPTER 4 presents an analysis of the solidification behaviour of the alloys investigated, using differential scanning calorimetry (DSC) and thermal analysis (TA) techniques.
CHAPTER 5 presents the results of the microstructural characterization and phase identification using: (i) Scanning electron microscope (SEM) with Energy dispersive x-ray spectroscopy (EDS) facilities, and (ii) Electron probe micro-analyzer (EPMA) with wavelength dispersive spectroscopy(WDS) facilities.
CHAPTER 6 presents the tensile test results of the investigated alloy obtained at room temperature, while CHAPTER 7 provides the results obtained at elevated temperature, together with a section on the fracture behavior of the tested alloy samples.
CHAPTER 8 presents the conclusions of this study based on the findings presented in CHAPTER 4 through 7, and recommendations for future work. Finally, a list of references and appendices are provided at the end of the thesis.
CHAPTER 2
CHAPTER 2
LITERATURE REVIEW
2.1 FUNDAMENTALS BACKGROUND OF Al-Cu ALLOYS
2.1.1 Microstructure of Al-Cu Alloys
The solidification of Al-Cu alloys starts with the development of a dendritic network followed by a eutectic reaction in the interdendritic regions by means of which the eutectic Al2Cu is formed in combination with the remaining aluminum [26]. Consequently, the
microstracture of Al-Cu alloys consists mainly of primary α-A1 and the Al2Cu phase. In
order to meet the requirements of rapidly developing industrial applications, major alloying elements such as Si and Mg, minor alloying elements such as Ni and Sn, and elements like Ti, Sr, and Mn which modify the microsturcutre are added to Al-Cu alloys to improve their mechanical properties (Figure 2.1) [27]. The addition of these elements is associated with the formation of much more complex intermetallic compounds, part of which are insoluble.
One of the critical issues with respect to the microstructure of Al-Cu alloys is the unwanted presence of impurities in Al-Cu alloys, in particular, iron (Fe) which in turn leads to the formation of insoluble Fe-intermetallic such as π-Al8Mg3FeSi6, β-Al5Fe2Si, and
α-Al15(Mn, Fe,Cu)3Si2. These intermetallics are harmful and adversely affect the mechanical
properties of the alloy, especially ductility, and lead to formation of excessive shrinkage porosity defects in the casting. A number of investigators have mentioned that the presence of the β-Al5FeSi iron intermetallic phase prevents the liquid metal feeding by blocking the
Figure 2.1: Effect of alloying elements on the performance of Al-Cu alloys [27].
2.1.2 Heat Treatment of Al-Cu Alloys
Heat treatment is one of the main techniques applied to enhance the mechanical properties of aluminum casting alloys. Aluminum-copper cast alloys are considered heat-treatable alloys. Figure 2.2 illustrates the temperature ranges of the heat treatments applied to Al-Cu alloys. From Figure 2.2 it may be noted that in order to produce a complete solid solution, the solution heat treatment range of Al-4.5Cu alloy is 515 to 550°C in which the Cu completely dissolves (Figure 2.2). This solid solution will become supersaturated as the temperature decreases to below 515°C. In order to produce the age hardening of an Al-4.5Cu alloy, it should be maintained within a temperature range of 150°C to 220°C for a pre-determined aging period. [31]. In general, in order to age harden Al-Cu alloys, it is important
Al-Cu Alloys (I) Major Alloying Elements (Si, Mg) (II) Minor Elements (Ni, Sn) (II) Microstructure Modifying Elements (Ti, Mn, Sr) Al-Cu Alloys
(Si) Good castability (Mg) Improve the work hardening (Mg) Enhance the corrosion resistance and the weldability
(Ni) Improve the hot hardness
(Sn) Reduce friction in bearing and bushing application
(Ti) Improve corrosion properties
(Mn) improves low cycle fatigue resistance (Sr) eutectic Si modifier
to conduct the heat treatment process through three steps, as follows: (i) solution heat treatment, (ii) quenching, and (iii) aging, which will be discussed briefly and summarized in subsections 2.1.2.1, 2.1.2.2, and 2.1.2.3, respectively.
Figure 2.2: Heat treatment temperature range for heat treating of Al-Cu alloys [31]. 2.1.2.1 Solution Heat Treatment
The solution heat treatment process is carried out to maximize the solubility of elements in the matrix such as Cu and Mg, to help in dissolving the intermetallic phases which are formed during solidification, and to increase the homogeneity of the microstructure. Temperature and time are the main parameters which control the solution heat treatment process. The temperature of solution treatment, in particular, is considered a critical parameter in Cu-containing alloys due to the occurrence of incipient melting of the Cu phases. Copper (%) T e m p e ratu re ( o F ) T e m p erat ure (
o C) Temperature range for
solution heat treating Temperature range for
annealing Temperature range for
precipitation heat treating Al+CuAl2 Al+L (b) (a) 200 400 600 800 1400 1200 1000 800 600 400 200 10 12 8 6 2
![Figure 1.2 : Evolution of aluminum as a cylinder head material over approximately the past two decades [4, 5]](https://thumb-eu.123doks.com/thumbv2/123doknet/7536504.228032/27.918.201.767.403.801/figure-evolution-aluminum-cylinder-head-material-approximately-decades.webp)
![Figure 2.1: Effect of alloying elements on the performance of Al-Cu alloys [27].](https://thumb-eu.123doks.com/thumbv2/123doknet/7536504.228032/39.918.170.785.128.579/figure-effect-alloying-elements-performance-al-cu-alloys.webp)
![Figure 2.2: Heat treatment temperature range for heat treating of Al-Cu alloys [31].](https://thumb-eu.123doks.com/thumbv2/123doknet/7536504.228032/40.918.152.810.257.649/figure-heat-treatment-temperature-range-heat-treating-alloys.webp)
![Figure 2.3: Partial equilibrium diagram of Al-Cu alloys representing the solvus lines of the metastable and equilibrium phases [45]](https://thumb-eu.123doks.com/thumbv2/123doknet/7536504.228032/43.918.299.660.601.955/figure-partial-equilibrium-diagram-alloys-representing-metastable-equilibrium.webp)
![Figure 2.4: Example of quality chart proposed by Drouzy et al. [46]](https://thumb-eu.123doks.com/thumbv2/123doknet/7536504.228032/46.918.220.738.205.565/figure-example-quality-chart-proposed-drouzy-et-al.webp)
![Figure 2.6: The quality index chart proposed by Câceres for A356 alloy [48].](https://thumb-eu.123doks.com/thumbv2/123doknet/7536504.228032/49.918.201.746.107.486/figure-quality-index-chart-proposed-câceres-a-alloy.webp)