IMP = 0 mg/L IMP = 0.01 mg/L IMP = 0.1 mg/L IMP = 1 mg/L 20 50 100 200 500 1000 K 20 50 100 200 500 1000 K 20 50 100 200 500 1000 K 20 50 100 200 500 1000 K
A
B
C
D
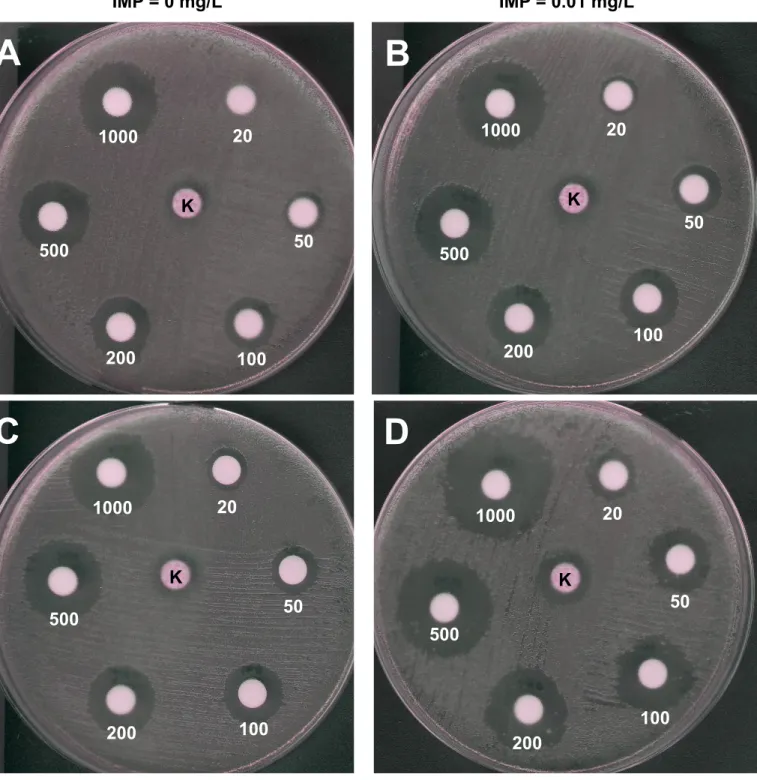
Figure S1. Zeocin susceptibility of the pCR2.1 PNDM-blaNDM-1-bleMBL E. coli TOP10 clone by disc diffusion method.
White numbers (20, 50, 100, 200 and 1000) represent the quantity (µg) of zeocin with which the discs have been impregnated. The pCR2.1 PNDM-blaNDM-1-bleMBL E. coli TOP10 clone was growm on Mueller-Hinton medium supplemented with imipenem at 0 (Panel A), 0.01 (Panel B), 0.1 (Panel C) and 1 mg/l (Panel D), respectively. K, Kanamycin at 30 µg (antibiotic marker of the pCR2.1 plasmid).
Figure S2. Secondary structure representation of the BRPMBL model in complex with two bleomycin molecules (stick representation). Chains A and B are colored in orange and green, and the corresponding bleomycin ligands in cyan and yellow, respectively.