HAL Id: hal-02075340
https://hal-amu.archives-ouvertes.fr/hal-02075340
Submitted on 21 Mar 2019
HAL is a multi-disciplinary open access
archive for the deposit and dissemination of
sci-entific research documents, whether they are
pub-lished or not. The documents may come from
teaching and research institutions in France or
abroad, or from public or private research centers.
L’archive ouverte pluridisciplinaire HAL, est
destinée au dépôt et à la diffusion de documents
scientifiques de niveau recherche, publiés ou non,
émanant des établissements d’enseignement et de
recherche français ou étrangers, des laboratoires
publics ou privés.
incomplete lineage sorting and hybridization: Lessons
from Ophioderma (Ophiuroidea: Echinodermata)
Alexandra Anh-Thu Weber, Sabine Stöhr, Anne Chenuil
To cite this version:
Alexandra Anh-Thu Weber, Sabine Stöhr, Anne Chenuil.
Species delimitation in the
pres-ence of strong incomplete lineage sorting and hybridization: Lessons from Ophioderma
(Ophi-uroidea: Echinodermata). Molecular Phylogenetics and Evolution, Elsevier, 2019, 131, pp.138-148.
�10.1016/j.ympev.2018.11.014�. �hal-02075340�
Contents lists available atScienceDirect
Molecular Phylogenetics and Evolution
journal homepage:www.elsevier.com/locate/ympev
Species delimitation in the presence of strong incomplete lineage sorting and
hybridization: Lessons from Ophioderma (Ophiuroidea: Echinodermata)
Alexandra Anh-Thu Weber
a,b,⁎, Sabine Stöhr
c, Anne Chenuil
a aAix Marseille Univ, Avignon Université, CNRS, IRD, IMBE, Marseille, FrancebZoological Institute, University of Basel, Vesalgasse 1, 4051 Basel, Switzerland
cSwedish Museum of Natural History, Department of Zoology, Box 50007, 10405 Stockholm, Sweden
A R T I C L E I N F O
Keywords:
Approximate Bayesian Computation Multi-species coalescent
Discriminant Analysis of Principal Components Cryptic species
Echinoderms Ophiuroidea
A B S T R A C T
Accurate species delimitation is essential to properly assess biodiversity, but also for management and con-servation purposes. Yet, it is not always trivial to accurately define species boundaries in closely related species due to incomplete lineage sorting. Additional difficulties may be caused by hybridization, now evidenced as a frequent phenomenon. The brittle star cryptic species complex Ophioderma longicauda encompasses six mi-tochondrial lineages, including broadcast spawners and internal brooders, yet the actual species boundaries are unknown. Here, we combined three methods to delimit species in the Ophioderma longicauda complex and to infer its divergence history: (i) unsupervised species discovery based on multilocus genotypes; (ii) divergence time estimation using the multi-species coalescent; (iii) divergence scenario testing (including geneflow) using Approximate Bayesian Computation (ABC) methods. 30 sequence markers (transcriptome-based, mitochondrial or non-coding) for 89 O. longicauda and outgroup individuals were used. First, multivariate analyses revealed six genetic clusters, which globally corresponded to the mitochondrial lineages, yet with many exceptions, sug-gesting ancient hybridization events and challenging traditional mitochondrial barcoding approaches. Second, multi-species coalescent-based analyses confirmed the occurrence of six species and provided divergence time estimates, but the sole use of this method failed to accurately delimit species, highlighting the power of mul-tilocus genotype clustering to delimit recently diverged species. Finally, Approximate Bayesian Computation showed that the most likely scenario involves hybridization between brooders and broadcasters. Our study shows that despite strong incomplete lineage sorting and past hybridization, accurate species delimitation in Ophioderma was possible using a combination of complementary methods. We propose that these methods, especially multilocus genotype clustering, may be useful to resolve other complex speciation histories.
1. Introduction
Accurate species delimitation and description is essential to prop-erly assess biodiversity, but also for management and conservation purposes (Agapow et al., 2004; De Queiroz, 2007). Historically and still nowadays, the vast majority of species are delimited using morpholo-gical characters, based on descriptions of type specimens for each nominal species, uniquely identified by Latinized names in the bi-nominal nomenclature codified first by Linnaeus in the 18th century (for zoology (Linnaeus, 1758)). However, genetically isolated groups of morphologically indistinguishable individuals were detected in many nominal species during the last decades, owing to the use of genetic markers in population genetic studies (Bickford et al., 2007; Knowlton, 1993; Pfenninger and Schwenk, 2007). Such groups are often called cryptic species (Struck et al., 2018), which are widely spread and
homogeneously distributed across the metazoan biodiversity (Pfenninger and Schwenk, 2007). The occurrence of cryptic species can be explained with several main factors: (i) recent species divergence (i.e. morphological differences may not have evolved yet); (ii) paral-lelism or convergence (i.e. cryptic species are not closely related but morphologically similar due to selection pressures); (iii) morphological stasis (i.e. decreased morphological disparity compared to genetic di-vergence) (Struck et al., 2018)). Cryptic species werefirst identified by diagnostic codominant markers such as allozymes (e.g. Knowlton, 1993) and then, in most cases, by single mitochondrial markers (e.g.
Hebert et al., 2004). Even presently, they are rarely identified using a combination of several molecular markers and phenotypic data (Struck et al., 2018).
Due to their lower effective size, genetic markers from haploid genomes are more affected by genetic drift and thus reach reciprocal
https://doi.org/10.1016/j.ympev.2018.11.014
Received 3 May 2018; Received in revised form 15 November 2018; Accepted 16 November 2018
⁎Corresponding author at: Marine invertebrates, Museums Victoria, GPO Box 666, Melbourne, VIC 3001, Australia.
E-mail addresses:aweber@museum.vic.gov.au(A.A.-T. Weber),sabine.stohr@nrm.se(S. Stöhr).
Available online 20 November 2018
1055-7903/ © 2018 Elsevier Inc. All rights reserved.
monophyly (i.e. alleles of distinct species form separate monophyletic groups) more rapidly than markers from nuclear genomes after species divergence. This explains their power to detect recently diverged cryptic species and their wide use for biodiversity barcoding (Bucklin et al., 2011). However, absence of gene flow among groups of in-dividuals cannot be established on the basis of markers from single haploid genomes since past bottlenecks or selective sweeps may gen-erate patterns of divergent groups of closely related haplotypes within a panmictic entity (i.e. a group of randomly mating individuals). In ad-dition, mitochondrial markers only reflect the history of maternal lineages, which can be significantly different from the species history if males and females display different dispersal behaviors. Finally, past hybridization events can be misleading for species identification based on mitochondrial barcodes, as mitochondrial lineages can be incon-gruent with the species history (Currat et al., 2008; Melo-Ferreira et al., 2014).
Finding independent markers confirming mitochondrial divergence may be difficult for recently diverged species, especially in non-model organisms with scarce to non-existing available genomic data. The most intuitive and popular approach for cryptic species delimitation consists offinding independent markers displaying reciprocal monophyly that are congruently associated within individuals (in linkage dis-equilibrium) (De Queiroz, 2007; Mkare et al., 2017). However, con-firming absence of gene flow should not rely on finding reciprocal monophyly in independent markers (Zhang et al., 2011) for the fol-lowing reasons: (i) Recently diverged species, especially when their reproductive isolation is conferred by a single locus or few loci, rarely display reciprocally monophyletic markers, as most loci are either monomorphic or display shared polymorphism among species (i.e. in-complete lineage sorting). (ii) Recently diverged species may display diagnostic markers but not reciprocal monophyly when diagnosticity resulted from genetic drift (allele loss) but mutation events were not sufficient to create a pattern of reciprocal monophyly. (iii) There are other means to establish absence of gene flow using a set of in-dependent genetic markers (e.g. the diagnosticity of a single Mendelian marker is sufficient, and see approaches based on multilocus genotype developed below).
Various methods (reviewed inCarstens et al., (2013)) propose to delimit species using nucleotide sequences from several markers. Some of these methods are based on divergence levels or consider ratio of within-group and between-group diversity to delimit species (e.g. the automatic barcoding gap discovery ABGD, (Puillandre et al., 2012). Although they provide powerful tools to propose primary species hy-potheses for large datasets (Ratnasingham and Hebert, 2007), such approaches cannot prove the absence of geneflow and often depend on arbitrary thresholds or assumptions such as constant effective sizes among ancestor and daughter species. The multispecies coalescent theory (Fujita et al., 2012; Yang and Rannala, 2010) provides a statis-tical framework to model the coalescence of multiple markers during genetic isolation of groups of individuals. Bayesian methods applied to the multispecies coalescent allow establishing the probability of species partitions and phylogenies for a sample of allele sequences from various individuals (Rannala, 2015; Yang and Rannala, 2010) and the most recent development of this method, implemented in the software BPP (Yang, 2015), allows the joint inference of species (or lineage) delimi-tation and species phylogeny (Rannala and Yang, 2017; Yang and Rannala, 2014). However, despite these qualities and being able to handle some degree of Incomplete Lineage Sorting (ILS) (Carstens et al., 2007), the efficiency of these methods depend for a large part on the
accumulation of mutations since species separation, and thus can only delimit entities isolated long enough (Rannala, 2015). By contrast, methods based on multilocus genotypes (e.g. Structure (Falush et al., 2003), Structurama (Huelsenbeck et al., 2011), DAPC (Jombart et al., 2010)), although rarely used for species delimitation, can potentially reveal absence of geneflow after a single generation as they do not rely on information on allele relationships, like sequences, but use
multilocus genotypes for each individual. In addition, they provide a fast and unbiased way offinding genetically separated entities, as they do not rely on a priori knowledge on individual grouping.
Even though much progress has been made in species tree estima-tion methods, the use of species trees implies that speciaestima-tion is re-presented as a dichotomic process. Yet, there is increasing evidence for the role of hybridization and reticulate evolution in or after speciation (Abbott et al., 2013, 2016; Lamichhaney et al., 2017; Meier et al., 2017). Current species discovery and delimitation methods do not allow for testing such cases, but Approximate Bayesian Computation (ABC) provides powerful methods allowing to do so (Csilléry et al., 2010; Lopes and Beaumont, 2010), with the simultaneous testing of several divergence scenarios (with or without hybridization) and esti-mation of demographic parameters (e.g. divergence times, effective population sizes, migration rates). These methods are computationally efficient, especially when using a small (tens or hundreds) number of loci, as they use simulated datasets for which several summary statistics are compared to the original dataset (instead of likelihood computa-tions). Thus, information rich datasets such as sequence genotypes at tens of loci in a hundred individuals can be exploited using ABC.
Brittle stars (Ophiuroidea) encompass a large number of cryptic species (e.g.Barboza et al., 2015; Baric and Sturmbauer, 1999; Boissin et al., 2017, 2008; Heimeier et al., 2010; Hoareau et al., 2013; Hunter and Halanych, 2008; Muths et al., 2009, 2006; Naughton et al., 2014; Pérez-Portela et al., 2013; Sponer and Roy, 2002; Stöhr and Muths, 2010; Taboada and Pérez-Portela, 2016). The Ophioderma longicauda (Bruzelius, 1805) species complex encompasses six mitochondrial lineages and at least two sympatric biological species with contrasting reproductive strategies, namely the broadcast spawners C3 and the internal brooders C5, differing in reproductive timing, morphology, ecology and genetics (Boissin et al., 2011; Stöhr et al., 2009; Weber et al., 2015, 2014, 2013). Yet, the species relationships among all mi-tochondrial lineages across the whole O. longicauda distribution remain unclear.
We used 30 sequence markers to delimit species and infer diver-gence history of this complex of cryptic species using a combination of three methods: (i) unsupervised species discovery using multilocus genotypes; (ii) confirmation of lineage genetic isolation and divergence time estimates using the multi-species coalescent; (iii) divergence sce-nario testing using ABC. We found that combining all three methods that use different properties of the data provides complementary in-formation such as number of species, among species relationships, di-vergence time, effective population size and gene flow estimates to best represent complex speciation history. Furthermore, the use of multi-locus genotypes performed better than the multispecies coalescent to delimit recently genetically isolated clusters.
2. Material and methods
2.1. Sampling, DNA extraction and marker development
89 individuals including the six O. longicauda mitochondrial lineages (L1–L6) sampled across the whole O. longicauda distribution and three outgroup species (Ophioderma teres (Lyman, 1860), Ophioderma cinerea (Müller & Troschel, 1842) and Ophioderma phoenia (H.L. Clark, 1918)) were used in this study (Table 1, Table S1). Ophioderma outgroups were used to estimate divergence times of the O. longicauda species complex, the latter occurring in the North-East Atlantic Ocean and in the Mediterranean Sea (Fig. 1). Indeed, the species O. teres (Eastern Pacific Ocean), O. phoenia and O. cinerea (West Atlantic Ocean) are geminate pairs that speciated after the closing of the Isthmus of Panama, so the divergence between these species pairs (O. teres– O. phoenia or O. teres – O.cinerea) is at least 2.8 Mya (Lessios, 2008). DNA was extracted with MN-Tissue Kit (Macherey-Nagel) using an epimotion robot (Eppendorf) following the protocol ofRibout and Carpentieri (2013), and eluted in 200 µl of sterile water. Extracted DNA
was diluted 10x in sterile water prior to PCR and 1 µl of DNA was used for PCR amplification. We used orthologous genes from transcriptomes of O. longicauda C3 and C5 (Weber et al., 2017), corresponding to mi-tochondrial lineages L1 and L3, respectively (Weber et al., 2015) to
develop 55 primer pairs to test. The criteria for locus development were: (i) the locus should be polymorphic; (ii) in half of the loci, at least one diagnostic SNP between C3 and C5 should be present; (iii) the length of the PCR product should be 300–400 bp (due to sequencing
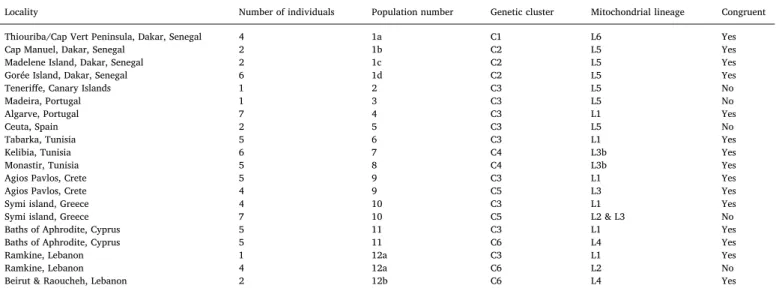
Table 1
Correspondence between genetic clusters found in DAPC, mitochondrial lineages and sampling locations of individuals used in this study. The population numbers refer to the number indicated inFig. 1. C1–C6: genetic clusters or clusters found in DAPC analysis. L1–L6: Ophioderma longicauda mitochondrial lineages defined in
Boissin et al. (2011). Congruent: congruence between mitochondrial lineage and nuclear data (genetic cluster).
Locality Number of individuals Population number Genetic cluster Mitochondrial lineage Congruent
Thiouriba/Cap Vert Peninsula, Dakar, Senegal 4 1a C1 L6 Yes
Cap Manuel, Dakar, Senegal 2 1b C2 L5 Yes
Madelene Island, Dakar, Senegal 2 1c C2 L5 Yes
Gorée Island, Dakar, Senegal 6 1d C2 L5 Yes
Teneriffe, Canary Islands 1 2 C3 L5 No
Madeira, Portugal 1 3 C3 L5 No
Algarve, Portugal 7 4 C3 L1 Yes
Ceuta, Spain 2 5 C3 L5 No
Tabarka, Tunisia 5 6 C3 L1 Yes
Kelibia, Tunisia 6 7 C4 L3b Yes
Monastir, Tunisia 5 8 C4 L3b Yes
Agios Pavlos, Crete 5 9 C3 L1 Yes
Agios Pavlos, Crete 4 9 C5 L3 Yes
Symi island, Greece 4 10 C3 L1 Yes
Symi island, Greece 7 10 C5 L2 & L3 No
Baths of Aphrodite, Cyprus 5 11 C3 L1 Yes
Baths of Aphrodite, Cyprus 5 11 C6 L4 Yes
Ramkine, Lebanon 1 12a C3 L1 Yes
Ramkine, Lebanon 4 12a C6 L2 No
Beirut & Raoucheh, Lebanon 2 12b C6 L4 Yes
Fig. 1. Map of sampling localities with colors corresponding to genetic clusters found with DAPC. 1: Dakar, Senegal. 2: Tenerife, Canary Islands, Spain. 3: Madeira, Portugal. 4: Algarve, Portugal. 5: Ceuta, Spain. 6: Tabarka, Tunisia. 7: Kelibia, Tunisia. 8: Monastir, Tunisia. 9: Agios Pavlos, Crete, Greece. 10: Symi island, Greece. 11: Baths of Aphrodite, Cyprus. 12: Ramkine, Beirut and Raoucheh, Lebanon. A photograph of O. longicauda C3 from Marseilles, France, is displayed for illustration. Photo credit: Frédéric Zuberer.
technology limitations). In addition, seven already existing loci were used, namely a mitochondrial locus (COI), ribosomal loci (ITS1, ITS2) and four EPIC loci, introns i21, i36, i50 and i54b (Chenuil et al., 2010; Gérard et al., 2013; Penant et al., 2013). Of the 55 exon-based loci tested, 16 amplified correctly in each lineage of O. longicauda. Fur-thermore, six out of seven existing loci amplified correctly. Finally, 22 loci were PCR amplified in the 89 specimens.
2.2. Amplicon sequencing and dataset processing
PCR products of different genes belonging to the same individual were pooled according to agarose gel quantification, i.e. quantities of PCR product were adjusted for pooling according to the band intensity on agarose gel. 96 Illumina libraries were then constructed using MiSeq Reagent Kits v2 (Illumina). Paired-end (2× 250 pb) sequencing of the 96 libraries was performed on a single run of MiSeq Sequencing System (Illumina). Library preparation and subsequent sequencing were per-formed by the genomic platform Genotoul (www.genotoul.fr). About thirty millions raw reads were obtained after sequencing. For each li-brary, Illumina adapters were trimmed, forward and reverse reads were assembled and demultiplexed by locus using the program MOTHUR v 1.31.2 (Schloss et al., 2009). On average, between 1000 and 10,000 reads were obtained per locus and per individual. Then, identical reads were clustered and the number of reads per locus and per individual was counted.
As the number of reads differed greatly between loci (less than 100 reads to more than 1000 reads), applying afixed threshold to keep final sequences was not possible. In addition, five loci displayed paralogs (i.e. more than two sequences with high and similar number of reads displayed). For this reason, selecting the sequence displaying the highest number of reads could lead to incorrectly selecting and clus-tering paralogs. Therefore, for each of the 22 loci, the number of reads obtained for 5–10 individuals was manually checked to determine a threshold to apply to each individual per locus. One (for homozygous individuals) or two sequences (for heterozygous individuals) were kept per individual and per locus when paralogs were unambiguously ab-sent, and up to ten sequences per individual and per locus were kept when paralogs were detected. Of the 22 loci, three could not be used due to a too low number of reads obtained after sequence cleaning. A total of 18 loci were obtained, and five of them displayed paralogs (11,915, 50,183, 68,241, 80,488 and 109,458). Linkage equilibrium was tested among all paralogs from the same locus using Genetix (Belkhir et al., 2004). All paralogs displayed linkage equilibrium (i.e. the markers were independent) except three paralogs that displayed statistically significant linkage disequilibrium (50183-II, 50183-III and 50183-IV; p < 0.05). Therefore, these three paralogs were con-catenated and considered as a single marker for all subsequent analyses. Finally, a total of 30 markers were available for further analyses (Table S2).
2.3. Haplotype networks and mitochondrial distances
For each analysis performed in this study, a summary of number of
markers used and data type is displayed inTable 2. For each marker, haplotype networks were generated using the median-joining algorithm of Network, version 4.6.1.1 (Bandelt et al., 1999). Kimura 2-parameter (K2P) pairwise distances (Kimura, 1980) among mitochondrial lineages (or among species when considering outgroups) were calculated using MEGA v7 (Kumar et al., 2016). The within-group K2P distances were calculated in the same way.
2.4. Species discovery: Principal Component Analysis (PCA) and Discriminant Analysis of Principal Components (DAPC)
In order to determine the number of existing genetic groups without prior knowledge (i.e. mitochondrial lineage or geographic origin), we performed a Discriminant Analysis of Principal Components (DAPC) using the R software package adegenet 1.4-1 (Jombart et al., 2010). The DAPC is a clustering method that maximizes the between-group var-iance while minimizing the within-groups varvar-iance. This analysis uses genotypic information for each individual and each locus. Therefore, we converted our sequence data in genotype data using PGDspider v.2.1 (Lischer and Excoffier, 2012). Then, the minimum value of the Bayesian Information Criterion (BIC) was used to determine the optimal number of genetic clusters k, implemented in adegenet. After that, DAPC was performed to define the clusters and visualize their relationships. It also provides membership probabilities, i.e. the per individual prob-ability of belonging to a particular cluster. Analyses were performed including and excluding the mitochondrial marker COI to infer whether it significantly influenced the genetic clustering. Pairwise FSTwas
cal-culated for the six genetic clusters found with the DAPC analysis (see Results) using Genetix (Belkhir et al., 2004). In order to infer dispersal abilities and potential geneflow between allopatric clusters (C2-C3 and C5-C6; see Results), patterns of isolation by distance were investigated. Pairwise FSTamong populations were used as genetic distance.
Geo-graphic distances were measured as the shortest sea distance between populations using Google Maps (https://www.google.com/maps). Mantel tests were performed using Genetix (Belkhir et al., 2004). Fur-thermore, genetic diversity metrics (number of segregating sites; hap-lotype diversity and nucleotide diversity) per cluster were calculated using DNAsp v5.10.01 (Librado and Rozas, 2009).
We then performed a PCA on the multilocus diploid genotypes using adegenet to explore the genetic relationships among individuals without constraint and without a priori knowledge on population membership. We visualized (using colors) the genetic proximity among individuals from the distinct clusters previously identified by the DAPC, but the PCA does not use this information and does not attempt to delimit di-vergent groups. For this reason, it can suggest incomplete separation or hybridizations between the clusters of individuals visualized by distinct colors.
2.5. Lineage confirmation and divergence time estimates: The multi-species coalescent
Since genetic clusters obtained after thefirst approach from multi-locus genotypes appeared as separate genetic entities (see Results) we
Table 2
Summary of number of markers and data type for each analysis performed in this study.
Number of markers Data type Analysis Allelic information used
30 sequence Haplotype network No
1 (COI) Sequence K2P distances No
30 multilocus genotypes DAPC Yes
30 multilocus genotypes PCA Yes
30 multilocus genotypes FST Yes
30 sequence K2P between clusters No
30 sequence BPP No
considered that their relationships could be described by tree-like topologies, possibly assuming geneflow events between some clusters. Based on the genetic clusters found with DAPC, we calculated the average distance between clusters using between-group K2P distances (based on the 30 sequence markers) implemented in MEGA 6.0.5. Then, we reconstructed a phylogenetic tree based on the K2P distances be-tween clusters, using the distance-based Neighbor-Joining method, to define a starting tree for multi-species coalescent based analyses (Fig. 2, scenario 1). Joint Bayesian species delimitation and species tree esti-mation was conducted using the program BPP v3.3 (analysis A11; (Rannala and Yang, 2017; Yang, 2015)). The method uses the multi-species coalescent model to compare different models of species (or lineage) delimitation (Rannala, 2015; Sukumaran & Knowles, 2017) and species (or lineage) phylogeny in a Bayesian framework, ac-counting for incomplete lineage sorting due to ancestral polymorphism and gene tree-species tree conflicts (Rannala and Yang, 2013; Yang and Rannala, 2014, 2010). The population size parameters (θs) are assigned
the gamma prior G(2, 1000), with mean 2/2000 = 0.001. The diver-gence time at the root of the species tree (τ0) is assigned the gamma prior G(2, 100), while the other divergence time parameters are as-signed the Dirichlet prior (Yang & Rannala, 2010: Eq. (2)). After 100,000 burnin iterations, 500,000 MCMC samples were recorded with a sample frequency of 100. Each analysis was run three times to confirm consistency between runs. Analyses were run using the full dataset and species were defined using the clusters found with DAPC.
As it was recently suggested that‘species discovery’ methods may eventually not be necessary due to improvements of algorithms and computational power (Rannala, 2015), we tested the accuracy of BPP alone to discover and delimit species, using a subset of our C3 dataset for computational reasons. Indeed, as each individual is defined as a putative species in BPP, the number of different topologies to test in-creases more than exponentially with each additional individual. Thus, we used C3 (9 individuals) & C5 (11 individuals) specimens from Greece (populations Agios Pavlos and Symi Island), known to represent two sympatric biological species (brooding and broadcast spawning individuals; (Weber et al., 2015, 2014)). By focusing on these sympatric populations, we ensured that approximately the same number of in-dividuals per species was compared, across the same distributional range. A DAPC wasfirst performed on this sub-dataset. Then, each in-dividual was set as a single species in BPP, and three replicate analyses A11 (joint species delimitation and species tree estimation) were per-formed using the same parameters as previously mentioned.
2.6. Divergence model testing using ABC
Species delimitation analyses perform well to determine species number and species phylogeny, but speciation history may be more complex than a simple dichotomic process as is a species tree. We used the PCA results to identify possible cases of hybridization between groups of individuals. More specifically, the positioning of C4 (Tunisian) individuals in the PCA suggested a possible hybridization event between C3 and C5 (see Results). In addition, the C4 individuals displayed incongruent genetic signals between mitochondrial and nu-clear markers previously described (Weber et al., 2015, 2014), as their mitochondrial haplotypes (COI) were closely related to the brooding species C5, whereas their nuclear genotypes (intron i51) were shared with the broadcast spawning species C3. It is noteworthy that i51 was shown to be monomorphic in the brooding species C5 and C6 (Weber et al., 2015).
Then, we used an ABC framework to test eight different models of species divergence (or scenarios) for the Ophioderma longicauda species complex, including or excluding hybridization events (Fig. 2). The posterior probability of each scenario, as well as effective sizes (N), divergence time of each event (t) and admixture rate (r2) were esti-mated using ABC implemented in DIYABC v2.1.0 (Cornuet et al., 2014). Six summary statistics were used to estimate posterior probability of parameters: For the ‘one sample summary statistics’, the number of haplotypes, the number of segregating sites and the mean of pairwise differences were used. For the ‘two-sample summary statistics’, the number of haplotypes, the mean of pairwise differences (between groups) and the FSTstatistics (between groups) were used. For ABC
analyses, data from the six Ophioderma longicauda clusters were used, excluding the outgroups. In addition, eight markers were excluded due to their low amplification success in some clusters (Table S2). Three sequence groups were defined, each one with a different mutation model. Thefirst group included 19 transcriptome-based markers, the second group included the mitochondrial marker COI and the third group included two introns (Table S2). Default priors were used in preliminary analyses (800,000 simulated datasets) and were then ad-justed using posterior distributions and pre-evaluation verifications. When each posterior probability of parameters fell in the prior range in preliminary analyses, 8,000,000 simulated datasets were used to esti-mate posterior probabilities of parameters and each scenario. Model checking was performed using each available summary statistic, to verify that the parameter values of observed data belonged to posterior
Fig. 2. Eight divergence scenarios tested using ABC to infer the evolutionary history of O. longicauda species complex divergence. N: effective population size; t: divergence time; r2: admixture rate.
distributions.
3. Results
3.1. Presence of strong incomplete lineage sorting among clusters
Using transcriptome based markers we successfully amplified, se-quenced and sorted 30 informative genetic markers (Table S2). Net-work analyses showed that the majority of markers displayed in-complete lineage sorting or potential signatures of introgression, except the mitochondrial marker COI and, although partially, the markers 68241_I.I, i50_II and 98699 (Fig. S1). Not only reciprocal monophyly is not observed among previously-identified species (brooding C5 and broadcast spawning C3 in Crete, (Weber et al., 2017, 2015)) but the large majority of alleles are shared among these species (Fig. S1). K2P distances among mitochondrial lineages ranged from 0.8% between L3 and L3b to 10.7% between L2 and L6 within the O. longicauda complex, whereas it ranged from 8.7% between L2 and O. phoenia to 11.8% be-tween L6 and O. phoenia when considering the three outgroup species (Table S3).
3.2. Multivariate analyses identify six genetic clusters
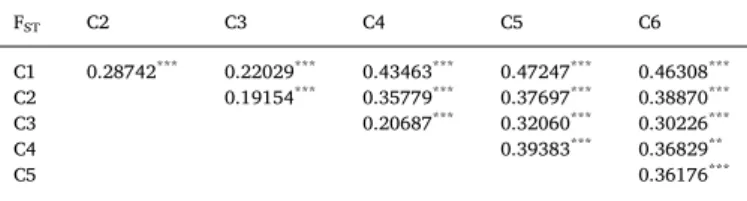
The DAPC showed unambiguously that the optimal number of clusters (i.e. the minimal BIC value) was six (Fig. S2A). The six clusters were very distinct with nearly no overlapping in the 2D representation (Fig. 3A) and 100% probability of memberships for each individual (Fig. S2B). The cluster C1, including all individuals of mitochondrial lineage L6 (from Dakar and a single individual from Madeira) forms a well-defined group distant from the five other groups (Fig. 3A,Table 1). The cluster C2 includes all L5 individuals from Dakar, whereas the widely distributed broadcast-spawning cluster C3 encompasses all L1 and L5 individuals from Canary Island to Lebanon (Fig. 1,Table 1). The cluster C4 includes all L3b Tunisian individuals (Fig. 1). Finally, the brooding individuals are distributed in two different genetic clusters, incongruent with mitochondrial lineages but congruent with geo-graphy. Cluster C5 includes all L2 and L3 individuals sampled in Greece, whereas cluster C6 includes all L2 and L4 individuals sampled in Cyprus and Lebanon (Table 1). The DAPC run without the mi-tochondrial COI marker provided the same clustering, showing that this marker did not bias the clustering process (Fig. S3). The PCA gave es-sentially the same results as the DAPC, except that the higher genetic diversity of the broadcast spawners was more visible (Fig. 3B and C). In addition, C4 was even closer to C3 and C5, highlighting the capacity of PCA to explore the natural distribution of individuals and its power to detect potential hybridization events. Furthermore, one individual from Madeira assigned to the cluster C1 was not clustering with the other C1 individuals from Dakar, but was rather at mid distance between the C1 and C3 individuals, suggesting the presence of a potential hybrid be-tween C1 and C3. Yet, further sampling would be required to properly assess this hypothesis. Therefore, we excluded this individual from further analyses. Pairwise FSTamong clusters were high, ranging from
0.19 between C2 and C3 to 0.47 between C1 and C5 (Table 3). In ad-dition, all FSTvalues were significant after a permutation test (Table 3).
There was no pattern of isolation by distance between C2 and C3 or within C3 (Mantel test p-value = 0.68) (Fig. 4). Rather, C3 displayed no genetic structure (FSTclose to 0) over large geographic distances (close
to 4000 km). In addition, C2–C3 FSTremained close to 0.2 for distant
(about 2500 km) and very distant (> 6000 km) comparisons. This shows that although C3 displays high dispersal abilities, it does not appear to exchange genes with C2, supporting that C2 and C3 are se-parated species. Contrastingly, there was a tendency for isolation by distance between the brooding clusters C5 and C6 (Mantel test p-value = 0.15) (Fig. 4). This suggests that C5 and C6 may form a single very structured species. Nevertheless, as genetic diversity was higher in C6 (Fig. S4), it is possible that C5 and C6 are separated species.
3.3. The multispecies coalescent provides divergence time estimates
BPP was used to jointly perform species (or lineage) delimitation and species tree estimation using the six genetic clusters and the three outgroup species. In the three replicate analyses, the six Ophioderma genetic clusters C1–C6 and the three outgroups species (O. teres, O. cinerea and O. phoenia) were fully supported (posterior probability of
Fig. 3. (A) Results of the Discriminant Analysis of Principal Components (DAPC). Axes 1 and 2 are plotted. Fstat: ratio of between-group and within-group variances. The six different genetic clusters are displayed. (B) Results of the Principal Components Analysis (PCA). Axes 1 and 2 are plotted. POV: proportion of variance. Individuals are colored according to their genetic cluster found in DAPC. (C) Results of the Principal Components Analysis (PCA). Axes 2 and 3 are plotted. POV: proportion of variance. Individuals are colored according to their genetic cluster found in DAPC. (For interpretation of the references to colour in thisfigure legend, the reader is referred to the web version of this article.)
nine species = 1; Table S4). Furthermore, the species tree of the O. longicauda species complex was also highly supported (C1 most ances-tral, C5 & C6 more recently diverged (Fig. S5); posterior prob-ability = 0.92–0.99), although the full topologies were different due to different placements of the three outgroups (Table S4). Using the di-vergence time of the geminate species O. teres and O. cinerea / O. phoenia (at least 2.8 mya; (Lessios, 2008)), the divergence times within the Ophioderma longicauda species complex were inferred to be at least 537,000 years ago [95% CI: 445,223–682,795] (Table 4;Fig. S5).
It is noteworthy that the BPP analyses run on a sub-dataset of nine C3 individuals and eleven C5 individuals considering each individual as a candidate species in the starting tree gave unsupported results, with unstable numbers of estimated species and low posterior probabilities among replicate analyses (6, 3 and 2 species;Table S5). Therefore, BPP performed poorly to delimit species without a meaningful starting species tree. On the opposite, the DAPC succeeded infinding the true number of species and affecting individuals to them (Fig. S6). 3.4. A divergence scenario supports past hybridization
After pre-evaluation of the priors for the eight scenarios (Fig. S7A), posterior probabilities of scenarios tested with ABC indicated that the most probable scenario was scenario 5, which included hybridization between C3 and C5 (PP = 0.67; Table S6). The second most likely scenario was scenario 7, also including a hybridization event between C3 and C5 (PP = 0.26; Table S6). The remaining scenarios were not supported. After model checking of scenario 5 (Fig. S7B), parameter estimates indicated that the widespread broadcast spawning cluster C3 displayed the largest effective population size, 3 to 10 times larger than the effective population sizes of the brooding species C4, C5 and C6 (Table 5;Fig. S8). The divergence time estimates indicated that C1 split from other O. longicauda clusters about 512,000 generations ago and that the broadcasters and the brooders split about 222,000 generations ago (Table 5). The hybridization event giving rise to C4 was estimated
about 90,000 generations ago, with a high proportion of C4 genome originating from C3 (about 86.8%;Table 5). Overall, the divergence events of the O. longicauda species complex follow a pattern of West to East differentiation (Fig. 1).
4. Discussion
4.1. Species limits and divergence history deciphered in the O. longicauda species complex
In this study, six Ophioderma species (C1–C6) were unambiguously delimited, one of them (C4) most likely originating from the hy-bridization of C3 and C5. So far, only two Ophioderma species have been described in the Eastern Atlantic; Ophioderma longicauda (Bruzelius, 1805), from Dakar to Spain in the Atlantic and in the Mediterranean, and Ophioderma wahlbergii Müller & Troschel, 1842 in South Africa, even though it was recently shown that the Mediterranean sympatric C3 & C5 and C3 & C6 are different biological species (Weber et al., 2015, 2014). The emergence of the Ophioderma genus occurred most likely around the Caribbean Sea, before the closing of the Panama Isthmus. Indeed, most currently recognized extant species (26/28) of this genus thrive in this region (Stöhr et al., 2009) and the oldest confirmed
Ophioderma fossil (about 10 million years old, Tortonian, early Late Miocene), is from South America (Martínez and Río, 2008). The most divergent species C1 occurring in West Africa split from the common ancestor of C2–C6 at least half a million years ago. Nevertheless, it is possible that the actual divergence time of the species complex is much older as partial closure events of the Panama Isthmus occurred before its final closure around 2.8 mya (e.g. sea catfishes, about 10 mya (Stange et al., 2018)). For the divergence times within O. longicauda species complex (C2–C6), we rather refer to the DIYABC estimates, as the divergence model is more accurate.
The fact that C1 and C2 were sampled in very close localities (11–17 km apart), but were yet genetically distinct, is further evidence that C1 and C2 are different biological species. Interestingly, Greef (1882)described a new species, Ophioderma guineense Greef, 1882, from West Africa (Gulf of Guinea), which was later considered conspecific with O. longicauda, as its distinguishing morphological characters were assumed to fall within the variability of O. longicauda (Madsen, 1970). It is possible that this O. longicauda“variety” is actually the biological species we define here as C1. Yet, fresh samples from this locality are required to test this hypothesis.
Two other broadcast spawners were found, C2 in Senegal and the widespread C3 (from Canary Islands to Lebanon). These clusters most likely represent two biological species, as they do not appear to ex-change genes even though C3 displays high dispersal abilities. Two
Table 3
FSTvalues (W&C) among the six genetic clusters based on 30 genetic markers.
Significant FSTvalues after a permutation test (1000 permutations) are
high-lighted in bold.**: 0.001 < P-value < 0.01;***: P-value < 0.001.
FST C2 C3 C4 C5 C6 C1 0.28742*** 0.22029*** 0.43463*** 0.47247*** 0.46308*** C2 0.19154*** 0.35779*** 0.37697*** 0.38870*** C3 0.20687*** 0.32060*** 0.30226*** C4 0.39383*** 0.36829** C5 0.36176***
Fig. 4. Isolation-by-distance patterns for the broadcast spawning clusters (C2 & C3), and the brooding clusters (C5 & C6). Analyses were performed separately but are plotted on the same graph to highlight differences in dispersal abilities between broadcast spawning and brooding clusters.
clusters corresponded to brooders (C5 in Greece and C6 in Cyprus and Lebanon). As a tendency for isolation by distance was found, it is possible that C5 and C6 form a single highly structured species. The cluster C4, occurring in Tunisia, is most likely also a brooder, as it displays typical characteristics of brooders (e.g. mitochondrial lineage close to the brooding C5; small effective population size; ecological preference to low depth (Weber et al., 2014)). Gonad examinations of C4 specimens were unsuccessful to determine their reproductive strategy as sampling was performed outside the reproductive season. Yet, it is known that brooders occur in this region as brooding speci-mens were previously sampled in Tunisia in 1849 and 1924 (Stöhr et al., 2009). Unfortunately, molecular characterization of these ancient samples failed due to poor DNA quality. Interestingly, the most likely origin of the cluster C4 is hybridization between C3 and C5, confirming our initial hypothesis. A formal taxonomic revision of Ophioderma longicauda is in progress (Stöhr et al., in preparation). The ancestral strategy of the Ophioderma genus is broadcast spawning, as all Ophio-derma from the Western Atlantic and O. longicauda C3 are broadcast spawners. Brooding evolved most likely about 222,000 generations ago
in the common ancestor of C5 and C6. Unfortunately, generation time in O. longicauda is unknown, although it is known that after they reach sexual maturity, they reproduce once a year (broadcast spawner C3 (Fenaux, 1972); brooders C5 and C6 (Stöhr et al., 2009; Weber et al., 2014)). Interestingly, another independent evolution of brooding oc-curred in O. wahlbergii, which displays much larger and fewer young in its bursae than O. longicauda C5 and C6 (Landschoff and Griffiths, 2015).
4.2. Discrepancy between mitochondrial and nuclear histories cautions the sole use of mitochondrial data for species delimitation
Mitochondrial barcodes, such as COI, have been widely used in species delimitation and species complex discovery (e.g.Hebert et al., 2003) given the ubiquity of mitochondrial DNA, its ease of ampli fica-tion and high mutafica-tion rate. Also, its reduced effective size compared to nuclear DNA allows rapid lineage sorting in recently diverged popula-tions, culminating in reciprocal monophyly. In fact, it allowed in the first place the discovery of the O. longicauda species complex (Boissin et al., 2011; Stöhr et al., 2009), and it is still efficient to discover
ad-ditional cryptic species, including brittle stars (Boissin et al., 2017). Nevertheless, mitochondrial lineages did not correspond to species (i.e. genetic clusters) in many cases. For instance, the cluster C3 en-compasses individuals displaying the lineages L1 and L5 (4.4% diver-gence). The same applied for the cluster C5 (lineages L2 and L3, 1.1% divergence) and the cluster C6 (lineages L2 and L4, 2.5% divergence). This is most likely the result of ancient introgression events. In contrast to nuclear DNA, mitochondrial DNA is particularly prone to both se-lective and introgression sweeps (Currat et al., 2008; Galtier et al., 2009; Pons et al., 2014; Toews and Brelsford, 2012; seeBronstein et al., 2016for an example in sea urchins). Finally, selection events may be responsible for the retention of particular mitochondrial haplotypes (Ballard and Whitlock, 2004; Cheviron & Brumfield, 2009). This study emphasizes the necessity of using nuclear markers to accurately delimit species.
Table 4
Posterior probabilities of parameters estimated with BPP. Theta = 4 * Ne * µ. Tau = expected number of mutations per site. Minimum divergence times in years are calculated from the minimum divergence time of the geminate species pairs O. teres and O. phoenia/O. cinerea (2.8 mya,Lessios, 2008). Results for replicate 2 are displayed. SeeFig. S5for the full species tree and the positioning of branch lengths (Tau).
Replicate 2 Mean Median Mode 2.5% CI 97.5% CI Mode [years] 2.5% CI [years] 97.5% CI [years]
Theta_C1 0.005196151 0.005109 0.004971 0.003570775 0.007423225 Theta_C2 0.007639499 0.007532 0.006841 0.005636 0.01023622 Theta_C3 0.01682958 0.016739 0.014894 0.012518 0.02186435 Theta_C4 0.002738336 0.002679 0.002408 0.0018 0.004092 Theta_C5 0.001103252 0.001069 0.001277 0.000639775 0.001702 Theta_C6 0.002360826 0.002304 0.002319 0.001494775 0.003635225 Theta_Oteres 0.004313273 0.004187 0.004004 0.002433 0.006873225 Theta_Ophoen 0.00736498 0.007178 0.006682 0.0046 0.01109122 Theta_Ociner 0.01173528 0.011572 0.011885 0.008069 0.016437 Tau_C1.C6 0.01596195 0.015895 0.014907 0.013522 0.018639 8,920,624 8,091,814 11,153,922 Tau_C2.C6 8.09527E-05 0.000054 0.00001 0.00001 0.000343 5984 5984 205,258 Tau_C3_C4_C5_C6 0.000131744 0.000113 0.000072 0.000024 0.000325 43,086 14,362 194,486 Tau_C4_C5_C6 0.000151832 0.000146 0.000156 0.000037 0.0003 93,353 22,141 179,526 Tau_C5_C6 0.000152483 0.000142 0.000155 0.00003 0.000341 92,755 17,953 204,061 Tau_C1 0.000899098 0.000883 0.000898 0.000744 0.001141 537,380 445,223 682,795 Tau_C2 0.000818136 0.000811 0.000804 0.000675 0.000998 481,128 403,932 597,222 Tau_C3 0.000686385 0.000688 0.000721 0.000533 0.000831 431,460 318,957 497,286 Tau_C4 0.000534565 0.000535 0.000553 0.000399 0.000685 330,925 238,769 409,917 Tau_C5 0.000382091 0.00038 0.00035 0.000247 0.000516 209,446 147,809 308,784 Tau_C6 0.000382091 0.00038 0.00035 0.000247 0.000516 209,446 147,809 308,784 tau_Oteres 0.004415418 0.004374 0.004679 0.002896 0.006119 2,800,000 1,733,020 3,661,723 Tau_Ophoen 0.004148281 0.004135 0.003983 0.00274 0.005535 2,383,501 1,639,667 3,312,246 Tau_Ociner 0.004148281 0.004135 0.003983 0.00274 0.005535 2,383,501 1,639,667 3,312,246 Tau_Ophoen_Ociner 0.000267135 0.000153 0.000003 0.000005 0.001263225 1795 2992 755,937 Tau_Ot_Op_Oc 0.01244562 0.0124385 0.012251 0.0093731 0.01559 7,331,225 5,609,036 9,329,344 Table 5
Posterior probability values of estimated parameters for scenario 5 by ABC. N = effective population size; t = divergence times in number of generations, see details inFig. 3. r2 = admixture rate of C3 to C5. q025 and q975 indicate the range of 95% confidence interval.
Genetic cluster Parameter mode 2.5% CI 97.5% CI
C1 N1 57,000 21,000 219,000 C2 N2 142,000 53,900 301,000 C3 N3 293,000 226,000 646,000 C4 N4 31,700 9,460 117,000 C5 N5 30,000 9,190 73,500 C6 N6 133,000 61,600 192,000 r2 0.868 0.469 0.967 t1 38,700 12,900 69,100 t2 89,100 46,000 116,000 t3 222,000 119,000 319,000 t4 368,000 230,000 475,000 t5 512,000 331,000 928,000
4.3. DAPC, BPP and ABC: A potential new combination of methods for species delimitation
Here we used three methods to delimit species in the Ophioderma longicauda species complex using 30 genetic markers, of which 25 were transcriptome-based. This is a high number of sequence markers, given that from the 28 studies presented in a review on species delimitation, only two used more than 10 genetic markers (Carstens et al., 2013). The first step was performed using DAPC clustering, based on multi-locus genotypes (i.e. the sequence information was not used, only the allele frequencies;Table 2) and revealed the presence of six distinct genetic clusters. We showed that this type of clustering approach is powerful in presence of strong incomplete lineage sorting, since diagnostic di ffer-ences are not needed in order tofind genetic clusters, only frequency differences. Therefore, clustering approaches are appropriate for re-cently diverged species. Then, we verified that these six clusters were confirmed under the MSC framework using BPP that, in addition to providing a tree and estimating the most likely number of lineages, allows the estimation of parameters such as effective population sizes and divergence times. It is noteworthy that the use of BPP alone failed to delimit species on a subset of data. Although BPP has been recently criticized to delimit genetic structure rather than species (Sukumaran and Knowles, 2017), which was not ignored by BPP’s authors (Rannala 2015), we believe that species delimitation based on genetic data is accurate in the Ophioderma case. Indeed, many genetic clusters are sympatric but do not exchange genes (C1–C2; C3–C4; C3–C5; C3–C6), or are genetically isolated despite being within the range of their dis-persal abilities (C2 and C3), confirming that they are actual biological species. In addition, different morphological characters were found among C1, C3 and C5 after reanalysis of several specimens (Stöhr et al., in preparation).
Finally, we propose to go one step further than discovering and delimiting species by inferring a more realistic divergence history, in-cluding hybridization, with model testing using ABC. Such methods allow the comparison of complex models including hybridization, re-ticulate evolution and demographic events (Roux et al., 2013). We found that the most supported scenario included a hybridization event between the broadcast spawners C3 and the brooders C5. Some addi-tional past hybridization events may also have occurred between the divergent C1 and the broadcast spawner C3. Indeed, an individual sampled in Madeira displayed many common alleles with C1 (among which the mitochondrial haplotype L6), but also many common alleles with C3. Yet, due to the presence of a single potential C1-C3 hybrid, we were not able to test this hypothesis. Nevertheless, this suggests that hybridization and introgression might have been common in Ophio-derma species.
A previous study (Camargo et al., 2012) tested the accuracy of BPP (Yang and Rannala, 2010), spedeSTEM (Ence and Carstens, 2011) and ABC methods (Csilléry et al., 2012) for species delimitation. Based on simulations, the authors found that BPP was overall the most accurate, ABC displaying an intermediate accuracy and spedeSTEM the lowest accuracy. All methods displayed lower accuracy when geneflow was incorporated, yet ABC displayed the lowest decrease in accuracy to delimit species. Rather thanfinding the overall best species delimitation method, we propose to use several consecutive methods tofirst find the number of distinct genetic entities, and then to estimate the divergence scenarios, therefore taking advantage of the best qualities of each method.
Albeit successful, our pipeline based on exonic amplified markers relies on pre-existing genomic resources to develop genetic markers, and a relatively small number of markers has been used, contrary to other methods such as RAD-sequencing and associated techniques that sample a more representative portion of the genome (usually thousands of loci) (Davey et al., 2011). RAD-sequencing has been successfully used to delimit species (e.g. Pante et al., 2015), yet the efficiency of this
method diminished drastically with genetic distance of compared
species. Indeed,Pante et al. (2015)report that > 70% of loci were lost when species displaying 0.028% of mitochondrial divergence were compared (1–2 myr divergence time) and 97% of loci were lost for species displaying 2.2% of mitochondrial divergence (9–16 myr diver-gence). This is expected given that the majority of RAD loci are found in non-coding DNA, which accumulates mutations faster than coding DNA. Here, we could successfully retrieve 84–100% of markers for C1–C6 (10.7% maximum mitochondrial divergence (Table S3); diver-gence at least 537,000 years ago (Table 4)) and 54% of the markers for the outgroup species (11.8% maximum mitochondrial divergence (Table S3); divergence at least 7.3 million years ago (Table 4)), high-lighting that our exon-based method performs better than RAD se-quencing for distantly related species, but also allows comparing closely related species. In addition, due to their longer sequences compared to RAD loci, our method allows the analysis of haplotype networks (Fig. S1). Therefore, coding sequence markers are useful to compare si-multaneously closely and distantly related species.
4.4. To circumvent the use of individual PCR amplification, and to sample a larger and most likely a more representative portion of the genome, one could use our analytic framework with exon-capture data, a method shown efficient to capture exons displaying up to 12% of sequence divergence (Hancock-Hanser et al., 2013; seeHugall et al., 2015for exon-capture specific to brittle stars). Until now, these data have mainly been used for phylogenomic purposes (O’Hara et al., 2017,
2014) but they could as well be used for cryptic species delimitation with multilocus genotype approaches, which are powerful to detect recent genetic isolation Although 30 markers allowed us to use com-putationally intensive methods such as BPP and ABC, a very small part of the genome was examined. Therefore, a next step would be to test the validity of our results using a phylogenomic dataset and multilocus genotype approaches, but as well inferring a species tree in a multi-species coalescent framework (e.g. ASTRAL (Mirarab et al., 2014), MP-EST (Liu et al., 2010) or SVDquartets (Chifman and Kubatko, 2014)) or in a reticulated evolution framework taking incomplete lineage sorting and hybridization into account (e.g. InferNetwork from the PhyloNet software package (Than et al., 2008); see also the recent review (Elworth et al. 2018)).
5. Conclusion
To conclude, the use of three distinct methods with coding sequence markers allowed comparisons at the within- and between-species levels, and bridging the gap between them. We emphasize the power of mul-tilocus genotypes to delimit recently diverged species displaying in-complete lineage sorting and the ability of ABC to uncover the most realistic divergence history of a species complex. We propose that these approaches can be helpful to resolve other complex speciation histories.
Data statement
The raw Miseq reads were deposited on Dryad Digital Repository and are accessible onhttps://doi.org/10.5061/dryad.5ks03(The raw data of the present study are from the same Miseq run as for the study:
Weber et al., 2015).
Acknowledgments
We are very grateful to the many people who contributed to sam-pling of Ophioderma longicauda specimens: Helmut Zibrowius, Christos Arvanitidis, Thanos Dailianis, Elena Sarropoulou, Magdalini Christodoulou, Zined Marzouk, Didier Weber, Thi Weber and Philipp Moser. Many thanks to Francisco Alonso Solis-Marin and Harilaos Lessios for providing Ophioderma outgroup samples. We also would like to thank Laurent Abi-Rached for his advice on phylogenetic analyses, Arnaud Estoup for his advice on DIYABC and the genomic sequencing platform Genotoul (INRA, Toulouse) for the Illumina sequencing. We
thank the support team of sciCORE (center for scientific computing, University of Basel, http://scicore.unibas.ch/) for providing access to computational resources, especially Pablo Escobar Lopez. Finally, we would like to thank two anonymous reviewers for their comments on a previous version of the manuscript.
Funding
A.A-T.W was supported by a scholarship from the French Ministry of High Education, Research and Innovation. S. S. and A. C. did not receive any specific funding for this study.
Appendix A. Supplementary material
Supplementary data to this article can be found online athttps:// doi.org/10.1016/j.ympev.2018.11.014.
References
Abbott, R., Albach, D., Ansell, S., Arntzen, J.W., Baird, S.J.E., Bierne, N., Boughman, J., Brelsford, A., Buerkle, C.A., Buggs, R., Butlin, R.K., Dieckmann, U., Eroukhmanoff, F., Grill, A., Cahan, S.H., Hermansen, J.S., Hewitt, G., Hudson, A.G., Jiggins, C., Jones, J., Keller, B., Marczewski, T., Mallet, J., Martinez-Rodriguez, P., Möst, M., Mullen, S., Nichols, R., Nolte, A.W., Parisod, C., Pfennig, K., Rice, A.M., Ritchie, M.G., Seifert, B., Smadja, C.M., Stelkens, R., Szymura, J.M., Väinölä, R., Wolf, J.B.W., Zinner, D., 2013. Hybridization and speciation. J. Evol. Biol. 26, 229–246.https://doi.org/10.1111/j. 1420-9101.2012.02599.x.
Abbott, R.J., Barton, N.H., Good, J.M., 2016. Genomics of hybridization and its evolu-tionary consequences. Mol. Ecol. 25, 2325–2332.https://doi.org/10.1111/mec. 13685.
Agapow, P., Bininda-Emonds, O.R.P., Crandall, K.A., Gittleman, J.L., Mace, G.M., Marshall, J.C., Purvis, A., 2004. The impact of species concept on biodiversity studies. Q. Rev. Biol. 79, 161–179.https://doi.org/10.1086/383542.
Ballard, J.W.O., Whitlock, M.C., 2004. The incomplete natural history of mitochondria. Mol. Ecol. 13, 729–744.https://doi.org/10.1046/j.1365-294X.2003.02063.x. Bandelt, H.J., Forster, P., Röhl, A., 1999. Median-joining networks for inferring
in-traspecific phylogenies. Mol. Biol. Evol. 16, 37–48.https://doi.org/10.1093/ oxfordjournals.molbev.a026036.
Barboza, C.A., de, M., Mattos, G., Paiva, P.C., 2015. Brittle stars from the Saint Peter and Saint Paul Archipelago: morphological and molecular data. Mar. Biodivers. Rec. 8, e16.https://doi.org/10.1017/S1755267214001511.
Baric, S., Sturmbauer, C., 1999. Ecological parallelism and cryptic species in the genus Ophiothrix derived from mitochondrial DNA sequences. Mol. Phylogenet. Evol. 11, 157–162.https://doi.org/10.1006/mpev.1998.0551.
Belkhir, K., Borsa, P., Chikhi, L., Raufaste, N., Bonhomme, F., 2004. GENETIX 4.05, Population genetics software for Windows TM. Univ. Montp. II Montp.
Bickford, D., Lohman, D.J., Sodhi, N.S., Ng, P.K.L., Meier, R., Winker, K., Ingram, K.K., Das, I., 2007. Cryptic species as a window on diversity and conservation. Trends Ecol. Evol. 22, 148–155.https://doi.org/10.1016/j.tree.2006.11.004.
Boissin, E., Féral, J.P., Chenuil, A., 2008. Defining reproductively isolated units in a cryptic and syntopic species complex using mitochondrial and nuclear markers: the brooding brittle star, Amphipholis squamata (Ophiuroidea). Mol. Ecol. 17, 1732–1744.
https://doi.org/10.1111/j.1365-294X.2007.03652.x.
Boissin, E., Hoareau, T.B., Paulay, G., Bruggemann, J.H., 2017. DNA barcoding of reef brittle stars (Ophiuroidea, Echinodermata) from the southwestern Indian Ocean evolutionary hot spot of biodiversity. Ecol. Evol.https://doi.org/10.1002/ece3.3554. Boissin, E., Stöhr, S., Chenuil, A., 2011. Did vicariance and adaptation drive cryptic
speciation and evolution of brooding in Ophioderma longicauda (Echinodermata: Ophiuroidea), a common Atlanto-Mediterranean ophiuroid? Mol. Ecol. 20, 4737–4755.https://doi.org/10.1111/j.1365-294X.2011.05309.x.
Bronstein, O., Kroh, A., Haring, E., 2016. Do genes lie? Mitochondrial capture masks the Red Sea collector urchin’s true identity (Echinodermata: Echinoidea: Tripneustes). Mol. Phylogenet. Evol. 104, 1–13.https://doi.org/10.1016/j.ympev.2016.07.028. Bucklin, A., Steinke, D., Blanco-Bercial, L., 2011. DNA barcoding of marine metazoa. Ann.
Rev. Mar. Sci. 3, 471–508. https://doi.org/10.1146/annurev-marine-120308-080950.
Camargo, A., Morando, M., Avila, L.J., Sites, J.W., 2012. Species delimitation with Abc and other coalescent-based methods: a test of accuracy with simulations and an empirical example with lizards of the Liolaemus Darwinii Complex (squamata: Liolaemidae). Evolution 66, 2834–2849.https://doi.org/10.1111/j.1558-5646.2012. 01640.x.
Carstens, B.C., Knowles, L.L., Collins, T., 2007. Estimating species phylogeny from gene-tree probabilities despite incomplete lineage sorting: an example from melanoplus grasshoppers. Syst. Biol. 56, 400–411.https://doi.org/10.1080/
10635150701405560.
Carstens, B.C., Pelletier, T.A., Reid, N.M., Satler, J.D., 2013. How to fail at species deli-mitation. Mol. Ecol. 22, 4369–4383.https://doi.org/10.1111/mec.12413. Chenuil, A., Hoareau, T.B., Egea, E., Penant, G., Rocher, C., Aurelle, D., Mokhtar-Jamai,
K., Bishop, J.D., Boissin, E., Diaz, A., Krakau, M., Luttikhuizen, P.C., Patti, F.P., Blavet, N., Mousset, S., 2010. An efficient method to find potentially universal
population genetic markers, applied to metazoans. BMC Evol. Biol. 10, 276.https:// doi.org/10.1186/1471-2148-10-276.
Cheviron, Z.A., Brumfield, R.T., 2009. Migration-selection balance and local adaptation of mitochondrial haplotypes in rufous-collared sparrows (Zonotrichia capensis) along an elevational gradient. Evolution 63, 1593–1605. https://doi.org/10.1111/j.1558-5646.2009.00644.x.
Chifman, J., Kubatko, L., 2014. Quartet inference from SNP data under the coalescent model. Bioinformatics 30, 3317–3324.https://doi.org/10.1093/bioinformatics/ btu530.
Cornuet, J.-M., Pudlo, P., Veyssier, J., Dehne-Garcia, A., Gautier, M., Leblois, R., Marin, J.-M., Estoup, A., 2014. DIYABC v2.0: a software to make approximate Bayesian computation inferences about population history using single nucleotide poly-morphism, DNA sequence and microsatellite data. Bioinformatics 30, 1187–1189.
https://doi.org/10.1093/bioinformatics/btt763.
Csilléry, K., Blum, M.G.B., Gaggiotti, O.E., François, O., 2010. Approximate Bayesian Computation (ABC) in practice. Trends Ecol. Evol. 25, 410–418.https://doi.org/10. 1016/j.tree.2010.04.001.
Csilléry, K., François, O., Blum, M.G.B., 2012. abc: an R package for approximate Bayesian computation (ABC). Methods Ecol. Evol. 3, 475–479.https://doi.org/10. 1111/j.2041-210X.2011.00179.x.
Currat, M., Ruedi, M., Petit, R.J., Excoffier, L., 2008. The hidden side of invasions: massive introgression by local genes. Evolution 62, 1908–1920.https://doi.org/10. 1111/j.1558-5646.2008.00413.x.
Davey, J.W., Hohenlohe, P.A., Etter, P.D., Boone, J.Q., Catchen, J.M., Blaxter, M.L., 2011. Genome-wide genetic marker discovery and genotyping using next-generation se-quencing. Nat. Rev. Genet. 12, 499–510.https://doi.org/10.1038/nrg3012.
De Queiroz, K., 2007. Species concepts and species delimitation. Syst. Biol. 56, 879–886. Elworth, R. L., Ogilvie, H. A., Zhu, J., Nakhleh, L., 2018. Advances in Computational
Methods for Phylogenetic Networks in the Presence of Hybridization. arXiv preprint arXiv:1808.08662.https://arxiv.org/abs/1808.08662.
Ence, D.D., Carstens, B.C., 2011. SpedeSTEM: a rapid and accurate method for species delimitation. Mol. Ecol. Resour. 11, 473–480.https://doi.org/10.1111/j.1755-0998. 2010.02947.x.
Falush, D., Stephens, M., Pritchard, J.K., 2003. Inference of population structure using multilocus genotype data: linked loci and correlated allele frequencies. Genetics 164, 1567–1587.
Fenaux, L., 1972. Evolution saisonnière des gonades chez l’Ophiure Ophioderma long-icauda (Retzius), Ophiuroidea. Int. Rev. Gesamten Hydrobiol. Hydrogr. 57, 257–262.
https://doi.org/10.1002/iroh.19720570205.
Fujita, M.K., Leaché, A.D., Burbrink, F.T., McGuire, J.A., Moritz, C., 2012. Coalescent-based species delimitation in an integrative taxonomy. Trends Ecol. Evol. 27, 480–488.https://doi.org/10.1016/j.tree.2012.04.012.
Galtier, N., Nabholz, B., Glémin, S., Hurst, G.D.D., 2009. Mitochondrial DNA as a marker of molecular diversity: a reappraisal. Mol. Ecol. 18, 4541–4550.https://doi.org/10. 1111/j.1365-294X.2009.04380.x.
Gérard, K., Guilloton, E., Arnaud-Haond, S., Aurelle, D., Bastrop, R., Chevaldonné, P., Derycke, S., Hanel, R., Lapègue, S., Lejeusne, C., Mousset, S., Ramšak, A., Remerie, T., Viard, F., Féral, J.-P., Chenuil, A., 2013. PCR survey of 50 introns in animals: cross-amplification of homologous EPIC loci in eight non-bilaterian, protostome and deu-terostome phyla. Mar. Genomics 12, 1–8.https://doi.org/10.1016/j.margen.2013. 10.001.
Greeff, R., 1882. Echinodermen beobachtet auf einer Reise nach der Guinea-Insel Sao-Thomé. Zool. Anz. 107, 156–159.
Hancock-Hanser, B.L., Frey, A., Leslie, M.S., Dutton, P.H., Archer, F.I., Morin, P.A., 2013. Targeted multiplex next-generation sequencing: advances in techniques of mi-tochondrial and nuclear DNA sequencing for population genomics. Mol. Ecol. Resour. 13, 254–268.https://doi.org/10.1111/1755-0998.12059.
Hebert, P.D.N., Ratnasingham, S., de Waard, J.R., 2003. Barcoding animal life: cyto-chrome c oxidase subunit 1 divergences among closely related species. Proc. R. Soc. Lond. B Biol. Sci. 270, S96–S99.https://doi.org/10.1098/rsbl.2003.0025. Hebert, P.D.N., Penton, E.H., Burns, J.M., Janzen, D.H., Hallwachs, W., 2004. Ten species
in one: DNA barcoding reveals cryptic species in the neotropical skipper butterfly Astraptes fulgerator. Proc. Natl. Acad. Sci. USA 101, 14812–14817.https://doi.org/ 10.1073/pnas.0406166101.
Heimeier, D., Lavery, S., Sewell, M.A., 2010. Molecular species identification of Astrotoma agassizii from planktonic embryos: further evidence for a cryptic species complex. J. Hered. 101, 775–779.https://doi.org/10.1093/jhered/esq074.
Hoareau, T.B., Boissin, E., Paulay, G., Bruggemann, J.H., 2013. The Southwestern Indian Ocean as a potential marine evolutionary hotspot: perspectives from comparative phylogeography of reef brittle-stars. J. Biogeogr. 40, 2167–2179.https://doi.org/10. 1111/jbi.12155.
Huelsenbeck, J.P., Andolfatto, P., Huelsenbeck, E.T., 2011. Structurama: Bayesian in-ference of population structure. Evol. Bioinforma. Online 7, 55–59.https://doi.org/ 10.4137/EBO.S6761.
Hugall, A.F., O’Hara, T.D., Hunjan, S., Nilsen, R., Moussalli, A., 2015. An exon-capture system for the entire class Ophiuroidea. Mol. Biol. Evol. 33, 281–294.
Hunter, R.L., Halanych, K.M., 2008. Evaluating connectivity in the brooding brittle star Astrotoma agassizii across the Drake passage in the Southern Ocean. J. Hered. 99, 137–148.https://doi.org/10.1093/jhered/esm119.
Jombart, T., Devillard, S., Balloux, F., 2010. Discriminant analysis of principal compo-nents: a new method for the analysis of genetically structured populations. BMC Genet. 11, 94.https://doi.org/10.1186/1471-2156-11-94.
Kimura, M., 1980. A simple method for estimating evolutionary rates of base substitutions through comparative studies of nucleotide sequences. J. Mol. Evol. 16, 111–120.
https://doi.org/10.1007/BF01731581.