Publisher’s version / Version de l'éditeur:
Materiaux et constructions. Materials and Structures, 13, 73, pp. 3-9, 1980-01
READ THESE TERMS AND CONDITIONS CAREFULLY BEFORE USING THIS WEBSITE. https://nrc-publications.canada.ca/eng/copyright
Vous avez des questions? Nous pouvons vous aider. Pour communiquer directement avec un auteur, consultez la première page de la revue dans laquelle son article a été publié afin de trouver ses coordonnées. Si vous n’arrivez pas à les repérer, communiquez avec nous à [email protected].
Questions? Contact the NRC Publications Archive team at
[email protected]. If you wish to email the authors directly, please see the first page of the publication for their contact information.
NRC Publications Archive
Archives des publications du CNRC
This publication could be one of several versions: author’s original, accepted manuscript or the publisher’s version. / La version de cette publication peut être l’une des suivantes : la version prépublication de l’auteur, la version acceptée du manuscrit ou la version de l’éditeur.
Access and use of this website and the material on it are subject to the Terms and Conditions set forth at
Movement of brick panel cladding
Karpati, K. K.; Sereda, P. J.
https://publications-cnrc.canada.ca/fra/droits
L’accès à ce site Web et l’utilisation de son contenu sont assujettis aux conditions présentées dans le site LISEZ CES CONDITIONS ATTENTIVEMENT AVANT D’UTILISER CE SITE WEB.
NRC Publications Record / Notice d'Archives des publications de CNRC:
https://nrc-publications.canada.ca/eng/view/object/?id=449d37b6-6a2b-47d3-a827-9e09d1a0aee3 https://publications-cnrc.canada.ca/fra/voir/objet/?id=449d37b6-6a2b-47d3-a827-9e09d1a0aee3TH1
N21d
National Research
Conseil national
$
Council Canada
de recherches Canada
no.
897
cop. 26LD-
MOVEMENT
OF BRICK PANEL CLADDING
by
K.K. Karpati andP.
J.
SeredaReprinted from
MatCriaw et Constructions
VoL 13, No. 73, ~anuary/February 1980
9
P*
DBR Paper No. 897
Division
of
Building ResearchThis publication i s being distributed by the Division of Building R e s e a r c h of the National R e s e a r c h Council of Canada. I t should not b e reproduced i n whole o r i n p a r t without p e r m i s s i o n of the original publisher. The Di- vision would be glad to b e of a s s i s t a n c e i n obtaining such p e r m i s s i o n .
Publications of the Division m a y b e obtained by m a i l - ing the a p p r o p r i a t e r e m i t t a n c e ( a Bank, E x p r e s s , o r P o s t Office Money O r d e r , o r a cheque, m a d e payable to the R e c e i v e r G e n e r a l of Canada, c r e d i t NRC) t o the National R e s e a r c h Council of Canada, Ottawa. K1A OR6. Stamps a r e not acceptable.
A l i s t of a l l p u b l i c a t i o n s of the Divisionis available and m a y be obtained f r o m the Publications Section, Division of Building R e s e a r c h , National R e s e a r c h Council of Canada. Ottawa. KIA OR6.
t
Movement
of
brick panel cladding
K. K. Karpati
( I ) ,P.
J. Sereda
( * )Movements of masonry brick panels, dete~mined from dimensional changes measured at the joints, have been measured in three directions: horizontal and vertical in the plane of the wall and perpendicular to it. They were analysed as a function of temperature change and as a function of time.
The analyses supported the hypothesis that thermal movement in the horizontal direction is altered by moisture content variations in the porous panels. Movements caused by moisture attenuated, and in some cases overrode, thermal movements. In the vertical direction the panels made one large movement in winter corresponding to the yearly temperature change and oscillated in other seasons. Movements perpendicular to the panel indicated curling of the edges.
Previous studies at DBR/NRC [I], [2] have shown windows was an advantage for it allowed a better
that joint movements correlate with surface tempera- estimate of movement than would be possible with
tures. They have involved walls with stucco exterior windows present.
finish and concrete panels where moisture effects would The building has a structural steel frame with concrete
be expected to be minimum. Because brick is more covered steel deck floors. Figure 2 gives the relevant
readily wetted by rain than is concrete or stucco and
because this may influence movements at joints, measu- -2
-
-
=7.-$-x7-.rements were carried out ofjoint movement on a building where brick masonry is used as the exterior wall.
EXPERIMENTAL
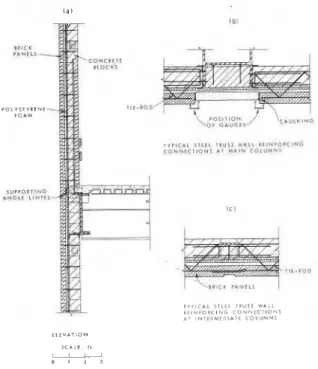
Measurements were made of movement at joints in the walls of a rectilinear building in Ottawa (Jig. 1). It is 254 by 404 ft (77 by 123 m), with the longer axis oriented north-south. Over-all height is 69 ft (21 m), with the upper portion covered by two rows of brick panels each 23 ft (7 m) high. The east elevation was chosen because this is considered to be the most severe exposure for wind-driven rain in the Ottawa area. The absence of
( I ) , (') National Research Council of Canada, Division of Building
Research, Ottawa, Canada. Fig. 1. - East elevation of building.
Vol. 13 - No 73 - Materiaux et Constructions l h ! -- F O A M I
Ef"
' , i 0 5 l . l O ~ ~ i C n ,,,,,*i 2 ry
> C I ; 0 4 L t G r l ' r : L- +-: :;:- -22.1 T Y P I C A L i T i i l TRUSS W A L L P t l N i O R C l N G C O N N i C T l O N I A T I N T E R M E D I A T E C O L U M N S L L t v n T O N S C A L E il u-1 0 1 2 1Fig. 2. - Construction details of outside wall.
construction details; figure 2 (a) shows the outside wall consisting of brick masonry panels of 8 by 3 314 by 2 114-in. (20 by 9.5 by 5.7 cm) bricks with 318-in. (1 cm) mortar joints. There is a 1-in. wide air gap behind the 3 3/4-in. (9.5 cm) panels followed by 1 in. (2.5 cm) of foam insulation attached to the inner 8 in. (20 cm) of concrete block wall. Brick panels, constructed on a lintel, are partially supported by horizontal, truss-like tie-rods spaced vertically at 16 in. (40 cm) on centre [Jig. 2 ( b ) and
(~11.
Measurements were taken between the vertical columns marked B and E in figure 3. Vertical divisions shown on the panels between columns are architectural features and the continuity of the brick masonry panel is maintained across them. The recess is illustrated in figure 2 (c).
The steel columns are faced with 4-ft (122 cm) wide precast concrete panels bolted at the top to the column through horizontal slots. A nominal joint width of 318 in. (1 cm) is maintained between the concrete panels and brick panels. Joint movement gauges bridged these joints, as indicated by the circled areas in figure 2 (b). For symmetrical restraint conditions, the movement measured at each gauge would result from the movement of half of the brick panel and half of the concrete panel.
The brick panels on either side of column B and on the right side of column E are each 34 ft (10.4 m); on the left side of column E they are 37 ft (11.3 m) wide.
Two types of gauge were used for recording joint movements: uniaxial [2] and triaxial (Jig. 4). The uniaxial gauges are smaller and consist of a hollow cylinder of stainless steel containing two pistons. The flat extension of the cylinder was attached to the brick and a reference plug with a spherical head to the concrete panel so that it pushed each piston to a position corresponding to the maximum and minimum joint width. The pistons and spherical head are visible in the oval openings of the uniaxial gauge. At arbitrarily chosenhtervals (two weeks on average) the position of each piston relative to the flat end of the cylinder was measured with a depth gauge. After the readings had been taken on the gauges the pistons were reset so that they touched the spherical head of the reference plug to start a new reading period. The uniaxial gauges were used to record movements occurring in the horizontal direction parallel to the wall surface.
The triaxial gauge recorded the same movements as did the uniaxial gauge, plus those in the vertical direction parallel to the wall and those perpendicular to the wall. Both gauges work on the same principle, but the spherical head of the triaxial gauge acts on five pistons; one pair horizontal, a second pair vertical in the plane of the wall, and the last perpendicular'to the wall. Because the concrete cladding was bolted to the steel column near the attachment point of the gauge, the movement recorded by the gauges can be considered as that between the brick panel and the column.
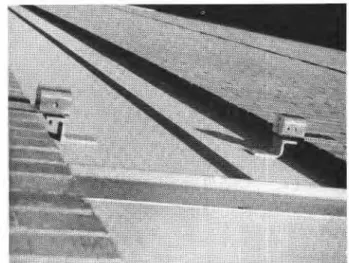
Figure 5 shows details of the triaxial gauge and figure 6 its mounting on the wall (view from the roof top). Because the cladded columns were recessed in relation to the brick panels, an offset bracket was necessary.
Four triaxial and four uniaxial gauges were located as shown in figure 7, the former at the top of the brick panels, the latter at the bottom. Maximum-minimum thermometers were attached to the wall beside the movement gauges and temperature readings were taken simultaneously with movement readings. Depth gauge readings, related to minimum joint width, were plotted against maximum temperature; those related to maxi- mum width, against minimum temperature. The data were statistically analysed. Fortran IV programs were written for an IBM 360 computer to provide the neces- sary statistical calculations and the plotting of the data on an EAI 430 Dataplotter. ,,,-. - i 7 I: ,;. TI;,;,,;,:; 8 " , ;;-, 7 (M .\ . . ..- . . I . . , . 8 I I I 1 !, I
<+.-.
I 1 . . - - I , : 8 ? - 0 I O C ' I I 1 G=l . - - E L : ) I . , , . f NU,. I 1 , lLG$@$!$!$~&~T&-
-- .%, l i h ~ j ~ ~ 7 ~ - - - - *----I. - 1 , :>u :,m -h,, .n - 0 1 1 1 4 I,,, , , m ut;: r ~ r , ,<. ,c I # .I--
GL,
<
:
,
:-YT-Fig. 4. - Joint movement gauges, ( a ) triaxial and ( b ) uniaxial.
DISCUSSION
Movement in the horizontal direction parallel to the wall
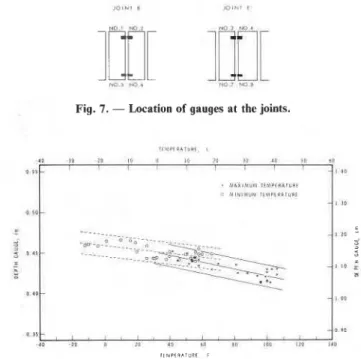
The dependence on temperature of movement at the joint was statistically analysed for each location, for a period of one year, starting in July 1970. An example of the data obtained is shown in figure 8, where joint movement readings corresponding to maximum tempe- rature are plotted as crosses and those corresponding to minimum temperature as circles. The best fitting line, with its 95 "/, confidence limits, is drawn as a continuous line for the former and as a dashed line for the latter.
As figure 8 shows, there is a difference in the slope of the lines for maximum and minimum temperature data. The slope is characteristic of the joint movement because it is the movement per degree temperature change and was investigated in detail. Higher values were obtained for the slope of data associated with maximum temperature than with minimum temperature for all locations. The results of the statistical analysis are summarized in table I, which lists the results obtained for both the tops of the panels, gauges Nos. 1 to 4, and for the bottom locations, gauges Nos. 5 to 8 (see also
Jig. 7). Where no values are given, the correlation coefficient, r , was about 0.5 or less, i. e., there was no correlation. In such cases, slope, b, was zero within the error of measurement.
Apart from the above-mentioned slope differences, there was a difference in the movements occurring at the top and bottom of the panels. Those at the bottom were considerably larger, and because of this, reading errors were less significant. In three out of four cases there was a correlation between joint movement and minimum
K. K. Karpati - P. J. Sereda
Fig. 5. - Triaxial gauge and spherical head seated on bracket.
temperature (table I). The change in joint width per degree temperature change, however, remained less for the minimum temperature data. As such differences between maximum and minimum temperature data were not found in previous investigations, it became necessary to examine joint movement as a function of time. Figure 9 (a) to (d) gives the results for the joint with gauge No. 1 at the top and gauge No. 5 at the bottom. Plots for the other joints show similar behaviour. The dotted lines are for temperature; the continuous lines give movement versus time curves. Those for tempe- rature and movement are superimposed in such a manner that they illustrate anomalies by the shaded areas. The rule followed for superposition was that the average of movement and temperature readings was calculated and the plots were shifted along the y axis until the averages coincided. Plots are for a full year,
Fig. 6. - Triaxial joint movement gauges near the top of the joint; view from roof.
Vol. 13 - NO 73 - MatCriaux et Constructions
TABLE I
I
Gauge No.1
Temperature(
Top of Joints: I 1 . . . . . .I 1 Max. Min. 2. . .-{
Max. Min. 3 . . .{
Max. Min. 4 . . .{
Max. Min.I
Bottom of Joints:I
5 . . . . Max. Min. 6 . . . . . .f Max. Min. 7. . ..1
Max. Min. 8 . . .'{
Max. Min.(*) Data available for only half a year: July 1970 to January 1971; n, number of pairs of observations; r, correlation coefficient; b, slope (in.toF); s,, standard error of slope (in.loF).
starting in July, with minimum temperature occurring around the 200th day. Simultaneously, there should be a maximum of the joint width curves. The latter were reversed around the horizontal axis of the average so that they now represent panel width changes. This facilitates illustration of trend differences between the curves that should move parallel if only temperature influenced panel dimensions.
With the maximum temperature data [Jig. 9 ( a )
and (d)], there were no major trend differences (small differences occurring at the start will be discussed later);
Fig. 7. - Location of gauges at the joints.
Fig. 8. - Horizontal joint movement parallel to wall (gauge No. 5, July 1970 to July 1971).
for the minimum temperatures, however, shaded areas occurred for both the top and bottom of the panels
[ j i g . 9 (b) and (d)]. In these areas the expected trend was a contraction of the panels, up to about the 200th day, as temperature decreased. In fact, the opposite occurred. It may be assumed that the moisture content of the brick panels caused a reversal of panel movement, although direct measurements are not available to confirm it. Increase in moisture content results in expansion of the panels and this could counterbalance the contraction associated with a drop in temperature. With readings taken at two-week intervals, on average, it is likely that the minimum and maximum temperatures occurred on different days. As rainy days tend to be cooler than sunny ones, it is also probable that the minimum temperature and corresponding panel move- ment were registered on a rainy day and the maximum temperature on a dry, sunny day. As a consequence, the influence of rainfall on panel size will appear for curves related to minimum temperatures but seldom for those of maximum temperatures. This assumes that wetted masonry dries quickly when the sun shines, and is in agreement with measurements of moisture gain and loss in exposed bricks [3].
There are also differences in moisture absorption with location on the facade, as indicated by this method of evaluation. At minimum temperatures moisture move- ment overrides temperature movement at all locations at the top of the panels and at the bottom of the joint close to the corner of the building, but this is not entirely true at the bottom of the joints close to the centre of the east elevation (Jig. 7, joint E , gauges Nos. 7 and 8). This observation is in good agreement with those on areas of buildings relatively protected from rain [4].
K. K. Karpati - P. J. Sereda
( b i M I N I M U M I I M P I R A T U R t R E A D I N G S .
G A U G E I Fig. 10. -
Vertical joint movement, gauge No. 1, 1 year.
JULY 1 9 7 0 D A Y S l l l l V l S 7 l
11, M A X I M U M I I M ? I I A I U I I l i l D I I I O C . G A U G C I
Fig. 9. - Horizontal panel movement in the plane of the wall. Fig. 11. - Movement perpendicular to wall, gauge No. 1.
Examination of panel movement versus time curves supports the information in table I, i. e., for minimum temperature readings either there is no correlation with joint movements within reading errors or, if there is, the slope (that is the movement per degree temperature change) is much lower than that for maximum tempe- ratures. The correlation with temperature is reasonably good for maximum temperature readings, but even the largest amount of movement (found at gauge No. 7), that is 0.00063 in.IoF (0.00288 cmIoC) or a total of 0.073 in. (0.185 cm) for the year, does not reach the estimated maximum possible movement. This movement can be calculated from the thermal coefficient of linear expansion of the unrestrained materials forming part of
the panel. It amounts to 0.000 7 in.I0F (0.003 2 cm/"C)
or, 0.081 in. (0.206 cm) for the year ( I ) , the temperature
change being 116 F deg (64.4 C deg).
Moisture loss also can attenuate expansion of the panels at maximum temperatures. In fact, maximum temperature movements showed a sharp minimum in July 1970 [jig. 9 (a)], contrary to the general trend of the curves and mainly for data representing the top of the panels. If the four readings forming the minimum are eliminated from the data, the average of the correlation coefficients improves with an added 0.2 (at the top, but only with a small amount at the bottom). The slope of the best fitting line increased also and in one case (gauge No. 7, maximum temperature) even reached the estimated value of 0.0007 in.I0F. The reversed trend represented by the four readings may have been caused by partial drying of the brick panels on the surface only, causing an outward curling mainly at the top edge of the panel. This would appear on the gauges as a reduction in panel width.
In addition to the assumed effect of moisture content variations on movement due to temperature, there is the effect of restraint: truss-like tie-rods imbedded in the mortar joint can restrain some of the movement due to
(') Calculation of estimated movement for 37-ft (11.3 m) panel change and there can be some restraint between of 8-in. (20 cm) brick and 318-in. (1 cm) mortar, alternating;
brick: brick and mortar [3].
2.35 x (12 x 3712-9.134)=0.0005 in.IoF
(for coefficient see Reference [5]); Movements in the vertical direction
mortar and concrete panel of columns: Triaxial gauges mounted at the top of the panels
6.10-6 (9.134+24)=0.0002 in.IoF monitored vertical movement of the brick panels in
relation to the concrete panels. The latter were rigidly
(for coefficient see Reference [6]).
attached to the column in the area where the gauges were
Total estimated movement =0.0007 in.IoF (9.134 is the sum of the
mortar joints in inches; 24 is the width of the concrete panel covering so that any recorded can be
Vol. 13 - No 73 - Materiaux et Constructions
found between movement and temperature for the year of observation. Because the recorded movements exceeded by far the usual scatter, their pattern of change with time was examined.
Figure 10 is an example of the vertical movement at the top of the brick panels. The continuous line represents upward, the dashed line downward, maximum displa- cements, and the difference between the two is the total oscillation between observations. It is larger in summer than in fall and winter. In December and part of January the panel experiences a large downward movement, remains almost stationary until April, then again moves upward to oscillate at the higher level.
Because no correlation was found with temperature readings, the wide vertical oscillations may be attributed to moisture content changes and may mask any correla- tion with temperature changes. If one assumes that the columns do not change in size and are sufficiently protected by the concrete panels against temperature and moisture content changes, then one can say that the downward movement of the brick panel relative to the concrete panel is a shrinkage of the brick panel. It is probable, however, that the columns undergo shortening in winter [7], and that vertical shrinkage of the brick panel is therefore larger than was measured.
The pattern of vertical movement is the same at all four locations (gauges Nos. 1 to 4). It reaches an average of 0.056 in. (0.143 cm) for the year and is approximately equal to the large downward movement in winter shown in figure 10. An estimate from thermal coefficients for the unrestrained panel gives 0.092 in. (0.234 cm) of movement. Because the measured movement is greater than half the estimated movement, it is not likely that the brick panels expand symmetrically about the centre, as when supported by tie-rods alone, but from the bottom upwards (i. e., from the support provided by the lintel). Movement perpendicular to the wall
Perpendicular movement is registered by the piston, which may be seen in figure 5 at the bottom of the circular cavity of the triaxial gauge. As it is a single piston, the periodic depth readings indicate movement of the brick panels in one direction only: increasing displacement between the brick panel and concrete column. Figure 11 shows the readings versus time for gauge No. 1 and represents the trend observed at the other locations. There was no correlation of movement with maximum or minimum temperature for the period of observation. As can be seen in figure 11, the peak in July 1970 is inconsistent with annual sinusoidal behaviour; the data were therefore re-examined, omitting the first four readings. The new correlation coefficient was found to be 0 . 6 6 and -0.70, on the average, when correlated with maximum and minimum temperatures, respectively.
A sharp minimum for the first four readings occurs for the maximum temperature plots of horizontal movements, as can be seen in fig. 9 (a) and (c). If the latter curves were not reversed, this peak would occur as
a maximum, as on figure 11. The effect is negligible on the minimum temperature plots [Jig. 9 (b) and (d)]. Correspondence of the initial maximum in the perpen- dicular movements with the initial minimum in the (reversed) maximum temperature plots of the horizontal movements is an indication that these readings for perpendicular movement were probably associated with maximum temperatures during the periods of obser- vation. The good correlation of both maximum and minimum temperature data after deleting the first four readings also confirms this conclusion. Maximum and minimum temperatures plotted as a function of time give approximately parallel sinusoidal curves, so that move- ment readings should correlate equally with either temperature unless the trend depends also on moisture movement. It has been demonstrated already with hori- zontal movements that correlation exists for maximum temperatures but is missing, in most cases, for minimum temperatures. One can deduce that the movement registered in the direction perpendicular to the wall probably occurs at maximum temperatures.
The movement is not the result, however, of the expansion or contraction of the brick panel in the direction perpendicular to the wall because it is six to ten times larger, depending on location, than the small amount of movement that can be calculated from the linear thermal coefficient of expansion of the brick and the thickness of the wall. The estimated movement due to moisture change is even smaller by one order of magnitude. It is probable that the movement is a result of the bending of the top of the panels outwards.
CONCLUSION
Movements of masonry brick panels, determined from dimensional changes measured at the joints, have been studied in three directions: horizontal and vertical directions parallel to the panels and perpendi- cular to them. Analysis of movements and temperature readings collected simultaneously at two-week intervals and statistically correlated revealed panel movements different from those found in previous investigations (these concerned other materials). It became necessary to examine both movement and temperature changes as a function of time.
The results of statistical analysis of the horizontal movements showed that the slope of the regression line, that is, the movement per degree temperature change, was much higher for observations associated with maximum temperatures than for t4ose associated with minimum temperatures. The average amount of maximum movements measured during the year was 0.061 in. (0.155 cm), considerably less than the movement estimated from thermal coefficient of linear expansion :
0.081 in. (0.206 cm) of an unrestrained panel. The data for minimum temperature showed no correlation at all in five of eight cases and had a lower slope in