HAL Id: hal-01276664
https://hal.archives-ouvertes.fr/hal-01276664
Submitted on 3 Jun 2019
HAL is a multi-disciplinary open access
archive for the deposit and dissemination of
sci-entific research documents, whether they are
pub-lished or not. The documents may come from
teaching and research institutions in France or
abroad, or from public or private research centers.
L’archive ouverte pluridisciplinaire HAL, est
destinée au dépôt et à la diffusion de documents
scientifiques de niveau recherche, publiés ou non,
émanant des établissements d’enseignement et de
recherche français ou étrangers, des laboratoires
publics ou privés.
Non-intrusive rattle noise detection in non-stationary
conditions by an angle/time cyclostationary approach
Sophie Baudin, Didier Rémond, Jérôme Antoni, Olivier Sauvage
To cite this version:
Sophie Baudin, Didier Rémond, Jérôme Antoni, Olivier Sauvage. Non-intrusive rattle noise
detec-tion in non-stadetec-tionary condidetec-tions by an angle/time cyclostadetec-tionary approach. Journal of Sound and
Vibration, Elsevier, 2016, 366, pp.501-513. �10.1016/j.jsv.2015.11.044�. �hal-01276664�
Non-intrusive rattle noise detection in non-stationary conditions by an angle
/time
cyclostationary approach
Sophie Baudina,b,c,∗, Didier R´emonda, J´erˆome Antonib, Olivier Sauvagec
aUniversit´e de Lyon, INSA Lyon, LaMCoS UMR5259, F-69621, Villeurbanne, France bUniversit´e de Lyon, INSA Lyon, LVA, F-69621, Villeurbanne, France
cPSA Peugeot Citro¨en, Direction Scientifique et Technologies Futures, StelLab, F-78943, V´elizy-Villacoublay, France
Abstract
This work proposes an original non-intrusive approach to detect and quantify rattle noise in automotive gearboxes operating under non-stationary conditions by means of vibration or instantaneous angular speed measurements. Rattle noise is produced by vibro impacts between teeth of unloaded gears excited by the engine acyclism. It appears during acceleration or deceleration phases and its detection requires the analysis of non-stationary signals. In order to take advantage of the repetitive nature of the impacts, an angle/time cyclostationary approach is introduced. Rattle noise is thus characterized through the angle/time duality: the cyclic frequency expressed in events per revolution is directly linked to the periodicity of the impacts while their frequency content is expressed in Hertz. The proposed detection method uses an order/frequency spectral coherence and may be applied either on vibration signals or instantaneous angular speed signals. For validation purposes, a specific instrumentation of a gearbox is set up. The relative speed of the unloaded meshing gears is observed by means of optical encoders to directly detect the instants of impact which then serve as a basis for validation of the non-intrusive detection method proposed in this paper.
Keywords: Rattle noise, Non-stationarity, Angle/time cyclostationarity, Order/frequency spectral coherence, Instantaneous angular speed
1. Introduction
At low speed, noise generated by cars is principally caused by parts of the powertrain. In particular, reduction of engine noise emissions has increased the emergence of noise sources which were previously masked. On the other hand, downsized new engines generate more low frequency acyclic excitations into the vehicule. In automotive vocabulary, the term ”rattle” refers to an impact-induced phenomenon which can occur when there is a relative motion between two components with loss of contact [1]. The interest of this paper is focused on rattle noise which can suddenly appears in gearboxes [2]. In manual gearboxes, the pinions are constantly meshed together. For each gear pair, one driving pinion is fixed to its shaft while the loose gear is free to rotate. When a gear ratio is engaged, the corresponding loose gear is temporary fixed to its shaft while the other ones stay free to rotate. Because of the engine
acyclism transmitted to the primary shaft of the gearbox, the loose gears vibrate through their backlashes and some impacts can occur between teeth of unloaded gears. The transmission of the shocks to the housing of the gearbox generates rattle noise. Rattle noise is of primary interest in NVH (Noise, Vibration and Harshness), not because it damages the gears but because it produces an acoustic nuisance which is a recurrent problem for car manufacturers.
Among signal processing methods, the kurtosis-based family is classically used to characterise the impulsiveness of a signal. Spectral kurtosis, band kurtosis and kurtogram are the most used techniques deriving from the kurtosis, defined as the ratio between the fourth central moment and the squared second central moment. For the detection of generic rattle noise defined by impact-induced phenomenon, impulsive criteria such as kurtosis based methods seem suitable [3] [4]. These references deal with generic rattle noise for which the engine rotation speed is not a direct control parameter of the system. On the contrary, the interest of the present study is focused on gearbox rattle noise directly linked to the engine acyclism.
Different approaches have been proposed to model gearbox rattle noise. Some authors investigate phenomenolog-ical approaches [5] [6] while others build global models [7] [8]. The experimental analysis of rattle noise requires test benches able to reproduce engine acyclism by means of a universal joint for example [9]. Many studies are focused on idle gear noise (gearbox on neutral) and use electro-dynamic translation exciters [10] [11]. Kadmiri et al. [6] exploit a dedicated test bench replicating excitations from an automotive powertrain. They use two optical encoders in order to measure the Instantaneous Angular Speed (IAS) of driving and loose gears under stationary operating conditions. Several methods can be employed to obtain the IAS: the elapsed time method uses a high frequency clock while the ADC (Analog to Digital Conversion)-based method exploits the analog encoder signal [12]. Some recent works analyse the IAS measurement errors such as the geometric error, the filtering effect due to elapsed time measurement or the counting error [13] [14]. From these results IAS can be considered as a good and precise way to reach dynamic behaviour of gears when rattle noise occurs. According to the level of the influencing parameters (level of acyclism, drag torque, pinion inertia...), different situations can be distinguished : single-sided impacts, double-sided impacts or irregular impacts [7].
The state of the art illustrates the difficulty to predict with accuracy rattle noise level before the conception phase. This phenomenon indeed depends on many physical parameters and especially on damping which is difficult to model in this type of systems [15]. The occurrence and the level of rattle noise depend on speed/load operating points which are then difficult to predict. Moreover rattle noise appears principally during acceleration and deceleration phases and its detection during operation thus requires the analysis of non-stationary signals. Consequently, in the present practice, the occurrence and the level of rattle noise are usually judged by in-situ listenings of trained auditors.
In order to help more efficient evaluations the aim of this paper is then to construct a method to detect and quantify rattle noise from measurements under non-stationary operating conditions. The method has to be non-intrusive in order to be industrially adaptable without requiring modifications on gearboxes. In this work the interest is focused on ”periodic” cases which seem to be the least severe in terms of sound intensity [7] and then require more advanced signal processing methods. In particular, in a four-cylinder four-stroke combustion engine the acyclism is principally
composed of the second harmonic of the rotation speed (denoted H2) and periodic rattle is thus generally composed
of four impacts per revolution of the primary shaft: one impact on the active flank and one on the reverse flank of the gear per period H2.
Rotating machines such as gearboxes produce signals exhibiting cyclostationary properties when operating under stationary or quasi-stationary conditions [16] [17]. The occurence and the level of rattle noise depending on operating conditions and in particular on the rotation speed, the interest in our work is focused on tests in run up conditions classically used to scan the NVH behavior of gearboxes. The assumption of cyclostationarity has thus to be replaced by the so called assumption of ”cyclo-non-stationarity” which is a recent field of research [18] [19] [21]. In this context, the order-frequency distribution proposed by D’Elia et al. in reference [18] is particularly well suited to the analysis of rattle noise: the ”cyclic frequency” expressed in events per revolution (epr) is directly linked to the periodicity of the impacts while the spectral content of these impacts are linked to the ”spectral frequency” expressed in Hertz. A formal framework to this approach is given in reference [20] which introduces the ”angle/time cyclostationary” class of signals. Some useful results for rattle noise detection are recalled in this paper. For rotating machine diagnostics, cyclostationary tools are generally applied on vibration or acoustic signals. Their application is however not limited to signals of this nature and can for example be applied on signals issued from angular encoders. In this work the angle/time cyclostationary tools will be applied both on vibration and IAS signals.
The organisation of the paper is as follows. The angle-time cyclostationary approach is first presented. It enables the detection of rattle noise with an order-frequency distribution which requires the measurement of IAS with an optical encoder. The test bench and the gearbox instrumentation used in this study are then presented. For validation purposes, a specific instrumentation is used with optical encoders that intrusively measure the relative speed between the driving and the loose gears. These measurements will serve as a reference in order to validate the new non-intrusive detection method proposed in the last section. An order/frequency spectral coherence is eventually estimated on vibration and IAS signals to detect and quantify rattle noise occurence by observing the evolution of the frequency content of a given cyclic order. A comparison is also made with the Spectral Kurtosis which more closely follows the traditional approach for rattle noise detection.
2. Angle/time cyclostationarity
The cyclostationarity assumption is now widely used to analyse vibration signals of rotating machines [16] [22]. This section will show the interest of maintaining an angle/time duality to analyse such signals in non-stationary conditions.
2.1. Angle/time duality
In the time domain, cyclostationary signals can be expressed as a Fourier series [23]
x(t)=X
k
whose coefficients ck(t) are jointly stationary random processes and whose complex exponentials are expressed in the
time domain and depend on the cyclic frequency αt(subscript t in this notation will serve to differentiate this cyclic
frequency expressed in Hertz and the cyclic order αθexpressed in ”number of events per revolution” (epr)). For a
second-order cyclostationary signal, the autocorrelation function Rxx(t, τ) = Ex(t)x∗(t − τ) (depending on the time
variable t and the time-lag τ) is periodic with respect to time, with E the ensemble averaging operator. A double Fourier transform relatively to t and then τ defines the spectral correlation function Sxx(αt, f ) which is a
”frequency-frequency” distribution with the ”cyclic ”frequency-frequency” αt and the ”spectral frequency” f both expressed in Hertz. An
equivalent but more convenient definition is:
Sxx(αt, f ) = lim W→∞ 1 WE h FW{x(t)}∗FW{x(t)e−j2παtt} i (2)
where FW{x(t)} stands for the Fourier transform of signal x(t) over a time interval of finite duration W. The cyclic
frequency αtcharacterizes the cyclic modulations of the waveforms while the spectral frequency f characterizes the
spectral content of the carrier signal.
Cyclostationarity expressed in the time domain supposes exact periodicity of the signal statistics in time. In practice the cyclic patterns produced by rotating machines are more directly linked to the angle of rotation of the machine rather than to time. Signals measured on rotating machines with discrete geometry are then often angularly resampled or directly acquired in the angle domain [24] in order to get a constant number of angular samples per cycle. In the angle domain, cyclostationary signals can be expressed as a Fourier series whose coefficients ck(θ) are
jointly stationary random processes relatively to angle and whose complex exponentials depend on the cyclic order αθ[17] :
x(θ)=X
k
ck(θ)ejkαθθ. (3)
The autocorrelation function Rxx(θ, τθ)= Ex(θ)x∗(θ − τθ) is then expressed with the angular variable θ and the
angle-lag τθ. Its double Fourier transform, the spectral correlation function Sxx(αθ, fθ), is then an order-order distribution
with ”angle” frequencies both expressed in number of events per revolution. The angle cyclostationarity enables the characterization of the cyclic phenomena in operating conditions with some speed fluctuations. It is however unable to accurately characterize the spectral content of the waveforms due to structural signatures, since both variables fθ
and αθare now dual to the angular position of the shaft.
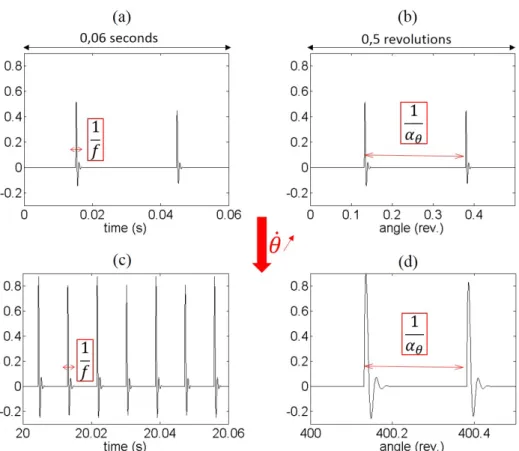
The dilemma of choosing between a time domain or an angle domain representation is now illustrated by means of an example. Figure 1 illustrates the angle/time complementarity. A vibration signal x(t) composed of some impacts s(t) linked to a rotating component applied to a mechanical system characterized by its impulse response h(t) is simulated by the convolution
with h(t)= e−ζ2π f0tsin(2π f 0t) , t ≥0 0 otherwise
where ∗ stands for convolution, f0and ζ represent the natural frequency and the damping ratio, respectively, and
s(t)= A(˙θ(t)).X
k
δ(t − tk) with tk such that θ(t¨ k)= 0, (5)
where ˙θ(t) is the acyclic IAS and A(˙θ(t)) is a coefficient introduced to simulate the amplitude modulation due to the instanstaneous operating conditions. Figure 1 (a) corresponds to the observation of the signal in the time domain during 0.06 s. An increase of 1200 rpm (revolutions per minute) is simulated between figures (a) and (c). The frequency content is unchanged but the signal does not exhibit any periodicity. Firstly the time spacing between two impulses is not constant and secondly the amplitude is changing due to speed evolution. In the angle domain (figures (b) and (d)) the spacing between impulses is kept constant but exact periodicity can still not be defined because of the changes of the frequency content (spread of the impulses) and of the amplitude modulation. Thus such a signal cannot be analysed neither in the time domain nor in the angle domain where the spectral correlation is expressed as a function two frequency variables with the same metric units (expressed in Hz/Hz or epr/epr respectively). The joint angle/time representation introduced in the next subsection is intended to solve this dilemma.
2.2. Angle/time cyclostationary tools
D’Elia et al. [18] propose a two-dimensional distribution which displays cyclic order (expressed in epr) versus frequency (expressed in Hertz) after two resampling operations. They show experimentally the relevance of such a dis-tribution which enables the analysis of a signal in both time and angle domains. Urbanek et al. [25] propose another approach based on a time-frequency representation of selected cyclic components. In order to analyse cyclo-non-stationary signals, Capdessus et al. [26] propose an extension of the Fourier transform called the Speed Transform, where the vibration signal is decomposed over a set of time-varying frequency sine waves synchronized with the speed variation instead of fixed frequency sine waves. This approach is however limited to linear speed variations. Napolitano [27] introduces the class of ”spectrally correlated processes”, wherein the support of the Lo`eve bifre-quency spectrum is composed of countable set of curves. If the location of the support curves is unknow, the spectral correlation density function of such a process can only be estimated if the departure from almost-cyclostationarity is sufficiently small. More recently, Antoni et al. [20] propose a theoretical framework for the definition of an order vs. frequency distribution with a generalization of the cyclostationarity concept. To do so, a novel class of signals called ”angle-time cyclostationarity” (AT-CS) is defined. The principal results exploited hereinafter for rattle noise detection are now recalled.
Figure 1: Vibration signal produced by a series of impacts linked to a rotating component and observed in the time domain before (a) and after (c) increase of the speed regime. Observation of the same signal in the angle domain before (b) and after (d) speed increase.
Angle/time cyclostationary signals can be expressed as the Fourier series
x(t)=X
k
ck(t)ejkαθθ(t) (6)
where coefficients ck(t) are jointly stationary random processes in time and where the complex exponentials are
ex-pressed in the angle domain and depend on the cyclic order αθ. The stationarity of ck(t) is a major difference with
cyclo-non-stationnary signals, recently defined in reference [19], where Fourier coefficients are supposed jointly non-stationary. As presented in the inclusion diagram in Fig. 2, the class of angle/time cyclostationary signals is included in the class of cyclo-non-stationary signals.
Angle/time cyclostationary signals are characterized by their angle-time autocorrelation function expressed with respect to the angular variable θ and the time-lag τ and defined as:
Rxx(θ, τ)= E[x(t(θ))x∗(t(θ) − τ)]. (7)
The carrier phenomena (for example those expressed by their impulse response h(t)) are analysed by τ (expressed in seconds) while the cyclic phenomena are analysed by θ (expressed in radians). A double Fourier transform gives an
Figure 2: Inclusion diagram of different classes of processes.
order-frequency distribution called the order-frequency spectral correlation (OFSC):
Sxx(αθ, f ) = F θ→αθ
n F
τ→ f{Rxx(θ, τ)}o. (8)
Noting that the integration variable θ depends on time, θ= θ(t), the OFSC is then expressed as [20] [21] :
Sxx(αθ, f ) = lim W→∞ 1 Φ(W)E h FW{x(t)}∗FW{x(t)˙θ(t)e−jαθθ(t)}i (9)
where αθstands for the cyclic order, ˙θ(t) = dθ/dt stands for the IAS, Φ(W) = Rwθdt is the angular sector spanned˙
during the time interval W and FW{.} stands for the Fourier transform over the finite time interval W. It is noteworthy
that the IAS ˙θ(t) explicitely appears in the expression of the OFSC. It is a major difference with the cyclostationary case which does not account for it. Moreover, contrary to reference [18], this order vs. frequency distribution does not require any angular resampling.
Similarly to the cyclostationary case, the order-frequency spectral coherence (OFSCoh) function is defined as γxx(αθ, f ) =
Sxx(αθ, f )
[Sxx(0, f )Sxαθxαθ(0, f )]1/2
(10)
where xαθ(t)= x(t)˙θ(t)e−jαθθ(t). The squared magnitude |γxx(αθ, f )|2is normalised between 0 and 1, with the advantage
of measuring the degree of correlation independantly of the signal power spectrum. This descriptor gives a quantitative measure of the emergence of the signal of interest relative to noise and can therefore be interpreted as a ”signal-to-noise” ratio.
For the following results the OFSCoh will be estimated with the Welch estimator.
For the present application, the proposed OFSCoh returns a quantification of the emergence of rattle noise from background noise. Let the measured signal x(t) be the sum of rattle noise s(t) and other sources of noise (i.e. back-ground noise) n(t). Since rattle noise only is supposed to be cyclostationary with cyclic order αθ, the OFSCoh reads
γxx(αθ, f ) =
Sss(αθ, f )
[(Sss(0, f )+ Snn(0, f ))(Ssαθsαθ(0, f )+ Snαθnαθ(0, f ))]1/2
From the Cauchy-Schwarz inequality, it comes 0 ≤ |γxx(αθ, f )| ≤ 1. If no rattle noise is present, then γxx(αθ, f ) = 0,
whereas if rattle noise is dominant, then γxx(αθ, f ) = 1. The OFSCoh is thus a quantitative measure of the emergence
of rattle noise from background noise normalized between 0 and 1. Note that it is not to be confused with an absolute measure of rattle noise: it is relative to background noise, which is truly the objective of interest in terms of acoustical perception (for instance rattle noise may be present but completely masked by background noise, in which case it will not be perceived and γxx(αθ, f ) = 0).
The experimental application based on OFSCoh will be detailed in section 5. The next part presents the test bench and the instrumentation used in this study.
3. Experimental protocol
3.1. Test bench and measurement configurations
The test bench used in this study is composed of an automotive gearbox driven by an electrical motor which is speed controlled. A large range of operating conditions can be applied, including speed ramp or other non-stationary speed laws. A load is applied to the gearbox by an electrical generator which is torque controlled. A low-pass me-chanical filter composed of a torsion rod and two inertia wheels enables the filtration of most of torsional vibrations induced by the generator. An acyclic excitation can be applied by means of a universal joint which leads to a mis-alignment between the motor axle and the primary shaft of the gearbox. The torque transmitted to the gearbox is then composed of the superposition of a constant torque and an oscillating torque at the second harmonic of the rotation speed. This apparatus simulates the natural acyclism of four-cylinder four-stroke combustion engines and allows the occurrence of rattle noise during non-stationary operating conditions.
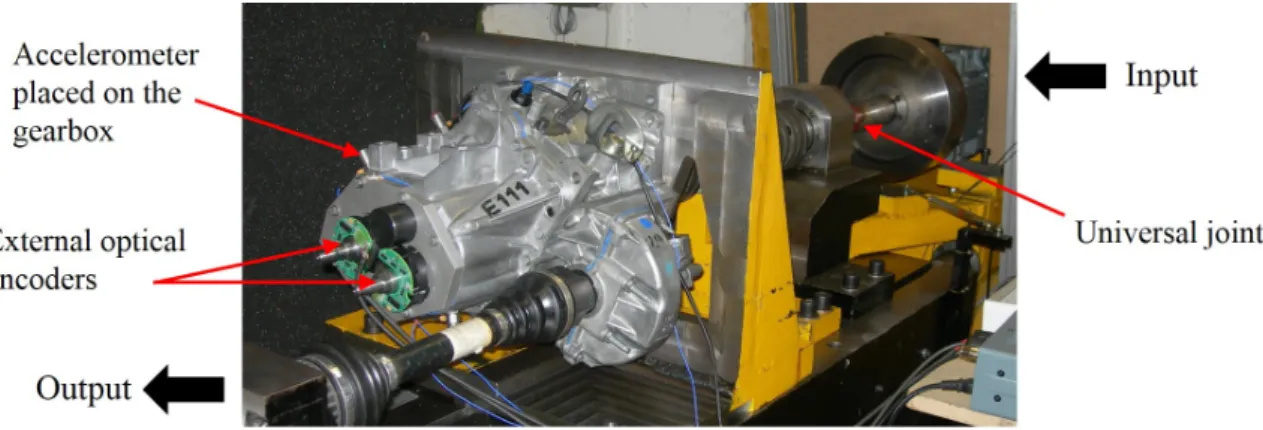
In this study a speed ramp with a variation of 1450 rpm is applied during 40 s and two misalignments of the universal joint are compared (0◦ and 8◦). The gearbox shown in Fig. 3 is equipped with different transducers
(ac-celerometers and optical encoders). The 5thmeshing gear is removed and the corresponding housing is replaced by a
plate. Two optical encoders (Heidenhain ERO 1324) are thus placed at the end of the primary and secondary shafts in order to measure the IAS or the Transmission Error (TE) of these two shafts. Their resolution is 2048 pulses per rev-olution. The encoder acquisition is realised with the elapsed time method by counting the number of high frequency clock events between two marks of the encoder. This elapsed time method is detailed in reference [28]. The clock frequency is F= 80 MHz.
In this study an accelerometer (PCB 353B33) is mounted on the housing in order to measure the vibration response of the gearbox. The accelerometer signal is acquired with a sample frequency of 40960 Hz after anti-aliasing filtering at 13889 Hz.
Figure 3: Instrumented gearbox on the LaMCoS test bench.
3.2. Specific gearbox instrumentation with optical encoders
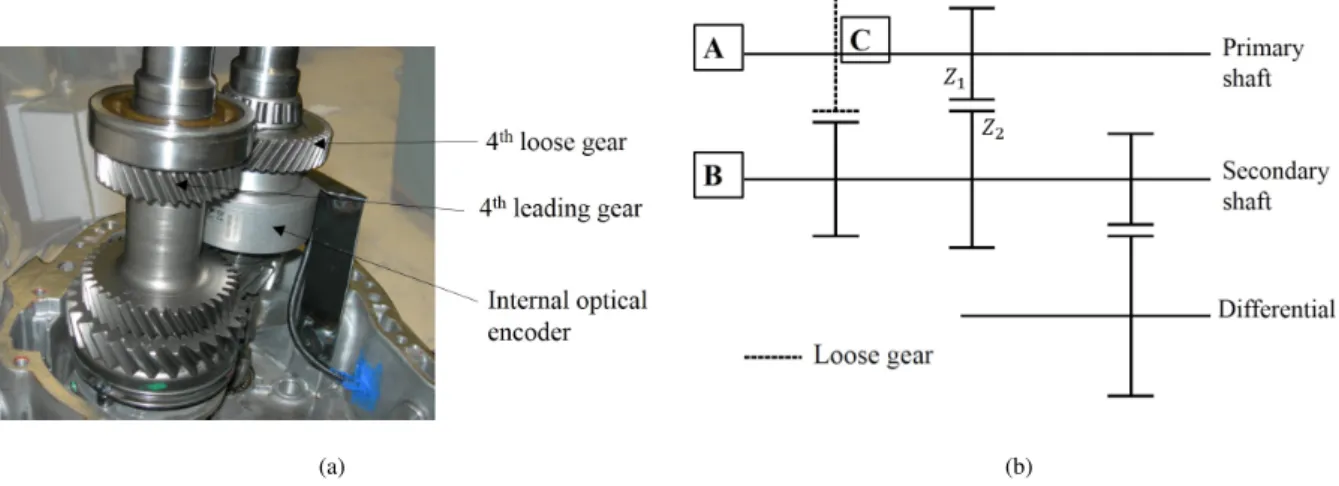
A dedicated instrumentation is set up for this study. The 2nd meshing gear is engaged (gear ratio Z1/Z2) and
the 4th unloaded meshing gear is instrumented with an optical encoder in order to measure the IAS of this loose
gear. In this gearbox the 4thloose gear is located on the primary shaft. The encoder has to resist to severe operating
conditions (high temperature and presence of lubricant) and the acceptable size is limited by the other parts inside the gearbox. For this reason the encoder Lika C80, with a resolution of 2048 pulses per revolution, has been chosen. The implantation of the encoder is observable in Fig. 4 (a). The 1stand 3rdloose gears, the reverse meshing gear and the
synchroniser sets are removed. With this specific configuration, only the 4thunloaded meshing gear can potentially
produce rattle noise.
Figure 4 (b) shows the tested gearbox configuration. The optical encoder noted ”A” is placed at the end of the primary shaft to obtain the IAS of the input shaft. The optical encoder ”B” is placed at the end of the secondary shaft. These two encoders are visible in Fig. 3. It is assumed that the IAS of the 4thleading gear is equal to the IAS of the secondary shaft obtained with the encoder B as the gear is fixed to its shaft. The IAS of the 4thloose gear is obtained
with encoder C (Fig. 4 (a)) placed inside the gearbox.
Encoders B and C are used to estimate the relative velocity (or the Transmission Error) between the loose and the driving pinions of the 4th meshing gear (unloaded). In the next part, this relative velocity is used to observe the
occurrence of impacts generating rattle noise. This visual criterion will serve as a reference to validate the original detection method proposed in section 5 and based on the angle/time cyclostationary approach.
(a) (b)
Figure 4: (a) : Internal instrumentation of the gearbox. (b) : Gearbox configuration.
4. Intrusive rattle detection from the relative velocity 4.1. Principle
The 0◦ misalignment configuration corresponds to a test without acyclism and thus without occurrence of rattle noise. The relative velocity between the pinions of the 4thunloaded meshing gear is estimated with encoders B and
C. A previous work [6] used a similar instrumentation to study automotive rattle noise under stationary operating conditions. In our work the interest is focused on detection in non-stationary conditions.
The instants of impact for the 8◦ misalignment will be detected by comparison with the relative velocity at 0◦
misalignment. The relative velocity is calculated from the IAS of both gears. The assessment of the IAS with optical encoders is subject to several difficulties recently described in references [13] and [14]. Rotating encoders are composed of a rotating device containing a number of marks which defines the resolution of the encoder. In the optical technology, those marks are alternating sectors. The angular imprecision between two marks generates geometric errors in the estimation of the IAS. Another type of uncertainty is due to the acquisition protocol which implies counting error (or quantization error) for the elapsed time method. The next section is focused on the counting error which can be limited by a low-pass filter in the order domain.
4.2. Counting error
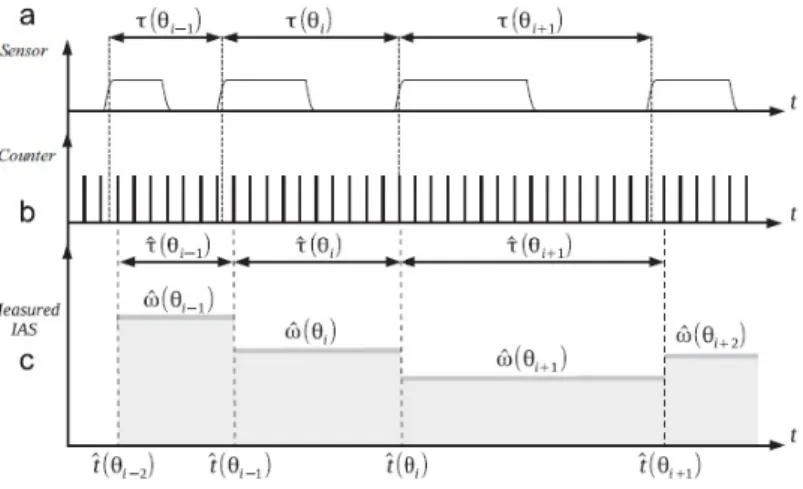
In this study the encoder acquisition is realized with the high frequency counting approach by counting the number Nhof clock events between two marks of the encoder (see Fig. 5, from [14]). The IAS is then estimated as
ˆ ω(θ) =2π R . F Nh (12) where F is the clock frequency and R the encoder resolution. The number Nhof clock events is necessarily an integer.
The counting error corresponds to the uncertainty in the time estimated between two marks of the encoder due to the round-off of Nh.
Figure 5: IAS estimation with the elapsed time method. (a) Encoder signal. (b) High frequency clock. (c) Estimated IAS. [14]
Reference [14] deals with the counting error in non-stationary case. A statistical approach is considered to estimate the random perturbation resulting from the quantization. The quantization threshold ηDω ˆωˆ ( fθ) distinguishes the spectral
components induced by the quantization from those induced by a real mechanical information. With probability α, the quantization noise perturbing the IAS estimation is obtained with the following quantization threshold :
ηDω ˆωˆ ( fθ)= − ln(α) 3F2 sin(π fθ∆θ) 2ω 4 0 ∆θ2 (13)
with fθ the ”angle” frequency,∆θ = 2πR the angular distance between two marks of the encoder and ω0 the mean
operating speed. In other words, a spectral component of the power spectral density (PSD) Dω ˆωˆ ( fθ) which is higher
than the quantization threshold ηDω ˆωˆ has a probability α to be induced by the counting error.
Figure 6 (a) shows the PSD of the IAS obtained with encoder B superposed with the quantization threshold ob-tained for α= 0.1% for the range [0 - 400] events per revolution (epr). For high orders (above around 300 epr) the shape of the theoretical quantization spectrum approaches the shape of the spectrum of the IAS. For the range [300 - R/2] epr only 2.2% of spectral components of the PSD is higher than the quantization threshold. The level of the IAS spectrum above 300 epr is then mainly due to the quantization noise. A similar observation is done for encoder C placed inside the gearbox (figure 6 (b)). Once again the spectral components above 300 epr seem mainly induced by the counting error.
In the rest of this study we thus apply a low-pass filter in the order domain in order to minimize the influence of the counting error on the IAS. The cut-off order is chosen at 300 epr.
0 100 200 300 400 10−5 100 (rad/s) 2/epr epr (a) 0 100 200 300 400 10−5 100 (rad/s) 2/epr epr (b)
Figure 6: PSD of the IAS obtained with optical encoders B (a) and C (b) (black) and quantization threshold for α= 0.1% (red dash curve) in the range [0-400] epr.
4.3. Detection results with an intrusive approach
The IAS of the 4thleading and loose gears can be estimated with Eq. (12) by using encoders B and C and the
relative velocity between the two gears is thus obtained. It corresponds to the difference between the IAS of the leading gear and the loose gear by taking into account the gear ratio.
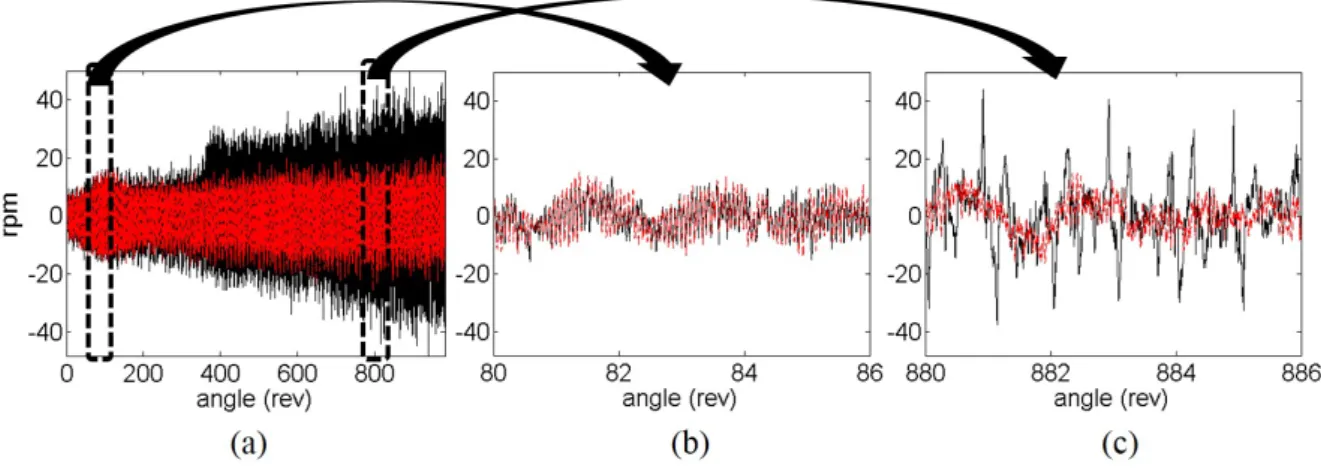
The relative velocity between the loose gear and the leading gear is displayed in Fig. 7 to detect the impact in-stants. The 0◦misalignment case corresponds to a test without acyclism and then without occurrence of rattle noise. In Fig. 7 (b) it is observed that around 80 rev. of the primary shaft (where the IAS of the primary shaft is around 1000 rpm) the relative velocity has the same magnitude for the two misalignments and no impact is detected. In Fig. 7 (c) (where the IAS of the primary shaft is around 1900 rpm) the relative velocity for the 8◦ misalignment shows
that successive impacts are detected. The sign of the relative velocity enables the differentiation of the shocks on the active flanks from those on the reverse flanks. Four impacts per revolution of the primary shaft are detected with an alternance between active and reverse flanks. According to this visual criterion, rattle noise is then detected by the encoders from -approximately- the 350threvolution of the primary shaft.
This intrusive approach will serve as a reference in order to validate the indirect detection method presented in the next section.
5. Non-intrusive rattle noise detection with the order/frequency coherence
The OFSCoh introduced in section 2 will now be used to detect and quantify rattle noise from the vibration (subsection 5.1) and IAS signals (subsection 5.2).
Figure 7: (a) Relative velocity between the loose gear and the leading gear for misalignments of 0◦(red dash curve) and 8◦(black). Zoom around
80 (b) and 880 (c) revolutions of the primary shaft.
5.1. Application on vibration signals 5.1.1. Detection method
The proposed method uses an accelerometer fixed on the gearbox housing and measurements in run-up conditions. Figure 8 illustrates the proposed methodology. The vibration signal is divided into 13 portions containing a constant number of angular samples. The choice of the length of the portions induces a compromise between the variance of the OFSCoh and the precision of the detection of the impacts during the speed ramp (classical bias/variance trade-off). In this study, portions of 73 revolutions of the primary shaft are considered. Signals of each portion being considered angle/time cyclostationary, the OFSCoh is estimated with Eq. (10) for αθ = 2 epr. This cyclic order corresponds to
the number of pairs of impacts on active and reverse flanks per revolution of the primary shaft. The estimation of the OFSCoh requires the knowledge of a reference IAS which is here obtained with encoder A placed at the end of the primary shaft (cf. Fig. 4 (b)).
5.1.2. Results
In section 2.2, angle/time cyclostationary tools have been presented on signals containing both first and second or-der cyclostationarity. The detection results are thus first shown on the entire signal and the influence of the first-oror-der component will be investigated in the next section.
For each signal portion, the OFSCoh |γxx(αθ = 2, f )|2is presented on a ”frequency (Hz) vs. revolutions of the
primary shaft” map (Fig. 9). The results for both 0◦and 8◦misalignments are compared. For 0◦misalignment (Fig.
9 (a)) the map highlights very weak amplitudes below 0.01 at order 2 epr: it does not reveal energy in the whole accelerometric signal. That is in accordance with the fact that no acyclism is introduced and then no impacts are produced. For 8◦misalignment (Fig. 9 (b)), wideband areas with higher magnitude up to 0,22 are observed from
about the 400threvolution of the primary shaft. This observation reveals the presence of a phenomenon with an
angle-periodicity of 2 epr with a large frequency bandwidth: it is then assigned to the occurrence of rattle noise. The interest of such maps is to permit the visualization of the bandwidth of a given cyclic order according to the evolution of instantaneous operating conditions. It enables keeping an angle/time duality to characterize the phenomenon. The non-intrusive detection with OFSCoh on vibration signal (rattle noise detected beyond the 400threvolution) shows a good agreement with the intrusive detection based on the exploitation of the encoder signals (rattle noise detected beyond the 350threvolution) in subsection 4.3. Moreover, the OFSCoh values give a relative quantification of rattle
noise emergence compared to background noise: the higher its value, the higher the noise emergence.
angle (rev) frequency (Hz) 0 200 400 600 800 0 2000 4000 6000 8000 10000 0 0.05 0.1 0.15 0.2 (a) angle (rev) frequency (Hz) 0 200 400 600 800 0 2000 4000 6000 8000 10000 0 0.05 0.1 0.15 0.2 (b)
Figure 9: Squared OFSCoh at order αθ = 2 epr for misalignments 0◦ (a) and 8◦(b) estimated on accelerometric signals. (Spectral resolution ∆ f = 80 Hz)
5.1.3. Influence of first-order cyclostationarity
In the previous subsection the OFSCoh has been estimated on the full measured signal. The effect of the first angle/time cyclostationary order is now observed. Amplitude modulation being neglected for successive portions (cf.
Fig. 8), the synchronous average is estimated and removed in the angle domain for αθ= 2 epr. The resulting signal is
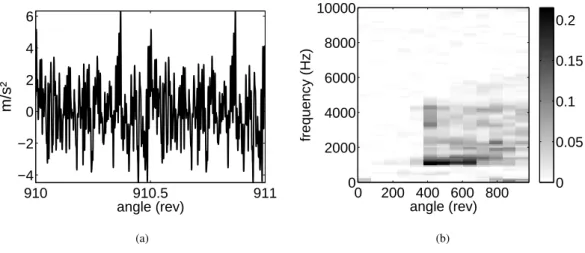
then purely angle/time cyclostationary of order 2. Figure 10 (a) displays the synchronous average extracted from the last signal portion where impacts have previously been detected. The synchronous average RMS (Root Mean Square) value is small (ten times smaller than the RMS value of the full signal portion) thus indicating weak first-order cyclo-stationarity. Figure 10 (b) presents the ”frequency vs. revolutions” map after removing the synchronous average. In comparison with Fig. 9 (b), the detection and quantification of rattle noise is identical with and without presence of first-order cyclostationarity. The calculation of the synchronous average requires a costly angular resampling opera-tion ; thus, detecopera-tion results being unchanged, it does not seem necessary to proceed to this first-order removal in the present application. 910 910.5 911 −4 −2 0 2 4 6 angle (rev) m/s² (a) angle (rev) frequency (Hz) 0 200 400 600 800 0 2000 4000 6000 8000 10000 0 0.05 0.1 0.15 0.2 (b)
Figure 10: (a) Synchronous average on one revolution of the primary shaft estimated from a vibration signal portion. (b) Squared OFSCoh at order αθ= 2 epr for 8◦misalignment estimated on accelerometric signal after removing the synchronous average. (Spectral resolution∆ f = 80 Hz)
5.1.4. Comparison between Spectral kurtosis and OFSCoh
As mentioned in the literature survey of section 1, kurtosis was early proposed as a measure of rattle noise [3] due to its capability to characterise the impulsiveness of a signal. As an extension of kurtosis, the Spectral kurtosis (SK) [29] [30] enables the detection of transients in a signal and also their locations in the frequency domain which is of prime interest in the present application. This paragraph proposes a comparison between the SK and the OFSCoh for rattle noise detection. From the onset, it is interesting to point the theoretical link between the kurtosis and the spectral correlation. In reference [31] Borghesani has demonstrated that the empirical definition of the kurtosis of a cyclostationary signal is equal to the sum of all the peaks of the ”squared envelope spectrum”,R S(α, f )d f , normalized by the zero-frequency peak. This evidences a link between the kurtosis of rattle noise and the order/frequency spectral correlation. In practice these tools are however applied in a mixture composed of rattle noise and background noise.
The kurtosis gives an indication of impulsiveness of the whole signal (rattle plus noise) and is then very sensitive to the background noise content. On the contrary, angle/time cyclostationary indicator (OFSCoh) is tailored to rattle noise occurrence with the synchronization at the cyclic order (2 epr). This indicator can thus be seen as a kurtosis synchronized to the cyclic order of rattle noise.
For illustration, the SK is estimated on each portion of the vibration signal measured successively with 0◦ and 8◦
misalignment and is presented on the ”frequency vs. revolutions” map in Fig. 11 (the frequency resolution of the SK was selected so as to maximise its values [30]). The interest being focused on the detection of impulsive components, the scale of the two figures has been truncated at the positive values. Figure 11 (b) shows that the highest values are obtained in the signal portion where the reference method has previously detected rattle noise (beyond the 350th revolution). However, for the two misalignments (Fig. 11 (a) and (b)), many non-zero values are obtained outside the portion of the effective presence of rattle noise. Moreover, the difference between the two cases (0◦ and 8◦
misalignment) is not as contrasted as with the OFSCoh (see Fig. 9). Rattle noise detection with SK is then disturbed by other impulsive components in background noise. On the contrary, as observed in Fig. 9, OFSCoh is less sensitive to background noise thanks to the synchronization at 2 epr. The use of the OFSCoh rather than the SK then seems superior to accurately detect rattle noise.
angle (rev. of the primary shaft)
frequency (Hz) 0 200 400 600 800 0 2000 4000 6000 8000 10000 0 0.5 1 1.5 2 (a)
angle (rev. of the primary shaft)
frequency (Hz) 0 200 400 600 800 0 2000 4000 6000 8000 10000 0 0.5 1 1.5 2 (b)
Figure 11: Spectral kurtosis estimated on accelerometric signal for misalignments 0◦(a) and 8◦(b). (Spectral resolution∆ f = 320 Hz)
5.2. Application on IAS signals
For rotating machine diagnostics, cyclostationary tools are generally applied on vibration or acoustic signals. Their application is however not limited to signals of this nature and can for example be applied on signals issued from angular encoders. Encoders A and B placed outside the gearbox enable the estimation of the IAS of the primary and secondary shafts. In this section the OFSCoh is applied on the two IAS signals in order to detect rattle noise.
5.2.1. IAS of the secondary shaft
The IAS of the secondary shaft obtained with encoder B is firstly considered (Fig. 12 (a)). The cyclic order of interest for rattle noise is thus αθ = 2Z2/Z1epr with Z1 and Z2 the number of teeth of respectively the driving and
driven gears of the 2ndmeshing gear (engaged).
For the configuration with a 8◦misalignment the synchronous average is presented in Fig. 12 (b) on one revolution of the primary shaft. The extraction of the acyclic component principally composed of the second harmonic of the rotation speed is observed. Contrary to vibration signals, the IAS signal contains a dominant first-order cyclostationary component due to acyclism. Its removal by subtraction of the synchronous average enables the processing of a purely second-order angle/time cyclostationary signal so as to characterize the random speed fluctuations only.
0 200 400 600 800
600 800 1000 1200
angle (rev. of the primary shaft)
rpm (a) 920 920.5 921 1150 1160 1170 1180
angle (rev. of the primary shaft)
rpm
(b)
Figure 12: (a) IAS of the secondary shaft and (b) synchronous average on one revolution of the primary shaft estimated from a IAS signal portion.
Similarly to the vibration signals, the IAS signal is here divided into 13 portions. The ”frequency vs. revolutions” map for the squared OFSCoh is presented in Fig. 13 for both misalignments. The red dash curve indicates the cutting frequency of the low-pass filter applied in the order domain (cf. part 4.2). For the configuration without acyclism (Fig. 13 (a)), the presence of cyclic order αθ= 2Z2/Z1epr is not revealed (values of the OFSCoh remain below 0.02).
For 8◦misalignment (Fig. 13 (b)), starting from the sixth portion (centred around the 415threvolution of the primary
shaft), some higher amplitudes up to 0.27 are observed for almost all the exploitable frequency band. Impacts are then detected in the signal portions where rattle noise has previously been detected with the reference method based on relative velocity. Impacts generate indeed a disturbing torque which results in a IAS variation of the secondary shaft detected by the optical encoder. It is thus demonstrated that the detection of rattle noise can be achieved from the IAS signal alone.
5.2.2. IAS of the primary shaft
The same method is now applied on the IAS of the primary shaft. The cyclic order of interest is then αθ= 2 epr.
(a) (b)
Figure 13: Squared OFSCoh at order αθ = 2 epr for misalignments 0◦(a) and 8◦(b) estimated on IAS of secondary shaft. The red dash curve indicates the cutting frequency of the low-pass filter applied in the order domain. (Spectral resolution∆ f = 80 Hz)
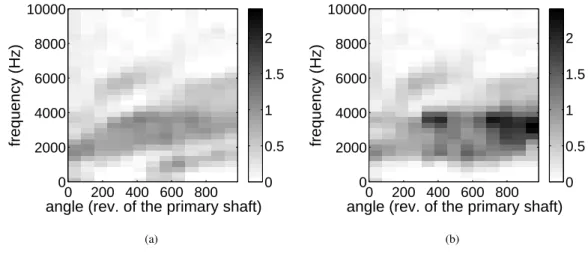
energy peaks (spectral curves of darken color) evolving with frequency during run-up generating the so-called ”whine noise” are observed. Those peaks being also present for the case of 0◦misalignment (Fig. 14 (b)), they are not only
due to acyclism but are characteristic to the engaged gear meshing. Reference [32] describes phenomena detectable on the IAS order spectrum. The order observed at 2 epr can essentially be attributed to the second harmonic of the pinion eccentricity. For 8◦ misalignment the amplitude of the peaks slightly increases starting from the 400th revolution of the primary shaft, which corresponds to the signal part where impacts were previously detected. The increase is however weak and appears only in the frequency band between about 1000 and 2500 Hz. This frequency band is thus not large enough to correctly differentiate rattle noise (expected with a large frequency bandwidth) from whine noise (characterized by localised frequencies evolving with speed). Whine noise with high energy then prevents the detection of rattle noise by means of the IAS of the primary shaft.
6. Conclusion
Depending on the values taken by some parameters such as the level of acyclism, loose gear inertia..., the vibrations of loose gears generate repetitive impacts throughout their backlashes. The transmission of the shocks to the housing of the gearbox generates rattle noise which in turn produces acoustic nuisance. The appearance and the level of this phenomenon depending on operating conditions, the interest has here been focused on tests in run-up conditions.
In order to take advantage of the ”periodicity” of the impacts, the angle/time cyclostationary approach has been exploited. The order/frequency spectral coherence (or correlation) enables the analysis of the spectral content of a given cyclic order by means of the explicit consideration of the IAS. An original non-intrusive rattle noise detection method has then been proposed. This approach does not require any angular resampling but requires the measurement of the IAS. A specific gearbox configuration has been considered for validation purposes where only two meshing
(a) (b)
Figure 14: Squared OFSCoh at order αθ= 2 epr for misalignments 0◦(a) and 8◦(b) estimated on IAS of primary shaft. The red dash curve indicates the cutting frequency of the low-pass filter applied in the order domain. (Spectral resolution∆ f = 80 Hz)
gears are kept in the gearbox : one is engaged and the other one is maintained to produce rattle noise. The loose gear has been instrumented with an optical encoder in order to obtain an intrusive reference to detect impacts by observing relative velocity between the pinions of the unloaded meshing gear. The OFSCoh has thus been applied on accelerometric and IAS signals. Detection and quantification of rattle noise on the vibration signal and on the IAS signal of the secondary shaft turn out to be quite similar. They show a good agreement with the reference results obtained with intrusive measurements. On the other hand the detection with the IAS signal of the primary shaft has shown to be hidden by high levels of whine noise. The proposed method has also been verified to provide superior results than a kurtosis-based method.
In this work the measurements have been realised on a real automotive gearbox driven by an electrical motor. In perspective some measurements will have to be realised on a powertrain test bench where the gearbox is then coupled to a combustion engine.
Acknowledgements
This work, part of a PhD thesis granted with the CIFRE program (ANRT), was supported by PSA Peugeot Citro¨en within the framework of the OpenLab ”Vibro-Acoustic-Tribology@Lyon” and was also performed within the frame-work of the LabEx CeLyA (”Centre Lyonnais d’Acoustique”, ANR-10-LABX-60).
References
[1] G. Weisch, W. Stucktschwaiger, A. A. de Mendonca, N. T. S. Monteiro, L. A. dos Santos, The creation of a car interior noise quality index for the evaluation of rattle phenomena. SAE Technical Paper 972018, pp. 1177-1182 (1997).
[3] G. Cerrato-Jay, J. Gabiniewicz, J. Gatt, D. Pickering, Automatic detection of buzz, squeak and rattle events. SAE Technical Paper 2001-01-1479 (2001).
[4] G. Lee, K. Kim, J. Kim,Development of an algorithm to automatically detect and distinguish squeak and rattle noises. SAE Technical Paper
2015-01-2258 (2015).
[5] J. Mason, P. Piiroinen, R. Wilson, M. Homer, basins of attraction in nonsmooth models of gear rattle, International Journal of bifurcation and chaos in applied science and engineering, vol. 19, pp. 203-224 (2009).
[6] Y. Kadmiri, E. Rigaud, J. Perret-Liaudet, L. Vary, Eperimental and numerical analysis of automotive gearbox rattle noise, Journal of Sound and Vibration 331, pp. 3144-3157 (2012).
[7] M.Y. Wang, R. Manoj, W. Zhao, Gear rattle modelling and analysis for automotive manual transmissions, in Proceedings of IMechE, vol. 215 Part D, pp. 241-258 (2001).
[8] G. Chauvineau, F. Thouverez, J.-P. Laine, F. Danes, A global approach in gearboxes rattle noise modeling, In proceedings of 20th International Congress on Sound and Vibration, Thailand, Bangkok (2013).
[9] P. Couderc, J. Callenaere, J. Der Hagopian, G. Ferraris, Vehicle driveline dynamic behaviour: experimenatation and simulation, Journal of Sound and Vibration, vol. 218(1), pp. 133-157 (1998).
[10] M. Barthod, B. Hayne, J.-L. T´ebec, J.-C. Pin, Experimental study of gear rattle excited by a multi-harmonic excitation, Applied Acoustics, vol. 68, pp. 1003-1025 (2007).
[11] J.-L. Dion, S. Le Moyne, G. Chevallier, H. Sebbah, Gear impacts and idle gear noise: Experimental study and non-linear dynamic model, Mechanical Systems and Signal Processing, vol. 23, pp. 2608-2628 (2009).
[12] Y. Li, F. Gu, G. Harris, A. Ball, N. Bennett, K. Travis, The measurement of instantaneous angular speed, Mechanical Systems and Signal Processing, vol. 19, pp. 786-805 (2005).
[13] Q. Lecl`ere, F. Girardin, D. R´emond, An analysis of instantaneous angular speed measurement errors, Proceeding of Surveillance 7, France, Chartres (2013).
[14] H. Andr´e, F. Girardin, A. Bourdon, J. Antoni, D. R´emond, Precision of the IAS monitoring system based on the elapsed time method in the spectral domain, Mechanical Systems and Signal Processing 44, pp. 14-30 (2014).
[15] G. Leprince, Pertes m´ecaniques par frottement et lubrification dans une boˆıte de vitesses, PhD Thesis, INSA de Lyon, France (2011) - In french.
[16] R.B. Randall, J. Antoni, S. Chobsaard, The relationship between spectral correlation and envelope analysis in the diagnostics of bearing faults and other cyclostationary machine signals, Mechanical Systems and Signal Processing, vol. 15(5), pp. 945-962 (2001).
[17] J. Antoni, F. Bonnardot, A. Raad, M. ElBadaoui, Cyclostationary modelling of rotating machine vibration signals, Mechanical Systems and Signal Processing, vol. 18(6), pp. 1285-1314 (2004).
[18] G. D’Elia, Z. Daher, J. Antoni, A novel approach for the cyclo-non-stationary analysis of speed varying signals, Proceeding of The 2010 Leuven Conference on Noise and Vibration Engineering (ISMA), Belgium, Leuven (2010).
[19] J. Antoni, N. Ducleaux, G. NGhiem, S. Wang, Separation of comubstion noise in IC engines under cyclo-non-stationary regimes, Mechanical Systems and Signal Processing, vol. 38, pp. 223-236 (2013).
[20] J. Antoni, D. Abboud, S. Baudin, Time-angle periodically correlated processes, Cyclostationarity : theory and methods. Lecture notes in mechanical engineering, Springer, pp. 3-14 (2014).
[21] D. Abboud,... A completer
[22] J. Antoni, Cyclic spectral analysis in practice, Mechanical Systems and Signal Processing, vol. 21, pp. 597-630 (2007).
[23] W. Gardner, L. Franks, Characterization of cyclostationary random signal processes, IEEE Transactions on Information Theory, vol. II-21(1), pp. 4-14 (1975).
[24] H. Andr´e, Z. Daher, J. Antoni, D. R´emond, Comparison between angular sampling and angular re-sampling methods applied on the vibration monitoring of a gear meshing in non stationary conditions, Proceeding of The 2010 Leuven Conference on Noise and Vibration Engineering (ISMA), Belgium, Leuven (2010).
[25] J. Urbanek, T. Barszcz, R. Zimroz, J. Antoni, Application of averaged instantaneous power spectrum for diagnostics of machinery operating under non-stationary operational conditions, Measurement, vol. 45, pp. 1782-1791 (2012).
[26] C. Capdessus, E. Sekko, J. Antoni, Speed Transform, a new time-varying frequency analysis technique, Advances in condition monitoring of machinery in non-stationary operations (CMMNO), Italy, Ferrara (2013).
[27] A. Napolitano, Generalized cyclostationary processes and spectrally correlated processes: two extensions of the class of the almost-cyclostationary processes, Proceeding of 9th International Symposium on Signal Processing and its Application, United Arab Emirates, Sharjah (2007).
[28] D. R´emond, Practical performances of high speed measurement or gear Transmission Error or torsional vibrations with optical encoders, Measurement Science & Technology, vol. 9(3), pp. 347-353 (1998).
[29] R.F. Dwyer, Detection of non-Gaussian signals by frequency domain kurtosis estimation, Proceeding of International Conference on Acoustic, Speech and Signal Processing, USA, Boston (1983).
[30] J. Antoni, R.B. Randall, The spectral kurtosis: application to the vibratory surveillance and diagnostics of rotating machines, Mechanical Systems and Signal Processing 20(2), pp. 308-331 (2006).
[31] P. Borghesani, P. Pennacchi, S. Chatterton, The relationship between kurtosis- and envelope- based indexes for the diagnostic of rolling element bearings., Mechanical Systems and Signal Processing 43, pp. 25-43 (2014).
[32] L. Renaudin, F. Bonnardot, O. Musy, J.B. Doray, D. R´emond, Natural roller bearing fault detection by angular measurement of true instan-taneous angular speed, Mechanical Systems and Signal Processing 24, pp. 1998-2011 (2010).

![Figure 6: PSD of the IAS obtained with optical encoders B (a) and C (b) (black) and quantization threshold for α = 0.1% (red dash curve) in the range [0-400] epr.](https://thumb-eu.123doks.com/thumbv2/123doknet/14380216.505865/13.892.121.769.172.409/figure-obtained-optical-encoders-black-quantization-threshold-curve.webp)