Publisher’s version / Version de l'éditeur:
Vous avez des questions? Nous pouvons vous aider. Pour communiquer directement avec un auteur, consultez la
première page de la revue dans laquelle son article a été publié afin de trouver ses coordonnées. Si vous n’arrivez pas à les repérer, communiquez avec nous à [email protected].
Questions? Contact the NRC Publications Archive team at
[email protected]. If you wish to email the authors directly, please see the first page of the publication for their contact information.
https://publications-cnrc.canada.ca/fra/droits
L’accès à ce site Web et l’utilisation de son contenu sont assujettis aux conditions présentées dans le site LISEZ CES CONDITIONS ATTENTIVEMENT AVANT D’UTILISER CE SITE WEB.
20th IAHR International Symposium on ice 2010 [Proceedings], 2010-03-01
READ THESE TERMS AND CONDITIONS CAREFULLY BEFORE USING THIS WEBSITE. https://nrc-publications.canada.ca/eng/copyright
NRC Publications Archive Record / Notice des Archives des publications du CNRC :
https://nrc-publications.canada.ca/eng/view/object/?id=b1962755-1534-4196-8124-0f4486bd2a56 https://publications-cnrc.canada.ca/fra/voir/objet/?id=b1962755-1534-4196-8124-0f4486bd2a56
NRC Publications Archive
Archives des publications du CNRC
This publication could be one of several versions: author’s original, accepted manuscript or the publisher’s version. / La version de cette publication peut être l’une des suivantes : la version prépublication de l’auteur, la version acceptée du manuscrit ou la version de l’éditeur.
Access and use of this website and the material on it are subject to the Terms and Conditions set forth at
Numerical rendition of ice crushing
20
thIAHR International Symposium on Ice
Lahti, Finland, June 14 to 18, 2010
Numerical Rendition of Ice Crushing
R.E. Gagnon Institute for Ocean Technology National Research Council of Canada St. John's, NL, Canada, A1B 3T5 [email protected]
Abstract
A numerical model for ice crushing has been constructed that takes into account the physical processes identified in many experimental studies. These include the presence and evolution of high-pressure and low-pressure zones, the rapid removal of ice through melting, and the transformation of relatively intact ice (high-pressure zone material) to low-pressure pulverized ice through the creation and shattering of spalls. The model produces cyclic sawtooth load events and pressure distributions that are roughly characteristic of observed ice behavior. The visual and quantitative results suggest that the physical principles incorporated in the model are correct. While still in the early stages of development, with refinements the model has potential for use in simulations of various ice/structure interaction scenarios.
1. Introduction
Due to the complexity of the problem and the wide variety of impact and crushing scenarios it is desirable to have reliable numerical simulations. Over a long period ice crushing has been studied by many researchers at lab and field scales, but considerable debate still persists regarding the interpretation of results. Generally speaking some features of the behavior of ice during crushing are universally accepted, such as the presence of high-pressure zones, however there are a few differing notions about what they are, and how they form and evolve. A proper numerical description would have to be founded on the basic physics of what is happening and furthermore be compatible with experimental observations. Here is presented a model for simulation, known as IceCrush, that incorporates physical principles derived from lab and field tests and that generates results that are consistent with experimental data in terms of load, contact pressure distribution and displacement time-series data. This paper therefore has a two-fold purpose, one is to demonstrate that the physical principles the model incorporates are likely correct, and that it provides a flexible numerical tool that can be readily used in simulations of ice-structure interaction, such as bergy bit / ship collisions.
2. Hardware and Software
The simulations were run on a Unix based ScyldTM Beowulf Cluster presently consisting of 45 CPU’s (AMD OpteronTM Processor 246). The software used was LS-DynaTM, that incorporates a number of contact algorithms and a large suite of material types that can be chosen for the interacting structures. AnsysTM was used for the modeling and generation of meshes for the study. It was found that the simulations ran faster as more CPU’s were used but that the speed gain with increase in CPU’s also tended to level off so that 12-15 CPU’s was deemed optimum.
3. Physical Principles Incorporated
The simulation model incorporates two fundamental characteristics of ice crushing behavior that have been observed in numerous lab and field experiments (e.g. Gagnon, 1991; Gagnon, 1994; Gagnon, 2008; Gagnon and Sinha, 1991). The first is rapid melting on relatively intact regions of ice commonly known as hard zones. The second feature is spalling behavior that significantly influences the size and shape evolution of hard zones during crushing. The shattered spalls provide the bulk of the crushed material, mixed with liquid produced in hard zones, and also produced at ice-ice contact between particles in the conglomerate, that typically surrounds hard zones and is greater in areal extent. Pressure in hard zone regions is high (20-70 MPa) whereas pressure in the crushed material varies depending on the thickness and level of confinement, but generally is in the 2-8 MPa range. The crushed ice, while ‘softer’ than hard zones does support some load due to its extent and apparently also provides some confinement for the ice in hard zone regions.
The rapid melting of ice mentioned above results from the viscous flow of melt liquid under high pressure that generates heat for further melting. The process has been described before (e.g. Gagnon, 1994). The thickness of the melt layer is very thin, on the scales of several microns, at least at small scales where measurements have been made (Gagnon, 1994). The combination of the melting and spalling phenomenon provides the mechanisms by which an object such as an indentor can penetrate into an ice surface and explains the characteristic sawtooth patterns that are typical of ice indentation (Gagnon, 1999). While having an understanding of these mechanisms is essential for modeling the problem numerically the details of incorporating the mechanisms are nevertheless challenging due to the differing scales at which they operate.
Spalling is a relatively large-scale behavior that in principle can be meshed with elements that are similar in size to those that compose the bulk model. On the other hand modeling a thin layer of flowing liquid within the same model is completely unwieldy since the mesh elements in the liquid would be microscopic in size. How then does one deal with the situation? The answer, at least in the present case, is to use a material that can be meshed with sensibly-sized elements and that can behave as a piece of ice that is melting from the top, without having to revert to modeling the actual layer of liquid. In numerical modeling vernacular the material that behaves this way is a hard crushable foam with Poisson’s ratio equal to 0.0. LS-Dyna has such a material (MAT_CRUSHABLE_FOAM, Material Type 63) in its suite of material models. Application of a pressure, prescribed by the user, on a block or layer of such foam that is rigidly supported from below causes it to irreversibly compress in the direction of the applied load as though it was ice melting from the top due to the aforementioned process of high-pressure viscous flow of melt. Other details are best described in the context of the numerical model itself (below).
4. Model Construction and Behavior of Components
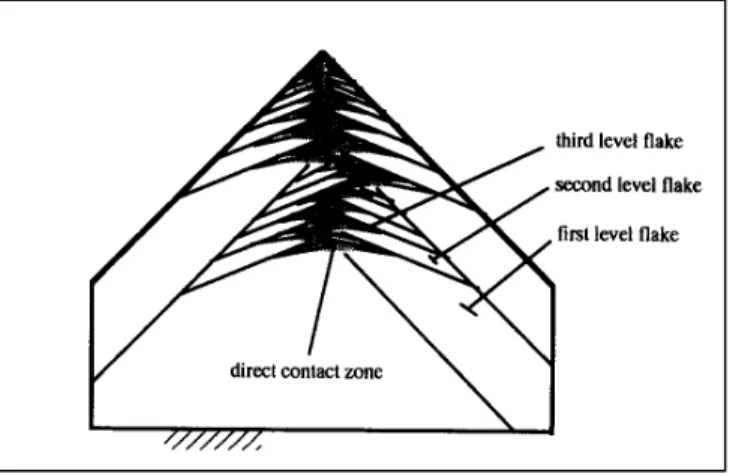
As a preamble to our model description we focus briefly on the topic of spalling. Figure 1 (Daley, 1992) shows a pyramid-shaped ice formation in 2-D and how the spall fractures might progress sequentially from top to bottom in an actual test, neglecting for the moment the mechanisms that enable the platen to progress through the remaining intact ice at each spall event. Daley recognized the importance of spalling (Daley, 1992; Daley, 1990) at around the same time that Gagnon and colleagues were reporting spalling observations from experiments in the lab and field (e.g. Gagnon, 1991; Gagnon and Sinha, 1991). Daley and Gagnon both realized the close association of spalling with the sawtooth load patterns that often developed in ice crushing experiments. And they discussed spall patterns and angular relationships (Daley, 1992; Gagnon, 1998). Spencer and Masterson (1993) also discussed the importance of spalling, as did Evans et al. (1984) in earlier work. Daley’s useful and in-depth 2-D analysis of fracture and spalling did not, however, provide the other physical mechanisms involved in the crushing process. Utilizing visual techniques and in-situ instrumentation Gagnon, in addition to documenting spalling, identified the mechanisms necessary to
explain the characteristics in load, displacement and pressure data observed in lab and field ice crushing tests (Gagnon, 1999). Hence, we can now present a full 3-D numerical rendition of ice crushing, where the material and transformative characteristics of the ice are incorporated that enable the physical mechanisms required for the penetration of the indentor into the ice before and during spall events. The model naturally exhibits the compliant and resonant behavior of the whole ice/indentor system.
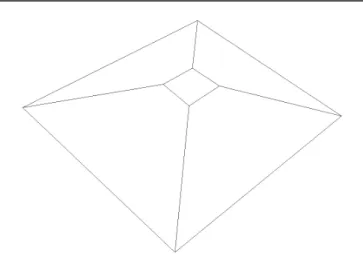
In the present simulation a pyramid-shaped ice formation, such as at Hobson’s Choice Ice Island during the 1990 experiments (Figure 2), is crushed by a heavy flat steel
Figure 1. A pattern of sequential ice fractures in a two-dimensional ice formation that is crushed by a plate (not shown) from the top. Each fracture produces a spall. (Drawing reproduced from Daley (1992)).
plate at the nominal rate of 100 mm/s to a depth of 10 cm. In principle we could mesh the whole ice formation and then, using complex and iterative stress analysis algorithms specify that a spall surface (i.e. a fracture to a free surface), such as any of the fractures in Figure 1, occurs when load is adequate to generate the required stress to create the fracture surface plane. As the depth of penetration increases the fracture surface
area rises quadratically (in 3-D) for the spalls having the same fracture angle, and the required load would rise accordingly. However, things can be greatly simplified, and the number of meshed elements greatly reduced, by modeling a portion of the full extent of the pyramid (Figure 3) and furthermore specifying that the spall events occur at fairly regular intervals as a function of depth of penetration into the ice. Other simplifications are that we used the same thickness for the planar spall slabs (described below) regardless of depth in the ice, and we gave all the spall fracture surfaces the same angle. Spall slabs that increase in thickness with depth, and that exhibit some variability in fracture angles, would be more realistic (Daley, 1992). In the simulation the number of spall layers that have been modeled and meshed essentially defines the number of spall events for the 100 mm penetration. This is another artificial construct and clearly more spall events, implying thinner and more numerous meshed spall layers, would be needed to achieve the Hobson’s Choice Ice Island test TFR4 number of spalls (Figure 4). That is beyond the scope of this early work but could be fairly easily implemented. Our goal here is to show the most important characteristics of the model and we leave a number of the refining aspects for future work. The intention is to show how the mechanisms involved can be handled numerically to yield the variety of behaviors underpinning the highly dynamic and complex phenomenon of ice crushing. When compared to characteristics seen in ice crushing in the lab and field the general features of the simulation are nevertheless compelling both visually and quantitatively,
Figure 2. Schematic of a truncated pyramid ice formation similar to the one that was crushed by a flat ‘rigid’ indentor during test TFR4 at Hobson’s Choice Ice Island, 1990. The nominal penetration rate for the Ice Island test was 100 mm/s and the penetration depth was approximately 170 mm. The sloping sides of the pyramid are tilted upwards by 18 degrees from the base.
Figure 3. View of the numerical model used for the simulation described in this paper. The model consists of many stacked triangular facets (described in greater detail below). The model represents the ice process surface during crushing. The base measures 1.47 m x 1.47 m.
in spite of these early stages of development. This demonstrates that the physical processes are fairly well understood in the first place and reasonably represented in the model.
Figure 5 shows the main component from the meshed model, the central building block, used in the simulations, hereafter referred to as a ‘facet’. It is triangular in shape and in this case is
two mesh elements thick. The facets are slightly angled upwards, by about 8 degrees, and this is an important aspect of the model as we shall see. Each of the facets will serve as a spall of ice, or portion thereof, in the model. In LS-Dyna each facet is a separate entity whose material properties, and contact characteristics with other parts it touches, must be assigned. In reality the fracture plane that creates a spall is likely curved (Gagnon, 1998) so the facet shown in Figure 5 is a simplification. A sectional view of the fully meshed model is shown in Figure 6. It is composed of several of the facets shown in Figure 5. Note that the model has four sides because in this case we are modeling a pyramid-shaped ice formation. The method is flexible, however, and other ice formation shapes, such as a wedge or an ice sheet edge could be modeled in a similar manner as the present model but with different shaped facets and differing overall assembly. This is left for future work. There are six
layers of the thin facets in the model. Each of these layers consists of four facets, one for each quadrant. The six layers have been assigned ice characteristics and the thicker bottom layer has been assigned immovable rigid body characteristics, i.e. to approximate the virgin intact bulk ice that supports the stack of facets above it. Hence the simulation was run using essentially six active layers, where in fact only the first three layers experienced spall behavior, that is, fracture-induced separation. The other three active layers were present to demonstrate that the processes involved could have carried on to create more spalls had there been a greater depth of penetration of the crushing plate. The shape of the model top is very important (Figure 3). We noted the angle of about 8 degrees. A key point is that the model is showing the shape of the ice once some crushing has already occurred,
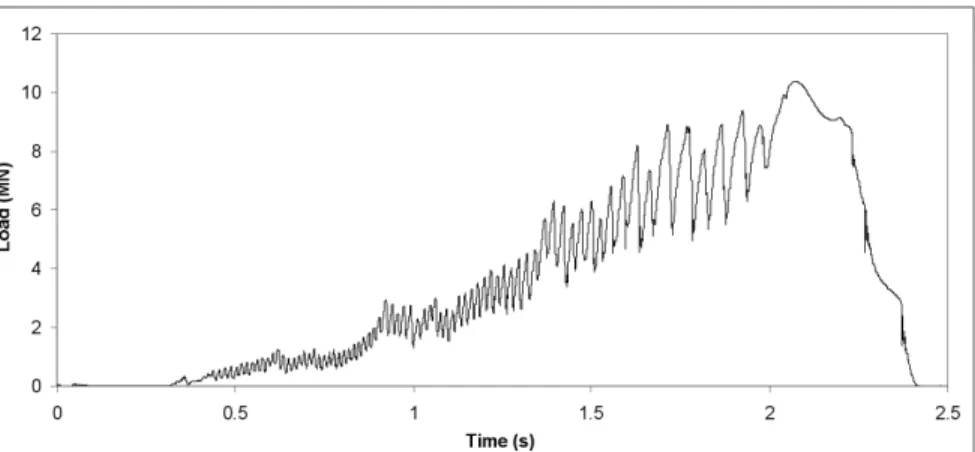
Figure 4. Load record for ice crushing test TFR4 conducted at Hobson’s Choice Ice Island in 1990. The ice formation had a truncated pyramid shape. The record shows a typical sawtooth pattern where each sharp drop in load corresponds to a spalling event (Gagnon, 1998).
Figure 5. View of a meshed triangular facet, the central component of the numerical model. The facet is two elements in thickness. The actual thickness of the facet in the vertical direction with respect to the full model (Figure 3) is 0.04 m.
i.e. it shows the ice process surface. Studies (Gagnon, 1998; Daley, 1992) show the angle for spalling that occurs in the ice is, for the most part, less than the original face angles of the ice mass. The process surface shape is, however, influenced by the original shape of the ice due to geometry-related confinement effects. This is a complex topic that is outside the scope of this paper. Here we deal only with the relatively simple pyramid geometry where test data has yielded some information about actual spall shapes (Gagnon, 1998) and some of the influences of the original ice formation shape are available (Spencer and Masterson, 1993). The following method is used to enable the transition that occurs when solid intact ice transforms into a shattered spall. The top six layers visible in Figures 3 and 6 appear to
number 24 facets when in fact there are two sets of distinct and overlapping layers, that are occupying the same space, totaling 48 facets. One set of layers has a high-stress crushable foam property, hereafter referred to as M1 (upper curve in Figure 7). Also occupying the same space (in computer terms) is the other set of six layers, these having the lower-stress crushable foam property M2 (lower curve in Figure
7). The combined properties of the M1 and M2 overlapping layers represents the physical strength and behavior of intact hard zone ice that rapidly melts from the top in response to high pressure (see process described by Gagnon (1994)). When only the M2 material layer(s) is present, that is, following a spalling event, the layer represents the shattered and pulverized ice that the spall has ‘instantly’, i.e. one CPU time step, transformed into. The overlapping layers do not interact with each other, however, they do interact with the crushing plate above and the supporting ice below. In other words, both types of layers exert a force on the crushing plate and supporting ice. When the plate contacts and loads the ice it applies force to both types of facets if both
Figure 6. A sectional view of the fully meshed model. Six layers of thin facets, with differing colors, are shown sitting on top of one layer of thick facets that forms the base.
Figure 7. Stress versus volumetric strain curves for the M1 (high-stress) and M2 (low-stress) crushable foam facets that are used in the simulation. Where M1 and M2 facets overlap in the region of ice contact at the ice-structure interface their combined stress behavior corresponds to hard-zone, relatively intact, ice. In regions where only M2 facets are present at the ice-structure interface, those areas correspond to crushed ice.
are present. Both have crushable foam properties, so the hard zone that forms from the flattening facets in the contact zone has a pressure distribution defined by the sum of the two curves, although clearly the most significant contribution is from the high-stress curve M1. The ice load builds up to a point where a fracture initiates that separates one piece of virgin ice (a spall) from the bulk piece, typically half of the contact area. In our simulation described below it will be observed that the first spall to form is comprised of two of the four top facets in Figure 3. In an actual spalling event the separated piece would shatter and become crushed ice. In the simulation this is done by having the hard (M1) overlapping ice piece completely lose its contact with all attached ice and the plate, i.e. it disappears, leaving the softer (M2) overlapping piece occupying the same space in the contact zone and with material properties of crushed ice.
When a spalling event occurs, for example, when an overlapping pair of M1 and M2 facets, or multiple sets of facets, in the contact zone transforms from intact to shattered ice, there is a drop in the load exerted by the ice on the crushing plate that causes an abrupt forward movement of the plate on the remaining ice. This is due to the reduction of hard-zone and/or soft-zone contact area. This is physically and numerically enabled by the rapid melting of ice on the remaining hard-zone portion and further compression/extrusion of the soft-zone ice if present (see walk-through below). With the continuing movement of the crushing plate ice load accumulates again and the hard-zone and soft-zone contact areas grow in size to an extent that is generally greater than they were previously until the next fracture and spall event occur. Hence, over multiple spalling events, and increasing depth penetration, the general trend is for an average increase in hard-zone and crushed-zone size so that the load generally increases, as intuitively expected. In real ice the number of spalling events for a given penetration ultimately depends on the fracture toughness of the ice, the geometry of the original ice and inherent flaws and non-uniformities that may lead to fracture. To reiterate, for the pyramid shape the fracture surface area required for spalls grows quadratically as the penetration increases. Hence the general trend is that the load required to initiate spalls successively deeper within the ice increases quadratically with depth, assuming the same spalls angles apply. A further note is that since the crushing plate loading system and virgin ice are elastic entities the time interval between load drops will increase as load peaks increase for successively greater depths of penetration, as observed in various experiments (e.g. Gagnon, 1998).
5. Simulation Walk-Through
Figure 8 shows the load record from the IceCrush simulation. Figure 9 shows two sets of images depicting what happens during a spalling event. Figure 10 shows larger, more legible, views of the colored stress scales on the images for the reader’s convenience. Each of the two image sets in Figure 9 shows three vertically-stacked images. Only the top three layers of active facets are depicted in each image. Sectional views are shown for the middle and upper images to help with the description. Recall that each facet is two mesh elements in thickness. In the model the full stack of 6 active facet layers of M1 and M2 materials initially occupy the same space but as the crushing progresses, and some facets disappear, the relative overlap of facets within the stacks varies. Space does not permit a suite of several image sets, spanning the full simulation, that would be needed to illustrate the variety of complex processes that occur during ice crushing, as observed in nature, that have been included in the simulation.
The thick massive plate that crushes the ice from the top is not shown for illustrative purposes. The plate was 3.2m x 3.2m x 0.6m, and had a density of 2000 kg/m3. Its Young’s modulus was
100 GPa and Poisson’s ratio was 0.3. Its corners moved at a fixed speed of 100 mm/s during the crushing test. Essentially the plate represents a fairly massive elastic structure with realistic inertial and flexural properties. As mentioned above the test duration was set to be 1.0 s. Six spalling events were incorporated into the model and had been specified to occur at fairly regular and generally increasing time intervals according to the strategy discussed above, that is, at 0.2 s, 0.3 s, 0.45 s, 0.62 s, 0.8 s and 0.95 s.
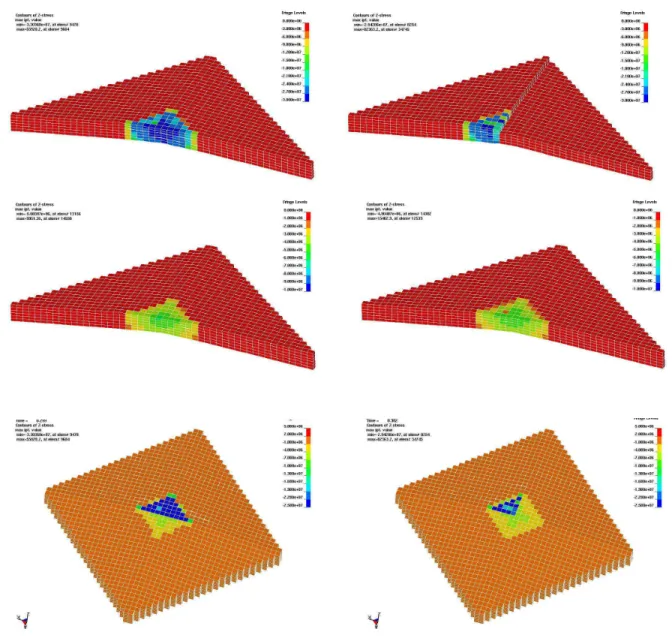
The top image of each image set in Figure 9 represents the high-stress M1 material. The middle image represents the lower-stress M2 material, and the bottom image shows the result when the two materials (M1 and M2) are combined as they are in the IceCrush simulation. Recall that the hard-zone property is exhibited by the combined behaviors of M1 and M2 facets where they overlap in the contact region, whereas the M2 material by itself represents crushed ice. The points at which each of the two image sets occur in the load history of the simulation are included as numbered markers in Figure 8. Figure 9 highlights the second spalling event on the load record but also has information concerning the first event that occurred at time 0.200 s. Image set #1, at time 0.299 s, was taken about 0.1 s after the first spalling event occurred. The top and middle images show the stress in both materials that, when combined, correspond to the pressure distribution exerted by the ice on the plate (bottom image) at the ice/plate interface. Note that only two of the four quadrants comprising the ice process face are shown in the middle and top images so that the viewer can see a section through the contact zone. The first spalling event essentially cut the contact region in half. This was accomplished by having two of the triangular facets, the lower ones visible only in the bottom image of image set #1, loose their M1 high-stress property leaving only the crushed ice property M2. By the time image set #1 occurred the remaining high-stress zone, and the crushed-ice zone that is the spall remnant, had expanded in size somewhat due to the penetration of the plate and geometry of the ice. The top and middle images of image set #1 show the M1 and M2 components for the remaining hard-zone ice from the first spall event. As mentioned, the first ice spall occurred on the lower half of the bottom image so it isn’t visible in the upper images. The dark blue region, corresponding to high pressure, is the hard-zone ice. The spall that separated from the bulk ice has transformed into lower-pressure crushed ice, as seen in the lower half of the contact zone as yellow/green in the bottom image. The second spalling event is about to happen.
Figure 8. Load time series for the IceCrush simulation. Numbered markers (solid circles) indicate the points on the record corresponding to the two sets of images comprising Figure 9 that show details of the model before and after a spalling event.
Image set #2 shows the details of how a spall forms since it occurs in the two quadrants that have been illustrated in the middle and upper images. Image set #2 corresponds to a time very shortly after the second spalling event, at time 0.302 s. The top image shows that the top triangular facet on the right side has gone from view since it effectively ‘disappeared’ when it separated from the bulk ice, that is, its numerically defined contact algorithms for ice contact and plate contact
Figure 9. Two sets of images, set #1 (left) and set #2 (right), depicting what happens during one of the spalling events in the IceCrush simulation. Each of the two image sets shows three vertically-stacked images, where the top image corresponds to M1 facets, the middle image corresponds to M2 facets and the bottom image corresponds to the combination of the M1 and M2 facets. Only the top three layers of the active facets are depicted in each image. Sectional views are shown for the middle and upper images to help with the description. The times corresponding to the image sets are indicated with numbered markers on the load history for the simulation (Figure 8).
‘died’, in LS-Dyna terminology. So no force is exerted by the facet on anything. Hence the top image shows a space where the top M1 facet was. The middle image, however, does show the crushed ice facet that occupies roughly the same space as the facet that ‘died’ in the top image. Hence the ‘combined’ properties of both facets in the contact zone now shows only the crushed ice facet property (bottom image), i.e. the ice spall has transformed from intact ice (combined M1 and M2 properties) into crushed ice (low-stress property M2). From viewing the bottom images in image sets #1 and #2 we see that half of the hard-zone contact area has transformed into crushed ice. The load drop associated with this can be seen in Figure 8.
Analysis of the full simulation (not included here due to space limitations) shows that the relative contributions of load from the high-pressure and low-high-pressure ice contact areas is subject to considerable variation, as has been observed in nature. On average, however, both
hard-zone and crushed-zone areas increase in extent with penetration.
6. Summary of the Observed Features of the Simulation
The simulation, while crude, nevertheless exhibits many of the characteristics that are observed in field and lab experiments. Load drops are prominent and are the direct result of spalling events (i.e. the classic sawtooth pattern, such as in Figure 4). Load drops are roughly a half to a third the load magnitude just prior to the load drop. High-pressure hard zones (melting intact ice) surrounded by low-pressure soft zones (shattered spalls and pulverized ice) are seen. Sharp changes in pressure at hard-zone / crushed-zone boundaries are present. Instances of fresh undamaged ice (hard-zones) pushing up through damaged ice (soft-zones) as crushing progresses is evident in the full simulation (not included here). Intermittent movement of the crushing plate towards the ice, that is, relatively slow movement between spall events and abrupt fast movements at spall events are evident that are similar to physical experiments (Gagnon, 1999). The elastic response of the crushing plate / ice system is furthermore evident in the resonant oscillations seen at the bottoms of the load drops (Figure 8) and in the displacement record of the central region of the crushing plate, similar to actual experiments (e.g. Gagnon, 2008). In addition, the expected general increase in contact area for soft and hard zones as the penetration progresses, with consequent general increase in load, is evident. Furthermore the spalls are a significant portion of the ice contact area and their inner extent passes through the center of the contact zone, as frequently observed in real experiments (e.g. Gagnon, 2008).
Finally, the shape of the original ice influences confinement characteristics that in turn influence the shapes and locations of spalls. This ultimately leads to patterns of ice contact, such as the ‘X’ pattern that was evident in the Ice Island experiment TFR4 (Gagnon, 1998). The simulation
Figure 10. Z-stress color scales for the image sets in Figure 9. The positive z-axis is upwards and aligns with the central axis of the model and is normal to the crushing plate. The left, center and right color scales correspond to the top, middle and bottom images of each image set. The unit on each scale is Pa.
showed evidence of an ‘X’ pattern in the early stages (not included here), but this did not persist because of the highly-simplified spall shapes.
7. Further Considerations
We note that ideally a perfect simulation of ice crushing would determine exactly where, when and with what shape every spall was created in addition to having the capability to reproduce the other complex crushing behaviors discussed above. Software with such capability and accuracy does not yet exist, although we have shown that the physical processes are fairly well understood and have demonstrated one strategy, at least, for incorporating them. Progress is being made on other remaining key issues such as numerically tracking fractures in ice (e.g. Kolari et al., 2009). In the meantime, while recognizing that spalling behavior is complex, we can nevertheless say that spalling events occur fairly regularly in continuous crushing and that the number of events is a function of the geometry of the ice and the depth of indentation/penetration. Hence, it may not be unreasonable to forgo the computationally expensive process of determining exactly when and where spalls occur and what shapes they have, either directly within the simulation or in prior elastic stress simulations using fracture toughness criteria and critical stress analysis within the ice. By specifying that the spalls will occur at fairly regular intervals of depth of penetration and giving them the best shapes that can be estimated from the original ice geometry, and whatever visual data that is available, a realistic sequence of events and load history can be generated.
8. Suggestions for Use of the Model for Impact Simulations
In the case of continuous penetration crushing at a given rate, such as the Ice Island tests in 1990, the penetration as a function of time is known beforehand. This permits the user to assign whatever number of spalls that may be desired for a given depth of penetration.
On the other hand, in the case of an ice/structure impact scenario we suggest the following three-stage method to make the best use of the spalls that the user may have incorporated in the geometry of their model. Consider an ice mass of relatively large extent compared to the modeled portion that is actually crushed against a structure, such as a bergy bit colliding with a ship. The ice process surface model can be attached to the simply-modeled bulk ice mass at the location where the impact will occur. One has to get some idea of the duration of the impact, and the final depth of penetration, in order to assign times, or alternatively depths of penetration, when the spalling events will occur. For the given impact scenario, first a simulation can be run where no spall events are allowed to occur and where all of the ice process surface model behaves as hard- zone ice. This will yield a minimum possible impact duration and penetration depth. Next, a second simulation is run with the same parameters and where now only the M2 facets are active, that is, the model behaves as crushed ice. This will yield an impact duration and penetration depth that will approximate the longest possible duration and greatest depth of penetration. One can then choose an impact duration and penetration depth that is intermediate between these lesser and greater values and use this to assign spall event times that distribute the number of spalls they have in their model fairly uniformly throughout the range of penetration depth available.
9. Conclusions
A numerical simulation method for ice crushing, known as IceCrush, has been presented. It incorporates physical processes and geometrical characteristics that have been identified in field and lab experiments. This is the first model to incorporate complex spalling behaviour. The
model is by no means complete, since various aspects need refinement, such as the issues associated with spall shapes, sizes and frequency. The model results exhibit actual characteristics of ice crushing that demonstrate that the physical processes incorporated are probably correct. Depending on the particular interest of a user, the numerical modeling technique can be used judiciously to study the behavior of structures in response to ice impacts and indentation where all known ice crushing behaviors, to varying degrees of refinement, are taken into account.
10. Acknowledgements
The author would like to thank the Program of Energy Research and Development (PERD), Transport Canada and IOT for their support of this research.
11. References
Daley, C.G., 1990. Ice edge contact - An iterative failure process model. Report from Finnish-Canadian Joint Research Project No. 5, Ships interaction with actual ice conditions, Otanieme, 1990/M-103.
Daley, C.G., 1992. Ice edge contact and failure. Cold Regions Science and Technology, 21 (1991) 1-23.
Evans, A.G., Palmer, A.C., Goodman, D.J., Ashby, M.F., Hutchison, J.W., Ponter, A.R.S., Williams, G.J., 1984. Indentation spalling of edge-loaded ice sheets. Proceedings of IAHR 1984, Hamburg, 113-121.
Gagnon, R.E., 1991. Heat Generation During Crushing Experiments on Freshwater Ice. Proceedings of the VIIIth International Symposium on the Physics and Chemistry of Ice, Sapporo, PCI-91.
Gagnon, R.E., 1994. Melt Layer Thickness Measurements During Crushing Experiments on Freshwater Ice. Journal of Glaciology, Vol. 40, No. 134, 119-124.
Gagnon, R.E., 1998. Analysis of Visual Data from Medium Scale Indentation Experiments at Hobson’s Choice Ice Island. Cold Regions Science and Technology, Vol. 28, 45-58. Gagnon, R.E., 1999. Consistent observations of ice crushing in laboratory tests and field
experiments covering three orders of magnitude in scale. Proceedings of the 15th International Conference on Port and Ocean Engineering under Arctic Conditions, 1999, POAC-99, Helsinki, Finland, Vol. 2, 858-869.
Gagnon, R.E., 2008. High-Speed Imaging of Mechanisms Responsible for Sawtooth Cyclic Loading During Ice Crushing. Proceedings of IAHR 2008, Vancouver, Canada.
Gagnon, R.E., Sinha, N.K., 1991. Energy Dissipation Through Melting in Large Scale Indentation Experiments on Multi-Year Sea Ice. Proceedings of the 10th International Conference on Offshore Mechanics and Arctic Engineering, Stavanger, Vol. 4: Arctic/Polar Technology, 157-161.
Kolari, K., Kuutti, J.,Kurkela, J., 2009. Fe-Simulation of Continuous Ice Failure Based on Model Update Technique. Proceedings of POAC 2009, Lulea, Sweden.
Spencer, P.A., Masterson, D.M., 1993. A geometrical model for pressure aspect-ratio effects in ice-structure interaction. Proceedings of the 12th International Conference on Offshore mechanics and Arctic Engineering, OMAE 1993, Vol. 4, 113-117.