HAL Id: hal-00019737
https://hal.archives-ouvertes.fr/hal-00019737v2
Submitted on 27 Feb 2006
HAL is a multi-disciplinary open access
archive for the deposit and dissemination of
sci-entific research documents, whether they are
pub-lished or not. The documents may come from
teaching and research institutions in France or
abroad, or from public or private research centers.
L’archive ouverte pluridisciplinaire HAL, est
destinée au dépôt et à la diffusion de documents
scientifiques de niveau recherche, publiés ou non,
émanant des établissements d’enseignement et de
recherche français ou étrangers, des laboratoires
publics ou privés.
Astrocladistics: a phylogenetic analysis of galaxy
evolution II. Formation and diversification of galaxies
Didier Fraix-Burnet, Emmanuel Douzery, Philippe Choler, Anne Verhamme
To cite this version:
Didier Fraix-Burnet, Emmanuel Douzery, Philippe Choler, Anne Verhamme. Astrocladistics: a
phy-logenetic analysis of galaxy evolution II. Formation and diversification of galaxies. Journal of
Classi-fication, Springer Verlag, 2006, 23, pp.57-78. �10.1007/s00357-006-0004-4�. �hal-00019737v2�
ccsd-00019737, version 2 - 27 Feb 2006
2006 Journal of Classification, 23 (Original publication available at http://www.springer.com)
Astrocladistics: a phylogenetic analysis of galaxy evolution
II. Formation and diversification of galaxies
Didier Fraix-Burnet
Laboratoire d’Astrophysique de Grenoble, France ,
Emmanuel J.P. Douzery
Laboratoire de Pal´eontologie, Phylog´enie et Pal´eobiologie,
Institut des Sciences de l’ ´
Evolution de Montpellier, France,
Philippe Choler
Laboratoire d’ ´
Ecologie Alpine, Grenoble, France, and
Anne Verhamme
Laboratoire d’Astrophysique de Grenoble, France
Abstract. This series of papers is intended to evaluate astrocladistics in reconstructing phylogenies of galaxies. The objective of this second paper is to formalize the concept of galaxy formation and to identify the processes of diversification. We show that galaxy diversity can be expected to organize itself in a hierarchy. In order to better understand the role of mergers, we have selected a sample of 43 galaxies from the GALICS database built from simulations with a hybrid model for galaxy formation studies. These simulated galaxies, described by 119 characters and considered as representing still undefined classes, have experienced different numbers of merger events during evolution. Our cladistic analysis yields a robust tree that proves the existence of a hierarchy. Mergers, like interactions (not taken into account in the GALICS simulations), are probably a strong driver for galaxy diversification. Our result shows that mergers participate in a branching type of evolution, but do not seem to play the role of an evolutionary clock.
Key words.Cladistics – Galaxies: fundamental parameters – Galaxies: evolution – Galaxies: formation – Methods: numerical
Anne Verhamme is now at Geneva Observatory, Switzerland. First author’s address: Laboratoire d’Astrophysique de Grenoble, BP 53, F-38041 Grenoble cedex 9, France, email: [email protected]. Supplementary material (numerical tables and character projections) is available on http://hal.ccsd.cnrs.fr/aut/fraix-burnet or http://www-laog.obs.ujf-grenoble.fr/public/fraix.
1. Introduction
When Hubble discovered the true nature of galaxies in 1922 (Hubble 1922), galaxy diversity was limited to morphological dif-ferences and four types were enough to describe these new objects. Nowadays, galaxies are known to be complex and diversity is exposed through characteristics of numerous observable parameters. Physics and chemistry of the basic constituents (stars, gas and dust, see Paper I) and their interactions have been observed and modelled (Vilchez, Stasinska and Perez 2001, Sauvage, Stasinska and Schaerer 2002, Hensler, Stasinska, Harfst, Kroupa, and Theis 2003). The traditional, ever revised, Hubble clas-sification (Hubble 1926, Hubble 1936, de Vaucouleurs 1959, Sandage 1961, Roberts & Haynes 1994, van den Bergh 1998) is no longer suited to encompass all this variety, notably at high redshifts where galaxies do not look like those in our neighbour-hood (e.g. van den Bergh 1998). In addition, numerical simulations somewhat enlighten the interplay between all constituents of galaxies and some of their behaviour with time (Hatton, Devriendt, Ninin, Bouchet and Guiderdoni 2003, Bournaud , Combes and Jog 2004, Menci, Cavaliere, Fontana, Giallongo, Poli and Vittorini 2004). However, because of galaxy complexity, they are necessarily incomplete, in particular concerning morphological aspects, so that the inadequate classification makes a comparison between simulated and true samples difficult.
In 1936, Hubble imagined that galaxies should evolve (Hubble 1936). In this way, he explained the origin of spiral galaxies as being relaxed ellipticals. While galaxy evolution is now universally recognized, historical scenarios as well as formation and nature of the very first objects are far from being established (e.g. Bromm, Ferrara, Coppi and Larson 2003, Bromm and Loeb 2003, Schneider, Ferrara, Natarajan and Omukai 2002). It is often understood that the formation of a galaxy deals only with its first appearing in the Universe as an entity and that afterwards it evolves with more major or less major modifications. We believe that this definition of formation is not adapted to a diversity generated in the course of evolution. This concept should be formalized more clearly when dealing with phylogeny (“species evolution”) of galaxies (see Sect. 2.2).
To address these two questions (classification and formation – evolution), Fraix-Burnet, Choler and Douzery (2003) proposed to use cladistics, a methodology borrowed from evolutionary biology (see also Fraix-Burnet 2004). In the present two companion papers, we detail the fundamentals of astrocladistics. The first paper (Paper I) concentrates on the applicability of cladistics to objects like galaxies, emphasizing also the practical course of the analysis. Readers are referred to this paper for principles and more details of cladistics. The present second paper is devoted to a conceptualization of the formation and evolution of galaxies as a whole, that is required to understand the organization of their diversity. We also analyse a sample of simulated galaxies in order to study the specific role of mergers.
In this paper as in Paper I, we use the word “class” in a generic manner, and avoid the word “type” because it is inevitably linked to a Hubble morphological classification. We also make the one object – one class assumption which means that an individual galaxy of the simulation is supposed to be generic for a class. This has the advantage of more generality because even though with our sample of simulated galaxies we are able to identify the fate of a galaxy at different epochs, this is not possible with real objects. Like in Paper I, we do not yet specify any distinction between “class” and “species” for galaxies.
In Sect. 2, we present some general concepts of evolution, and detail the formation and diversification processes for galaxies. The selection of the sample of simulated galaxies is described in Sect. 3 and the analysis inputs are listed in Sect. 4. Results are presented in Sect. 5, while a discussion can be found in Sect. 6. The conclusions are given in Sect. 7.
2. Formation, diversification and hierarchy 2.1. Descent with modification
The hierarchical organization of the diversity of living organisms is an empirical result found already at the time of Aristotle, and thoroughly established in the 18th century when the - now universal - Linn´e nomenclature came into use (Knapp 2000, Paper I). Darwin (1859), in his theory of evolution, explained this tree-like structure by a descent with modification process: each organism transmits its characteristics to a descendant with or without modification. Descent explains pattern similarity while modification explains pattern differences. Because these modifications can be numerous for such complex systems, a given species generally evolves into several new species. This is called branching evolution and cladistics is designed to find such hierarchies (Hennig 1965, Wiley, Siegel-Causey, Brooks and Funk 1991, see Paper I).
In the biological world, another component of evolution tends to alter the tree-like structure. In some cases, genes are directly transmitted from one organism to another, creating a hybrid organism with characteristic patterns of both original species. This is called reticulated evolution because on a tree it would appear as a junction between two different branches (e.g. Woese 2000, Legendre 2000). When branching evolution is dominant, reticulated evolution brings some noise in the cladistic analysis and hybridization events can be identified. The situation is more difficult when the reverse is true, as seems to be the case for bacterial evolution (Doolittle 1999).
It is important to point out that classification here does not concern individual objects but species (Wiley et al. 1991). A chimpanzee does not evolve into a human, but both species have a common ancestral species (often simply called ancestor). In biology, a given species slowly evolves through many generations of individuals. Differences are tiny at each generation, but after a while new individuals depart significantly enough for a new species to be defined. The notion of species is not unique and is not defined only by interbreeding (see Brower 2000 and some references therein). For instance, it can be defined from cladograms,
assembling
secular evolution
interaction
accretion-merging
ejection-sweeping
Transmission Modification Formation Ancestral
class
Descendant class
Diversification
Fig. 1. Formation processes of galaxies (left) and diversification scheme (right).
that is from trees produced by a cladistic analysis, in which case it is coined a ’clade’. As explained in Paper I, objects thus grouped share a common ancestor which has transmitted its evolved (’derived’) characteristics (innovations of evolution).
In astrophysics, as will be seen in Sect. 2.3, the evolutionary process is much more spectacular. The term ’progenitor galaxies’, often used, means in reality ’progenitor class to a given class of galaxies’. This point, very important for astrocladistics, is also discussed and illustrated in Paper I, and formalized further in Sect.2.2.
2.2. Formation of galaxies
It is often implicitly admitted that a galaxy forms at an early epoch of the Universe and evolves to the present time (e.g. Steidel 1999). In other words, “formation” and “evolution” are disconnected. However, we are interested in understanding how galaxies happen to be as we see them, that is how they formed themselves into the way they are in our data. As already mentioned, we are concerned with the class a given galaxy represents rather than with the individual by itself. Hence, any process affecting some properties of a galaxy is a formation process. In this sense, formation is to be understood as formation of a given class of galaxies. Five processes that change galaxy characteristics can be identified:
1. Even though the nature of the very first objects is still under debate (e.g. Bromm et al. 2003, Bromm & Loeb 2003, Schneider et al. 2002), some basic constituents (stars, gas and dust, see Paper I) assembled themselves in a self-gravitational entity called a galaxy. This simple scheme renders possible the appearing of a new galaxy at any epoch of the Universe.
2. Galaxies live in an environment made up of gas and a gravitational field shaped by dark matter and other galaxies. However, for a given period, a galaxy can be isolated or located in a stable environment. Yet, as shown in Paper I, its basic constituents (mainly stars, gas and dust) evolve, hence the galaxy evolves. For instance, if a sufficient number of supernovae explode, the global metallicity of the intragalactic gas is increased, so that a new class of galaxies could be defined. Even though this secular evolution is less spectacular than the four other ones, it is undoubtedly a formation process as well. In Paper I, it is shown that secular evolution alone yields diversity organized in a hierarchy.
3. Interactions between galaxies (or between a galaxy and any gravitational perturbation) are probably very frequent, and gener-ally very violent (e.g. Menci et al. 2004). Internal kinematics is necessarily affected, triggering starbursts, chemical reactions in the gas and dust, structural and morphological changes, nuclear activity, feeding of black holes, and so on. After an in-teraction, a galaxy is certainly different, belonging to a new class, so that interactions are a formation process and a strong driver of diversity.
4. Sometimes, the consequence of an interaction is merging. For instance, in the case of the merging of two spiral galaxies with comparable masses giving birth to an elliptical galaxy, two galaxies obviously disappear and a new one, very different, is born. Such major merger events clearly constitute a formation process. If the masses are very different, we could consider that only the small galaxy has disappeared, eaten or accreted by the bigger one. But still, the latter is modified (at least its mass has increased, but other characteristics are probably modified as well) and could lead to the definition of a new class of galaxies. These minor mergers can be viewed as accretion, like that of intracluster gas or whatever. We consider the accretion-merging formation process globally and discuss it in more detail in Sect. 2.4.
5. Ejection or sweeping of material from a galaxy is just the opposite phenomenon to accretion-merging, less violent in general however, and is similarly a formation process.
These five formation processes: assembling, secular evolution, interaction, accretion-merging, ejection-sweeping are depicted in Fig. 1. This makes it clear that galaxies are always formed from material coming from other galaxies or from the intergalactic medium. In all cases, the building blocks have their own history, they have evolved themselves. Formation necessarily includes evolution, even in the extragalactic world. Stellar astrophysicists are used to this kind of transmission to a new generation or to a new class of objects. There are several populations of stars, the more recent (containing more metals) being made up of material processed in stars of the previous population and ejected in the interstellar medium. In the case of galaxies, this mechanism is reminiscent of the “descent with modification” of the Darwinian evolution: basic constituents of galaxies are transmitted, and modified through the five formation processes, to a newly formed descendant.
2.3. Diversification of galaxies
After a galaxy of a given class appears, it is affected by one of the processes stipulated above, then yields a descendant that belongs to a new or the same class. This is very different from species evolution in biology as already said in Sect. 2.1 because this happens only very gradually after a large number of generations. However, very rarely, some individual living organisms have to give birth to descendants of a different species. For galaxies, an individual can be so much transformed by processes identified in Sect. 2.2 that a new galaxy belonging to a different class is formed. The diversification cycle is then at work (see Fig. 1). The goal of a phylogenetic analysis of galaxy evolution like astrocladistics is to classify galaxies according to their history of formation processes. An observed galaxy is the result of several formation events, and the analysis should later be able to establish whether the order in which of they have occurred matters or not.
It is important not to be confused between number of classes (diversification) and number of galaxies. Even if gravity tends to diminish the total number of galaxies through mergers, diversification (i.e. number of different classes of objects) increases because galaxies are complex objects: four perfectly identical galaxies merging by pairs will yield two objects certainly different from each other and from the original ones. Even if at the very last we end up with one object, it will characterize a new class, making altogether four classes in this simple example. Hence diversification still occurs even if the Universe should finish in a Big Crunch (but this does not seem to be the case: Benoit et al. 2003, Spergel et al. 2003).
One necessary condition for diversification to occur in a “descent with modification” scheme is that the number of generated species be sufficient. This is probably not the case for stars. But among the galaxy formation processes identified above, assem-bling is the rarest of all, appearing only once for any full lineage of galaxies. Its time scale can thus be set at the Hubble time (tH)
which is the age of the Universe currently estimated at 13.7 109years (e.g. Spergel et al. 2003). Modifications through secular
evolution are permanent, but those implying class changes can probably be estimated to occur at the rate tH/nsewhere nse ≃ 2
to 3. This means that if a galaxy and its descendants remain isolated during the age of the Universe, they could globally belong to 2 or 3 different classes. Interactions are clearly the most frequent events in the lives of galaxies being always plunged into the gravitational field which is shaped by other galaxies and dark matter. A quite conservative value for its occurrence rate would be something like tH/ninwith nin ≃ 10 to 50. Accretion-merging is slightly less frequent, and from the GALICS simulations (see
Sect. 3), we estimate the rate at tH/nacwith nac≃ 5 to 10. Ejection-sweeping is a rather rare event, that can be attributed the same
rate as secular evolution: tH/ne jwhere ne j≃ 2 to 3.
Hence, even if the above guesses are very approximative, the number of transformations caused by all the formation processes is certainly sufficient for quite a few classes to appear. Astrocladistic analyses will reveal whether they are organized in a hierarchy or not.
We must stress that the hierarchical organization of galaxy diversity considered in astrocladistics has nothing to do with the hierarchical scenario of galaxy formation that deals solely with their mass distribution (e.g. Hatton et al. 2003) and is depicted by an inverse tree (a lot of small galaxies merging into a fewer big ones).
2.4. Branching evolution and mergers
Except for merging, all the processes described above (Fig. 1) obviously produce branching evolution, leading to a hierarchical organization of the diversity: a given class gives birth to at least a new one. When two galaxies of two different classes merge, a kind of hybrid object is produced by mixing together their basic constituents. This could a priori parallel reticulated evolution
(Sect. 2.1). It is thus possible that the historical information could be lost or impossible to extract from observations. However, since interactions are probably the dominant process of galaxy diversification, mergers are expected to bring only some noise in the cladistic analysis. In addition, major mergers (mass ratio lower than 1/3) are rarer than minor ones which somehow can be compared to accretion. Finally, major mergers are remarkable because they yield an elliptical galaxy from two spirals in numerical simulations (e.g. Barnes 1992, Bournaud et al. 2004). This is based on morphological considerations only. In reality, the velocity dispersion is dramatically increased, forming a bulge from the disks, and starbursts certainly appear as well. Considering all properties of galaxies, these events might not look so catastrophic compared to other events, particularly to interactions.
Moreover, galaxies are not living organisms and their constituents do not behave like genes. In biological hybridization, a gene of one species replaces a gene of the other species. For galaxies, it is always a mixture of basic constituents.
The conclusion is that mergers do not seem to be able to destroy a hierarchical organization of galaxy diversity, and might quite possibly participate in it. We propose in the next sections to test this point by performing an astrocladistic analysis on a sample of simulated galaxies with different numbers of merger events in their entire history. If a tree is found, then it will be possible to check whether the number of mergers could be a kind of cosmological clock for galaxy evolution, whether mergers are the main diversification driver among the formation processes taken into account in the simulations (i.e. assembling, secular evolution and accretion-merging).
3. Selecting the sample
GALICS (Galaxies In Cosmological Simulations) is a hybrid model for hierarchical galaxy formation studies, combining the outputs of large cosmological N-body simulations with simple, semi-analytic recipes to describe the fate of the baryons within dark matter haloes (Hatton et al. 2003, Paper I). As hot gas cools and falls to the centre of these haloes, it settles in a rotationally supported disc. Galaxies remain disc structures unless mergers or instabilities occur, in which case simple recipes are used to develop a bulge and a burst components. Hence a galaxy is described by these three components each one having its own parameters of geometry, dynamics, masses (stars and gas), metallicity and photometry from the ultraviolet to the far infrared. Assembling (first appearing in the simulation as a minimum local overdensity), secular evolution and accretion-merging are taken into account. Interactions between galaxies and ejection-sweeping phenomena are not considered.
Each galaxy is identified by a specific number at each timestep of the simulation. Each galaxy is the product of one or more galaxies of the previous step and one or more evolutionary processes that occurred since the previous step. The entire genealogy of each galaxy is thus known. The sample was selected among galaxies at the present epoch (redshift=0) of the simulation. For any given galaxy, we counted the total number of merging events that lead to its formation since the birth of the very first of its ancestors. We arbitrarily selected a number of galaxies with 1, 2, 3, 4, 5, 6, 8 and 10 mergers (5 galaxies each) and with 15, 20 and 22 mergers (1 galaxy each) for a total of 43 galaxies. We also noted the number of major mergers, implying two galaxies with a mass ratio larger than 1/3. In order to visualize quickly some correlations on the final tree, we named the galaxies as XXcYAAN where XX is the total number of mergers, Y the number of major events and AA stands for central (CE), satellite (SA) or field (CH) galaxies. N merely identifies galaxies having the same XX and AA.
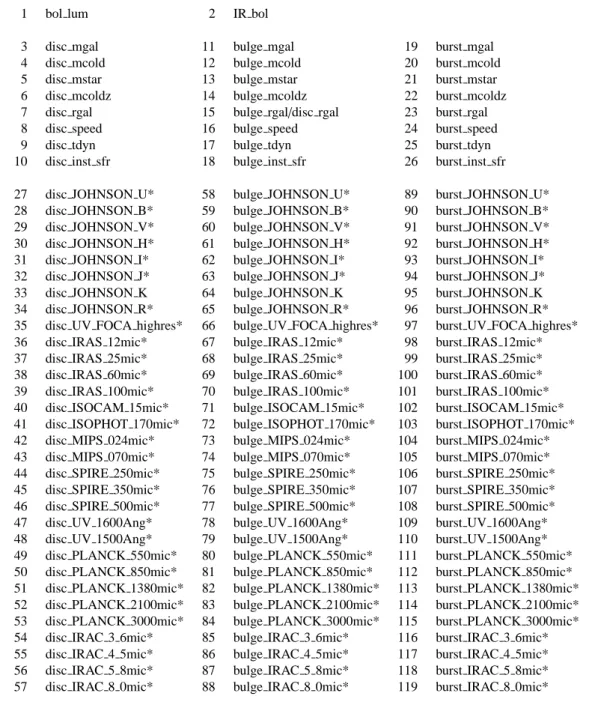
They are described by 119 parameters which we assumed to be evolutive characters (Table 1). There are the total bolometric luminosity and the total bolometric IR (infrared) flux. Then, for each of the three components of galaxies (disc, bulge and burst), there are some size, mass and kinematic data, but principally photometric values from the ultraviolet to the far infrared. Like in Paper I, all magnitudes are relative to the K band, this last value giving the relative heights of the spectra or relative brightnesses between galaxies. We replaced the size of the bulge (bulge rgal) with the ratio between sizes of bulge and disc (bulge rgal/disc rgal). The dynamical time tdyn is the time taken for material at the half-mass radius to reach the opposite side of the galaxy (disk component) or its centre (bulge and burst components), whereas the instantaneous star formation rate is derived from this dynamical time, the mass of the cold gas and a prescribed star formation efficiency, all taken at the last time substep of the simulation (Hatton et al. 2003).
Total magnitudes for the galaxies, merely computed by adding intensities of the three components, were not included in the analysis. They are certainly less precise to describe evolution of galaxies and might introduce some redundancy, that is some artificial overweighting of some characters. However, they can be projected onto the final cladograms for interpretation purposes (see Sect. 6).
4. Astrocladistics analysis
For a detailed presentation of the method, the reader should refer to Paper I and references therein. Only ingredients particular to the analysis performed in this second paper are described in this Section.
1 bol lum 2 IR bol
3 disc mgal 11 bulge mgal 19 burst mgal
4 disc mcold 12 bulge mcold 20 burst mcold 5 disc mstar 13 bulge mstar 21 burst mstar 6 disc mcoldz 14 bulge mcoldz 22 burst mcoldz 7 disc rgal 15 bulge rgal/disc rgal 23 burst rgal 8 disc speed 16 bulge speed 24 burst speed
9 disc tdyn 17 bulge tdyn 25 burst tdyn
10 disc inst sfr 18 bulge inst sfr 26 burst inst sfr 27 disc JOHNSON U* 58 bulge JOHNSON U* 89 burst JOHNSON U* 28 disc JOHNSON B* 59 bulge JOHNSON B* 90 burst JOHNSON B* 29 disc JOHNSON V* 60 bulge JOHNSON V* 91 burst JOHNSON V* 30 disc JOHNSON H* 61 bulge JOHNSON H* 92 burst JOHNSON H* 31 disc JOHNSON I* 62 bulge JOHNSON I* 93 burst JOHNSON I* 32 disc JOHNSON J* 63 bulge JOHNSON J* 94 burst JOHNSON J* 33 disc JOHNSON K 64 bulge JOHNSON K 95 burst JOHNSON K 34 disc JOHNSON R* 65 bulge JOHNSON R* 96 burst JOHNSON R* 35 disc UV FOCA highres* 66 bulge UV FOCA highres* 97 burst UV FOCA highres* 36 disc IRAS 12mic* 67 bulge IRAS 12mic* 98 burst IRAS 12mic* 37 disc IRAS 25mic* 68 bulge IRAS 25mic* 99 burst IRAS 25mic* 38 disc IRAS 60mic* 69 bulge IRAS 60mic* 100 burst IRAS 60mic* 39 disc IRAS 100mic* 70 bulge IRAS 100mic* 101 burst IRAS 100mic* 40 disc ISOCAM 15mic* 71 bulge ISOCAM 15mic* 102 burst ISOCAM 15mic* 41 disc ISOPHOT 170mic* 72 bulge ISOPHOT 170mic* 103 burst ISOPHOT 170mic* 42 disc MIPS 024mic* 73 bulge MIPS 024mic* 104 burst MIPS 024mic* 43 disc MIPS 070mic* 74 bulge MIPS 070mic* 105 burst MIPS 070mic* 44 disc SPIRE 250mic* 75 bulge SPIRE 250mic* 106 burst SPIRE 250mic* 45 disc SPIRE 350mic* 76 bulge SPIRE 350mic* 107 burst SPIRE 350mic* 46 disc SPIRE 500mic* 77 bulge SPIRE 500mic* 108 burst SPIRE 500mic* 47 disc UV 1600Ang* 78 bulge UV 1600Ang* 109 burst UV 1600Ang* 48 disc UV 1500Ang* 79 bulge UV 1500Ang* 110 burst UV 1500Ang* 49 disc PLANCK 550mic* 80 bulge PLANCK 550mic* 111 burst PLANCK 550mic* 50 disc PLANCK 850mic* 81 bulge PLANCK 850mic* 112 burst PLANCK 850mic* 51 disc PLANCK 1380mic* 82 bulge PLANCK 1380mic* 113 burst PLANCK 1380mic* 52 disc PLANCK 2100mic* 83 bulge PLANCK 2100mic* 114 burst PLANCK 2100mic* 53 disc PLANCK 3000mic* 84 bulge PLANCK 3000mic* 115 burst PLANCK 3000mic* 54 disc IRAC 3 6mic* 85 bulge IRAC 3 6mic* 116 burst IRAC 3 6mic* 55 disc IRAC 4 5mic* 86 bulge IRAC 4 5mic* 117 burst IRAC 4 5mic* 56 disc IRAC 5 8mic* 87 bulge IRAC 5 8mic* 118 burst IRAC 5 8mic* 57 disc IRAC 8 0mic* 88 bulge IRAC 8 0mic* 119 burst IRAC 8 0mic*
Table 1. List of characters. mstar, mcold and mcoldz stand respectively for the masses of stars, gas and metals. rgal is the
com-ponent radius, speed its rotation speed, tdyn the dynamical time, and inst sfr the instantaneous star formation rates. Magnitudes (characters 27 to 119, starred) are relative to the K band of each component. See text for more details.
4.1. The matrix
Following results from Paper I, spectral characters were included in the matrix as colour magnitudes with respect to the K band for each component. This band provides relative brightness between galaxies, while colours indicate the evolutionary state for physical and chemical constituents. The original table is available on request.
4.2. Coding of the matrix
The evolution of characters is described by 8 discrete states which are regular bins in colour magnitudes. In case one magnitude for a given character is undetermined (value “99” in the initial matrix standing for null flux), code 7 was attributed and the other entries coded from 0 to 6. The coded matrix is presented in Table 2.
4.3. Additional constraints
An ordered (Wagner) evolution was imposed on the characters, so that they are supposed to evolve smoothly with time: changes between two adjacent states are more parsimonious than between distant ones. This assumption is physically plausible and we found that it significantly improves the robustness of the final tree.
4.4. Outgroup
The choice of an outgroup is required to root the cladogram or to orientate the arrow of time. However, this is always a difficult question, particularly when the phylogenesis of the group under study is not understood. This is obviously the case for galaxies because astrocladistic galaxy classification is still in its infancy.
Nonetheless, the absence of any identified outgroup does not prevent a phylogenetic analysis to be made because it still provides invaluable results on relationships and groupings of objects from an evolution point of view. In this paper, we will try to consider 01c0CH2, 01c0CH3, 01c0CH4 as a priori possible outgroups (less diversified objects) for the group under study since they result from only one non-major merger. Indeed, this argument looks like an a priori hypothesis stating that merger events are a dominant driver of diversification. In view of Sect. 2.1, this is still to be demonstrated, and the present analysis does not support this point (Sect. 5). Our choice is thus dictated by display purposes only.
4.5. Heuristic quest for the best trees
We used the PAUP4b10* package (Swofford 2003) on Linux PC computers to perform all calculations shown in this paper. The maximum parsimony criterion was chosen. Since we do not know anything about evolutionary relationships of the objects of our sample, bootstrap values (Paper I) were optimized by removing object after object until we reach a satisfactory tree, i.e. a tree displaying highly supported nodes.
4.6. Assessment of the phylogenetic signal in the data
The robustness of the final result was decided from bootstrap values and confirmed by decay Bremer indices (see Paper I for details).
5. Results
5.1. The best cladogram
As already mentioned in Paper I, burst characters are probably not very pertinent for evolution since they concern a temporary component of galaxies. Comparison runs showed us that results without them are more robust. The high variability of burst characters is confirmed on their projections on the final cladogram (not shown in this paper). The analysis presented afterwards is thus performed with the 80 remaining characters.
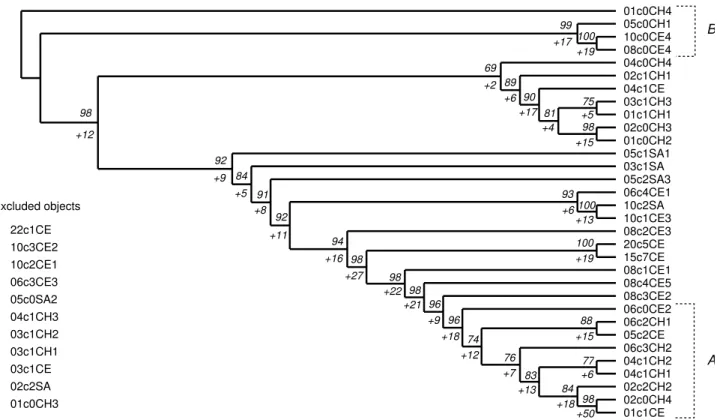
The best tree was found after excluding 11 objects. They must be considered as objects perturbing the cladogram probably because they do not share common evolution patterns with the other ones. We stopped the optimization process when we reached a point where excluding one or two more objects or some more characters was not improving the bootstrap value for any node. We consider the result as highly significant. The cladogram with 32 objects and 80 ordered characters is shown in Fig. 2. The 11 excluded objects are not found to build a group (no robust tree).
The outgroup (see Sect. 4.4) was chosen to be 01c0CH4 for a better visualization of the cladogram than with 01c0CH2, whereas 01c0CH3 belongs to the excluded objects. This already shows that basing evolution (diversification) only on merger events is not a valid approach.
The analysis of the entire initial matrix revealed a partly resolved tree but this was poorly supported. Even if the result shown is obtained for 32 objects only, it is still remarkable to find such a cladogram, well supported by excellent bootstrap and decay values, for an arbitrarily chosen sample of galaxies (see a discussion in Paper I). This really tells us that branching evolution is the dominant diversification mechanism, and that mergers do not destroy the tree-like organization, at least in the GALICS simulations.
There might be a trend toward a correlation between diversification and number of mergers. Among the 9 galaxies with no major merger (labelled *c0*), 7 are grouped in the upper part of the cladogram, 06c0CE2 and more noticeably 02c0CH4 being at the opposite end (the most diversified objects from 01c0CH4). In addition, three galaxies (05c0CH1, 08c0CE4, 10c0CE4) in the upper part have a number of mergers significantly higher than the other ones. Except for these three objects, there is a regular increase of the total number of mergers downward on the cladogram, but after 20c5CE a regular decrease occurs. Objects with more major mergers are also grouped together, roughly in the middle of the cladogram. But there is no regular increase
01c0CH4 05c0CH1 10c0CE4 08c0CE4 100 99 04c0CH4 02c1CH1 04c1CE 03c1CH3 01c1CH1 75 02c0CH3 01c0CH2 98 81 90 89 69 05c1SA1 03c1SA 05c2SA3 06c4CE1 10c2SA 10c1CE3 100 93 08c2CE3 20c5CE 15c7CE 100 08c1CE1 08c4CE5 08c3CE2 06c0CE2 06c2CH1 05c2CE 88 06c3CH2 04c1CH2 04c1CH1 77 02c2CH2 02c0CH4 01c1CE 98 84 83 76 74 96 96 98 98 98 94 92 91 84 92 98 05c0SA2 06c3CE3 10c2CE1 10c3CE2 22c1CE 01c0CH3 02c2SA 03c1CE 03c1CH1 03c1CH2 04c1CH3 Excluded objects +12 +5 +9 +8 +22 +16 +27 +11 +13 +7 +12 +18 +9 +21 +2 +19 +17 +50 +18 +17 +6 +4 +5 +15 +6 +13 +19 +15 +6 B A
Fig. 2. Best cladogram obtained without burst characters and after step by step removal of the indicated galaxies. See text for
galaxy nomenclature. Letters A and B correspond to groups mentioned in the text. Numbers to the left of each node are bootstrap (above) and decay (below with a plus sign) values. The number of steps for this tree is 1364. Consistency Index (CI) = 0.41, Retention Index (RI) = 0.71 (see Paper I for details).
with evolution. We conclude that, even if mergers are a driver of diversification, they are not the principal one and cannot be considered as a reliable evolution clock.
The two galaxies with the highest number of mergers and major mergers (15c7CE and 20c5CE) are clearly grouped together (bootstrap of 100), obviously sharing similar histories as compared to all the other ones. There seems to be a loose trend for the number of major mergers to increase with the total number of mergers, the corresponding galaxies becoming more central objects. There is a noticeable exception (22c1CE) with only 1 major event for 22 mergers in total and which belongs to the excluded objects.
5.2. Evolution of characters
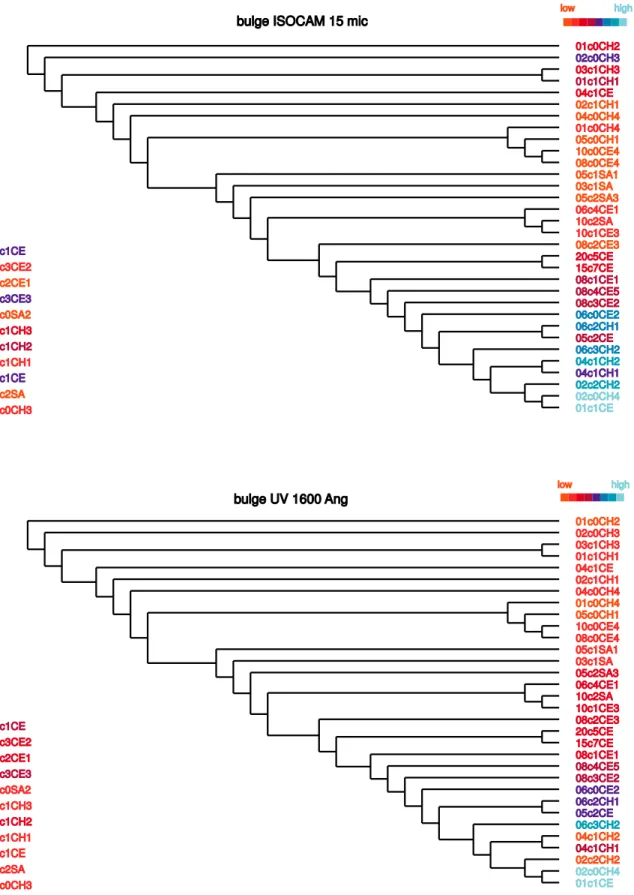
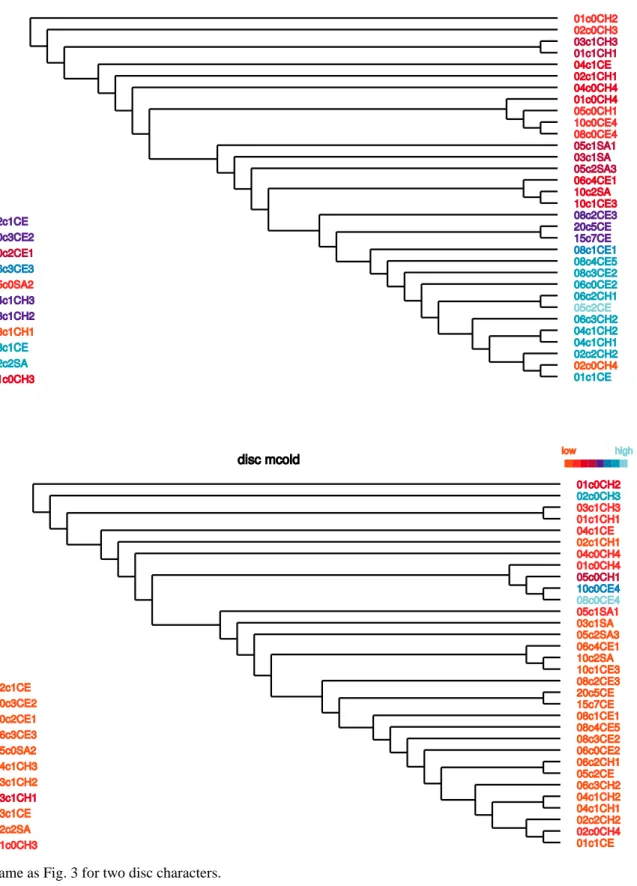
In the previous section, it was noticed that organization on the cladogram is not entirely due to merger processes. So what causes the hierarchy? We present in Fig. 3 and Fig. 4 projections of four characters in colour codes (with respect to the K band, see Table 1). They help understand unique properties of groups of galaxies. It is found that there is a group of galaxies at the bottom (identified as A in Fig. 2) characterized by very high values of near infrared and UV (ultraviolet) colours (with respect to the K band) for the bulge component. In addition, their disc has also a very high colour value in the near infrared. Finally, the cold gas mass of the disc is decreasing regularly from the top toward the bottom of the cladogram as shown, with a group (B on Fig. 2) having high masses.
These properties alone explain the organization found for this sample. The other characters generally behave somewhat more erratically in this picture. With this information, it is possible to understand the events that create such character evolutions, hence galaxy diversity, by relating the observable to the basic constituents (stars, gas and dust). This is beyond the scope of this work and is reserved for further and more complete studies of GALICS galaxies, as well of course of real ones.
6. Discussion
The cladogram presented in the previous section is a synthetic way to visualize a set of data and hypotheses. Results should be discussed in view of these inputs. Concerning the choice of the objects, as already noticed, it is remarkable to find a well resolved tree with 32 galaxies while the total sample (43) has been arbitrarily selected among thousands of possible candidates. This means that the majority of our sample object classes have a common ancestor (ancestral species). Their very first progenitors,
born at different times and places in the Universe, were made up with material of comparable histories and underwent similar physical processes. Thus the Universe was not very inhomogeneous, but one should remember that this is a simulated Universe. To obtain a very robust tree, 11 objects have been excluded. Several explanations can be invoked. These galaxies can be too distant in the evolution (too much diversified) for any valuable relationships with the other to be discovered. More characters could be needed to establish the global phylogeny. It is possible also that there are some true hybrid specimens that cannot easily fit in a cladogram with the others. Clearly, more galaxies should be studied and further work is necessary before understanding these objects in view of phylogenetic classes still to be defined.
Individual galaxies are representative of classes. This is a one-galaxy one-class assumption which should be checked: if two galaxies are very similar in their coded characters, they could define a class. Quantitative values have been divided into 8 bins to build the coded matrix. Nevertheless, it is possible to reduce this number, in order to avoid over-resolution and allow for some initial groupings. In our case, this gave worse results, without revealing galaxies with similar sets of coded characters. As presented in Paper I, comparing two objects in evolution can be done in several ways. Cladistic analysis is one way, but it defines classes a posteriori, using cladograms, and not a priori. This is a step by step process and a long term goal of astrocladistics.
For better objectivity of the methodology of classification (see Paper I), all available observables should be a priori included. The cladistic analysis reveals their pertinence and their behaviour regarding evolution. The fundamental point is that the decision of excluding some characters is to be made afterwards, based on objective and transparent arguments provided by the analysis itself, associated statistical tools and interpretation of the cladogram. In our case, including burst characters clearly hampered the convergence toward a robust tree. Projections on the cladograms unambiguously show their high variability with time (figures available on request).
The hierarchical organization is mainly explained by infrared properties (Sect. 5.2). This has naturally a strong impact on our understanding of the physics of the galaxy evolution and diversity (since infrared radiation mainly indicates temperature of the dust). This could also be partly caused by redundancy of this information in the matrix. But how can we be sure not to artificially weight characters and thus influence important evolution indicators? A way around this difficulty would be to compare cladograms obtained with different weight hypotheses, and check the overall astrophysical consistency of the resulting interpretations. We reserve such an analysis for further studies with larger samples within GALICS. It is important to realize that a cladogram is never definitive. For instance, future discoveries will bring new information in the initial matrix, and the cladogram will change accordingly (see Paper I).
The GALICS simulations do not take interactions and ejection-sweeping into account. Our results show that diversification occurs in a hierarchical way and mergers obviously play a role. Because they do not seem to constitute an evolutionary clock, they are not the dominant process for galaxy evolution so that mergers, accretion, secular evolution and also assembling compete for diversification.
The astrophysical goals of this paper were twofold: the formalization of formation and diversification processes, and the role of mergers in branching evolution. The first point can now be employed in astrocladistic analyses of real galaxies. The second can only be addressed by simulated samples as we did. Future simulations, including interactions between galaxies and kinematic information, will be invaluable for making precise estimations of the respective importance of the five formation processes identified in this paper, by comparing phylogenetic analyses of both simulated and real samples.
Can we apply astrocladistics to real galaxies? Our works in Paper I and here demonstrate that there are absolutely no obstacles: characters used are real observables. Indeed, this has already been undertaken for samples of Dwarf Galaxies of the Local Group and of Virgo galaxies (see Fraix-Burnet 2004 for an overview). The more characters we have, the more robust and the larger the galaxy tree is. This series of papers on simulated galaxies show that photometric characters are well suited. For real galaxies, other parameters are available as well, particularly on chemical composition and kinematics. This last category of observables is particularly important because it is a potential tracer of past interactions and mergers. In addition, the apparent morphology of galaxies, a subjective and qualitative character used in the Hubble classification, is essentially caused by and included in kinematic properties, which are objective and quantitative descriptors.
7. Conclusions
Astrocladistics relies on two basic requirements presented in Paper I and this paper: galaxies and their evolution are defined and described by their basic constituents (stars, gas and dust), diversification is due to branching evolution. The success of an analysis is judged from objective statistical methods and from the astrophysical interpretation of the cladogram.
The analysis of a sample of simulated galaxies shows that mergers do not destroy the hierarchical organization of diversity. This is because it is not such a different event from accretion, except for its violence. The basic constituents are mixed together and not replaced. Mergers thus cannot be paralleled by hybridization leading to reticulated evolution in biology. In conclusion, the five galaxy formation processes identified in this paper participate in a branching evolution.
It is difficult to draw general conclusions on the phylogeny of galaxies from the analysis presented in this paper and it was not its objective. Interactions between galaxies are not taken into account in the GALICS simulation. This formation process is certainly the most frequent one, and being in general very violent, it is expected to be one of the main drivers of diversification.
A lot more studies are possible with the GALICS database, particularly to help understand how diversity occurs in such simulations. It is also an invaluable tool to learn more on astrocladistic methodology and interpretation of its results. Finally, it helps in handling samples of real galaxies for which we have no historical information and possibly less available characters. In both papers of this series, the results unambiguously validate the approach. Ongoing positive results on Dwarfs Galaxies of the Local Group and Virgo galaxies (Fraix-Burnet 2004) show that this conclusion is not limited to simulated galaxies. The final game is here: beyond a necessary new taxonomic classification, is the establishment of the tree of galaxies. Many more astrocladistic studies are required, as well as gathering as many observational galaxy descriptors as possible.
Current and future big surveys (like Sloan Digital Sky Survey, Vimos VLT Deep Survey, Great Observatories Origins Deep Survey, ...) collecting photometric and spectroscopic data on huge samples of galaxies at all redshifts seem particularly well suited for astrocladistics. Such large data sources will be integrated within the international Virtual Observatory project (http://www.ivoa.net/) that will provide large numbers of characters for large samples of diversified galaxies.
It is also true that, even if, somewhat like in biology, the environment plays a crucial role in galaxy evolution (accretions, interactions and mergers), galaxies set new conditions for cladists: continuous data, comprising error bars and upper/lower limits, violent generation of species, huge amount of objects for not that many characters, instantaneous galaxy diversity that might decrease because of gravity leading to fewer and fewer objects. In addition, the detailed evolutionary physical and chemical processes are basically understood, and objects of the past (high redshift galaxies) will be observed with future giant telescopes at the same detail as present day galaxies.
Acknowledgements. The authors wish to thank the two referees for very interesting and helpful comments on the manuscript. This work uses
the GalICS/MoMaF Database of Galaxies (http://galics.iap.fr). We warmly thank Bruno Guiderdoni and Jeremy Blaizot from the GALICS project for invaluable help and discussions. All the GALICS team should be thanked for providing such a useful database. Emmanuel Davoust kindly read the manuscript and helped us much in improving it. Most computations of the results presented in this paper were performed under the CIMENT project in Grenoble. The contribution of EJPD is publication 2006-002 of the Institut des Sciences de l’ ´Evolution de Montpellier (UMR 5554 - CNRS).
References
BENOIT, A., et al. (2O03), “Cosmological constraints from Archeops”, Astronomy and Astrophysics, 399, L25-L30 (http://www.arxiv.org : astro-ph/0210306).
BARNES, J. E. (1992), “Transformations of galaxies. I - Mergers of equal-mass stellar disks”, Astrophysical Journal, 393, 484-507.
BOURNAUD, F., COMBES, F. and JOG, C.J. (2004), “Unequal-mass galaxy merger remnants: Spiral-like morphology but elliptical-like kinematics”, Astronomy and Astrophysics, 418, L27-L30 (astro-ph/0403307).
BROMM, V., FERRARA, A., COPPI, P.S. and LARSON, R.B. (2003), “ The fragmentation of pre-enriched primordial objects”, Monthly
Notices of the Royal Astronomical Society, 328, 969-976.
BROMM, V. and LOEB, A. (2003), “The First Sources of Light”, American Institute of Physics Conference Proceedings, 666, 73-84 (astro-ph/0301406).
BROWER, A.V.Z. (2000), “Evolution Is Not a Necessary Assumption of Cladistics”, Cladistics, 16, 143-154. DARWIN, C. (1859), “The Origin of Species” (John Murray, London).
DE VAUCOULEURS, G. (1959), “Classification and Morphology of External Galaxies”, Handbuch der Physik, 53, 275-310. DOOLITTLE, W.F. (1999), “Phylogenetic Classification and the Universal Tree”, Science, 284, 2124-2128.
FRAIX-BURNET, D. (2004), “First Phylogenetic Analyses of Galaxy Evolution”, in Penetrating Bars through Masks of Cosmic Dust: The
Hubble Tuning Fork strikes a New Note, D.L. Block, I. Puerari, K.C. Freeman, R. Groess, E.K. Bloch, eds, Kluwer Publishers, Astrophysics
and Space Science Library, 319 (http://hal.ccsd.cnrs.fr/ccsd-00002144).
FRAIX-BURNET, D., CHOLER, P. and DOUZERY, E.J.P. (2003), “What can biologists say about galaxy evolution?”, Astrophysics and Space
Science, 284, 535-538 (astro-ph/0303410).
FRAIX-BURNET, D., CHOLER, P., DOUZERY, E.J.P. and VERHAMME, A. (2006), “Astrocladistics: a phylogenetic analysis of galaxy evolution I. Character evolutions and galaxy histories”, Journal of Classification, 23, (Paper I).
HATTON, S., DEVRIENDT, J.E.G., NININ, S., BOUCHET, F.R., GUIDERDONI, B., and VIBERT, D. (2003), “GALICS I. A hybrid N-body/semi-analytic model of hierarchical galaxy formation”, Monthly Notices of the Royal Astronomical Society, 343, 75-106 (astro-ph/0309186).
HENNIG, W. (1965), “Phylogenetic systematics”, Annual Review of Entomology, 10, 97-116.
HENSLER, G., STASINSKA, G., HARFST, S., KROUPA, P., THEIS, Ch., eds (2003), “The Evolution of Galaxies III. From Simple Approaches to Self-Consistent Models” (Kluwer Academic Publishers).
HUBBLE, E.P. (1922), “A General Study of Diffusive Galactic Nebulae”, Astrophysical Journal, 56, 162-199. HUBBLE, E.P. (1926), “Extra-galactic Nebulae”, Astrophysical Journal, 64, 321-369.
HUBBLE, E.P. (1936), “The Realm of Nebulae” (New Haven:Yale Univ. Press). KNAPP, S. (2000), “What’s in a name?”, Nature, 408, 33.
LEGENDRE, P. (2000), “Reticulate Evolution: from Bacteria to Philosopher”, Journal of Classification, 17, 153-157.
MENCI, N., CAVALIERE, A., FONTANA, A., GIALLONGO, E., POLI, F. and VITTORINI, V. (2004), “Early Hierarchical Formation of Massive Galaxies Triggered by Interactions”, Astrophysical Journal, 604, 12-17 (astro-ph/0311496).
ROBERTS, M.S. and HAYNES, M.P. (1994), “Physical Parameters along the Hubble Sequence”, Annual Review of Astronomy and
SANDAGE, A. (1961), “The Hubble Atlas of Galaxies” (Washington:Carnegie Inst. Washington).
SAUVAGE, M, STASINSKA, G. and SCHAERER, D., eds (2002), “The Evolution of Galaxies. II- Basic Building Blocks” (Kluwer Academic Publishers).
SCHNEIDER, R., FERRARA, A., NATARAJAN, P. and OMUKAI, K. (2002), “First Stars, Very Massive Black Holes, and Metals”,
Astrophysical Journal, 571, 30-39 (astro-ph/0111341).
SPERGEL, D.N., et al. (2003), “First-Year Wilkinson Microwave Anisotropy Probe (WMAP) Observations: Determination of Cosmological Parameters”, Astrophysical Journal Supplement, 148, 175-194 (astro-ph/0302209).
STEIDEL, C.C. (1999), “Observing the epoch of galaxy formation”, Proceedings of the National Academy of Science, 96, 4232-4235. SWOFFORD, D. L. (2003), “PAUP*: Phylogenetic Analysis Using Parsimony (*and Other Methods)”, Sinauer Associates, Sunderland,
Massachusetts.
VAN DEN BERGH, S. (1998), “Galaxy Morphology and Classification” (Cambridge University Press).
VILCHEZ, J., STASINSKA, G. and PEREZ, E., eds (2001), “The Evolution of Galaxies. I- Observational Clues” (Kluwer Academic Publishers).
WILEY, E.O., SIEGEL-CAUSEY, D., BROOKS, D.R. and FUNK, V.A. (1991), “The Compleat Cladist: A Primer of Phylogenetic Procedures”, The university of Kansas, Museum of Natural History special publication N. 19.
01c0CH2 02c0CH3 03c1CH3 01c1CH1 04c1CE 02c1CH1 04c0CH4 01c0CH4 05c0CH1 10c0CE4 08c0CE4 05c1SA1 03c1SA 05c2SA3 06c4CE1 10c2SA 10c1CE3 08c2CE3 20c5CE 15c7CE 08c1CE1 08c4CE5 08c3CE2 06c0CE2 06c2CH1 05c2CE 06c3CH2 04c1CH2 04c1CH1 02c2CH2 02c0CH4 01c1CE bulge UV 1600 Ang 05c0SA2 06c3CE3 10c2CE1 10c3CE2 22c1CE 01c0CH3 02c2SA 03c1CE 03c1CH1 03c1CH2 04c1CH3 low high 01c0CH2 02c0CH3 03c1CH3 01c1CH1 04c1CE 02c1CH1 04c0CH4 01c0CH4 05c0CH1 10c0CE4 08c0CE4 05c1SA1 03c1SA 05c2SA3 06c4CE1 10c2SA 10c1CE3 08c2CE3 20c5CE 15c7CE 08c1CE1 08c4CE5 08c3CE2 06c0CE2 06c2CH1 05c2CE 06c3CH2 04c1CH2 04c1CH1 02c2CH2 02c0CH4 01c1CE bulge ISOCAM 15 mic
05c0SA2 06c3CE3 10c2CE1 10c3CE2 22c1CE 01c0CH3 02c2SA 03c1CE 03c1CH1 03c1CH2 04c1CH3 low high
Fig. 3. Cladogram of Fig. 2 with projected characters in colour codes indicated on top right. ’Low’ and ’high’ refer to magnitudes
01c0CH2 02c0CH3 03c1CH3 01c1CH1 04c1CE 02c1CH1 04c0CH4 01c0CH4 05c0CH1 10c0CE4 08c0CE4 05c1SA1 03c1SA 05c2SA3 06c4CE1 10c2SA 10c1CE3 08c2CE3 20c5CE 15c7CE 08c1CE1 08c4CE5 08c3CE2 06c0CE2 06c2CH1 05c2CE 06c3CH2 04c1CH2 04c1CH1 02c2CH2 02c0CH4 01c1CE disc IRAS 25 mic
05c0SA2 06c3CE3 10c2CE1 10c3CE2 22c1CE 01c0CH3 02c2SA 03c1CE 03c1CH1 03c1CH2 04c1CH3 low high 01c0CH2 02c0CH3 03c1CH3 01c1CH1 04c1CE 02c1CH1 04c0CH4 01c0CH4 05c0CH1 10c0CE4 08c0CE4 05c1SA1 03c1SA 05c2SA3 06c4CE1 10c2SA 10c1CE3 08c2CE3 20c5CE 15c7CE 08c1CE1 08c4CE5 08c3CE2 06c0CE2 06c2CH1 05c2CE 06c3CH2 04c1CH2 04c1CH1 02c2CH2 02c0CH4 01c1CE
disc mcold low high
05c0SA2 06c3CE3 10c2CE1 10c3CE2 22c1CE 01c0CH3 02c2SA 03c1CE 03c1CH1 03c1CH2 04c1CH3
1 4 F ra ix -B u rn et et al .: A st ro cl ad is ti cs : a p h y lo g en et ic an al y si s o f g al ax y ev o lu ti o n II 20c5CE 61102066107372060700004600543122024543252422222122222666565555505421112111111221111133432344551521111111110022000113311 15c7CE 73000055107474050600035501443122024542242422222222222666555545505421112111111221111133433356660620000000000022000001100 10c2SA 20203035013232050600000000544132034221121211112111111554366666616410001000000220000011217777777777777777777777777777777 10c0CE4 31757772361717021400005210666555065110010100002200000223255555625300000000000110000011110000003004432424322200222226665 10c1CE3 41506037014141070700002700543122033321121211111111111554366666616410001000000220000021210000003005433534333200222336665 10c3CE2 20000045103332050600003500543122126543252422225422222666566666616410001000000220000011210000006006655656555500555556666 10c2CE1 20101054103434040600000000543122024432141321112111111665466666616410000000000220000011217777777777777777777777777777777 08c4CE5 21000053202221030220204300543122226665463643335433333666666545515532223222222332222243436665650652221212111155111115433 08c0CE4 21676772370404021300004210332122022211010100001100000553255656636300000000000110000011100000002004322423222200222226654 08c2CE3 10000073202424030500003300543122024543252422222222222666566666616410000000000220000010110000005006666666666600666666666 08c3CE2 20000053202422031200005310443122025664363643334433333666633323313332223221222332222255530000002003322313211100111126643 08c1CE1 22000053200202030170715300543122126553252532225622222666666545525332113121112212222143436665650663211222122266222225443 06c3CH2 10000051301010011000005110443021126665464654445544444666655534424665445454444664444455662343541521111111111022001113321 06c2CH1 10000042201110020000000000543122226666666666666666666666655434424554335343333433333355657777777777777777777777777777777 06c3CE3 10000032101010020100003200432021125654362532224422222666644433323443224232222332222255542345651521111101100022000002211 06c0CE2 10101052200100021000005210443122025664363633333333333666655534424554335343333443333354650000004006655656544400444456666 06c4CE1 21000033101212030300003300554233043321131211111111111544366666626410001000000220000011213356661621100101000022000002211 05c2SA3 10000052201515020400004200332011022332131311111011111665366666626300000000000220000000100000006006655656555500555556666 05c0SA2 10202122110202020100000000443122033111010110001100000443266666636300000000000110000011107777777777777777777777777777777 05c1SA1 00111161410506011200000000332122022331131211111111111654366666636200000000000110000011107777777777777777777777777777777 05c0CH1 21332332260202010200003100222121021110010100001000000442133444434100000000000000000011002345551521110101100022000002211 05c2CE 10000000001111720100004200777777777777777777777777777777755434424532223222222432222244540000004006665656555500555556666 04c0CH4 00111041210304011200000000222011012221121211111011111554355556645200000000000110000011107777777777777777777777777777777 04c1CH3 00101061400504012100006120332011013543252422221122222666523222232222112111111111111144422233431421211112111111111114422 04c1CH2 00000071600100012000007120322011213666665665552155555666600000030065446454444004444466661222321311111111111111111114421 04c1CH1 10000061500201011000006110322011113666464654442144444666622111121243224232222332222266540000003004432424322200222226665 04c1CE 10111142210202011100004110322011012221121211111111111554355544434322112121111111111143430000003005543535333300333336666 03c1SA 00000042200607011300005110332122122432141321111111111665455666636200000000000110000000000000005006666666666600666666666 03c1CH3 00010051500000011000000000211011111332131311110011111665455545555222112121111101111143437777777777777777777777777777777 03c1CH2 22000061400303012111046121211011111542242422220022222666533323333332113121111221111154434456650631110101100033000003221 03c1CH1 00121131230202011100000000666666064000000000002100000001055555545211001010000110000022217777777777777777777777777777777 03c1CE 10000071500201012000007120332011314666666666663366666666600000020154324343333123333366651111111212211212111111111115532 02c2SA 00000041400101010000000000432011625666666666665666666666656666656300000000000110000000007777777777777777777777777777777 02c0CH4 12111112060000000000027210333233032000000000001100000010077777777777777777777777777777774455550542111211111144111114422 02c0CH3 00261251440101012000006120111011010111010100000000000442144434464244324242222102222254550000004006544645444400333446666 02c2CH2 57000041300000011007075117110000301664363633330032233666622212232066666666666006666666660115230110000000000011000000000 02c1CH1 00000031200503011200004110000000100321121211110011111664311111131100000000000110000023003356661621110101100022000002211 01c0CH4 00010041410504003100005030222222122221020210001100000443245555545210001000000000000022110000003004432424322200222226665 01c0CH3 00010051500706004100006040000000100321131211110011111664355555545211001010000100000022210000003004322323222200222226654 01c0CH2 00020141310101012000004120111000010111010110000000000553234434454122112121111001111143430000003005543535333300333336666 01c1CH1 00010071700504007000007070000000100332131311110011111665444434454232113121111101111144441222322312211212111111111114422
01c1CE 00000031200000000010103110321011113664363633332233333666677777777777777777777777777777776663540663322323222266222225543 Table 2. Coded matrix with photometry values taken as colours with respect to the K-band for each component. Column numbe
rs correspond to character numbers listed in Tab
le
1
. This table is ava
ilable on http :// hal.ccsd.cnrs.fr /aut /fraix-burnet.