HAL Id: hal-00576900
https://hal.archives-ouvertes.fr/hal-00576900
Submitted on 15 Mar 2011
HAL is a multi-disciplinary open access archive for the deposit and dissemination of sci-entific research documents, whether they are pub-lished or not. The documents may come from teaching and research institutions in France or abroad, or from public or private research centers.
L’archive ouverte pluridisciplinaire HAL, est destinée au dépôt et à la diffusion de documents scientifiques de niveau recherche, publiés ou non, émanant des établissements d’enseignement et de recherche français ou étrangers, des laboratoires publics ou privés.
Uncertainties of cultivated landscape drainage network
mapping and its consequences on hydrological fluxes
estimations
Florent Levavasseur, Jean-Stéphane Bailly, Philippe Lagacherie, Michael
Rabotin, François Colin
To cite this version:
Florent Levavasseur, Jean-Stéphane Bailly, Philippe Lagacherie, Michael Rabotin, François Colin. Uncertainties of cultivated landscape drainage network mapping and its consequences on hydrological fluxes estimations. Accuracy2010, Jul 2010, Leicester, United Kingdom. p. 153 - p. 157. �hal-00576900�
Uncertainties of cultivated landscape drainage
network mapping and its consequences on
hydrological fluxes estimations
Levavasseur F., Lagacherie P., Rabotin M.UMR 1221 LISAH, F-34035 INRA Montpellier, France levavass@supagro.inra.fr, lagache@supagro.inra.fr, rabotin@supagro.inra.fr Bailly J.S. UMR 1221 LISAH, F-34035 UMR TETIS, F-34093 AgroParisTech Montpellier, France jean-stephane.bailly@teledetection.fr Colin F. UMR 1221 LISAH, F-34035 Montpellier SupAgro Montpellier, France francois.colin@supagro.inra.fr
Abstract— In this study, we use a network generation method
to simulate equi-probable artificial drainage networks on a small Mediterranean cultivated catchment. The method consists in a stochastic algorithm assimilating sampled observations on the network that generates a ditch network based on the map of field boundaries. A set of one hundred simulations is used to represent the uncertainty on the ditch network. With regards to geometrical (lengths indices), topological (Shreve indices) and topographical metrics (slope indices), simulations similarities compared to the real network are computed. Secondly, uncertainty on the network is propagated through the hydrological model MHYDAS. The induced hydrological responses in hydrographs present a variability that can be linked to previous networks metrics. At this stage of the network generation process, this uncertainty propagation study allows to drive the choice of criteria for future network generation process improvement.
Keywords: artificial drainage network, directed tree, uncertainties, mapping, error propagation, hydrological response.
INTRODUCTION
The linear elements of cultivated landscapes such as hedgerows, bench terraces, ditches, condition ecological or hydrological fluxes within landscape by creating barriers, vectors and discontinuities (Forman & Baudry 1984; Herzon & Helenius 2008). Spatially distributed landscape functioning models are increasingly including explicitly these linear structures as arc-nodes inputs (Branger 2007). This is particularly the case of ditch networks (artificial drainage networks) that strongly impact the inner topology of distributed models (Carluer & Marsily 2004; Moussa et al. 2002). It is therefore necessary to map these networks with enough accuracy for getting confidence in model outputs. However, the costs of exhaustive ground survey and accurate remote sensing to map the artificial drainage network are very large (Bailly et al. 2008). Mapping methods able to reach an acceptable cost-accuracy compromise must therefore be proposed. These methods have to be assessed
with regard to hydrological models outputs, taking into account the error propagation in the models. Error propagation in hydrological models based on conditional geostatistical simulation can achieve this goal for 2 or 3D random field inputs (Grayson et al.). For drainage networks, equivalent conditional random simulation methods are still to be proposed.
The aim of this study is (i) to measure consequences of mapping uncertainties in landscape fluxes simulation and (ii) to investigate which network criteria should be optimized in order to improve network generation from a set of a priori criteria based on geometry, topology or topography of networks. For this, we map the artificial drainage networks of cultivated landscapes, simulate the associated spatial uncertainties and propagate these spatial uncertainties up to hydrological estimations.
This short paper first introduces (i) the method to generate artificial drainage networks, (ii) the way the networks are introduced into catchment segmentation and topology for hydrological modeling and (iii) the hydrological modeling itself. Then, ditch networks are evaluated thanks to descriptive metrics. The hydrological responses of these networks are described before being analyzed in relation with geometrical, topographical and topological metrics.
METHODS
A. Study area
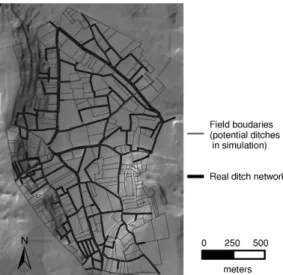
The study area is a small Mediterranean catchment of 2 km² with vineyards, located in the south of France. The altitude varies between 71 and 128m. In the southern and western parts of the catchment, steep slopes occur whereas the northeastern part is relatively flat. The real artificial drainage network is 23995m long and is developed almost all over the catchment (A).
Figure 1. Topography and field limits on the study area
B. Simulations of artificial drainage networks
This short paper focuses on the analysis of the simulated networks and on the hydrological consequences of the uncertainty of drainage network. The network generation method is widely described in (Bailly 2007).
Input data consist in (i) a map of the plot boundaries on the study area and (ii) a set of observed but unconnected reaches of the network. Each segment of the plot boundaries representing a potential ditch (A) is bounded with two nodes on which altitude is attributed. Some segments are added to this lattice in order to allow the ditch network to crossover the roads (culverts in the field). Consequently, the plot boundaries lattice is directed with a unique direction if nodes altitude difference is greater than a parameter dZ and both direction if not. The network generation method consists in a stochastic drainage-like algorithm which generates directed tree network structures corresponding to connected subgraph of the agricultural plot boundaries directed lattice (Bailly 2007). The method is a simulated annealing process based on (i) directed random walks within the directed plot lattice connecting the parts of the networks and (ii) a branching-pruning random process. Simulated annealing process allows simulation network to converge on a target metric on network: total length of network connected to a given outlet, spatialized drainage densities, etc. The target must integrate the most relevant parameter with regards to the purpose of the simulation (hydrological modeling, habitat connectivity modeling, etc.). This choice can also depend on the available data on the study area.
On the case study, the observed reaches come from results of a remote sensing process (Bailly et al. 2008) and from a French national database on hydrography, representing in total 5km long reaches. The dZ parameter is fixed to 1 meter according to the used 5m resolution DEM noise on altimetry. The target metric used for simulation is total length of network connected to the catchment outlet, 23995m more or less one percent, considering, for generalization, that drainage densities can be locally estimated in space through explicative variables (Lagacherie et al. 2006).
Uncertainties in networks mapping using this network generation process are simulated through the generation of one hundred equi-probable networks.
C. Catchment surface network topological relationships
In order to use the simulated networks as inputs of the selected hydrological model, the topological relationships are defined for each set of hydrological units: linear units (ditches) and surface units (plots). To achieve this task, the Geo-MHYDAS tool, running under GRASS GIS is used. Geo-Mhydas builds an oriented topology between irregularly shaped areal units and linear units that allows the routing of the simulated water flows across the landscape (Lagacherie et al. in press). Geo-MHYDAS uses as input a DEM and the GIS layers of the ditch network and of the fields. For each unit, the neighbor with the steepest slope is defined as its downstream unit. Both topologies of cases with simulated networks and of the case with the real network are computed with this tool.
D. Hydrological modeling
The hydrological model used is the physically based rainfall-runoff model MHYDAS (Moussa et al. 2002) which is available within the modeling platform Openfluid ® (Fabre et al. 2010). MHYDAS is a distributed model that considers the catchment as a series of interconnected geographical units. A Green and Ampt-like ponding time formula determines infiltration rate on fields (areal unit). The rainfall excess is converted in runoff, which is routed to the outlet of the unit (another field or a ditch). Then, the diffusive wave equation is used to route the discharge through the network.
In order to limit the number of variables tested when comparing the simulated ditch networks, a simplified case is studied here. Rainfall is spatially homogeneous on the basin and a simple uniform rainfall of 50 mm in 4 hours is used. A homogeneous land cover on the basin is used which implies identical surface units parameters (hydraulic conductivity for instance). Concerning the ditch networks, the parameters are set to the same value for every simulations (ditch height and width, manning coefficient). No interaction between surface and groundwater is set. At the end, what is really tested are changes in surface / linear units topology and in topographic parameters.
E. Descriptive network and hydrological metrics
To compare the simulated networks and the real network, both aggregated and distributed metrics are computed. Aggregated metrics are the total ditch network length, the Shreve order (Shreve 1966) weighted average slope, the number of sources and the average distance to outlet. The Shreve order weighted average slope is a global indicator of slope that gives more importance to downstream ditches (which have more hydrological impact on transfer time). The average distance to outlet corresponds to the average distance from the upstream point of ditches to the outlet of the catchment. In parallel, four distributed metrics are also computed: distribution of the number of ditches in function of ditch length and average distance to outlet, distribution of ditch slope in function of Shreve order and distribution of network length in function of Shreve order. Distribution of ditch slope in function of Shreve order gives an average
slope profile, from upstream to downstream part of the catchment.
Concerning the hydrological variables, the hydrographs, the peak discharge and the lag time at the catchment outlet are studied. The produced volume isn’t considered since it doesn’t vary: infiltration occurs only on fields of which parameters don’t vary between simulations.
RESULTS
F. Ditch network analysis
Fshows the representations of the real network and three on the hundred simulations with the ditch width depending on the Shreve order while FA) and B) show respectively global and distributed views of descriptive metrics characterizing these simulations.
Figure 2. The real ditch network and three examples of simulations
Globally, the spatial structure of the simulated networks looks close to the actual network. Total length of the networks and the Shreve order weighted average slope are well simulated but with a light bias. The average slope profile of the simulations looks like the real one, but the very fine variations aren’t well simulated. For Shreve order and average distance to outlet, the distribution of the real network is contained between the minimum and maximum distribution of the simulations but the global metrics don’t tally. Indeed, the aspect more branched of the simulations observed on Fcorresponds to a greater number of sources: 120 in the mean against 104. The real network favors main streams in comparison with the simulations (more low orders and brutal augmentation in the higher orders). The distribution of the ditch distance to outlet shows that the simulations are closer to outlet. Nevertheless, the distribution of slope, length, Shreve order and distance to outlet are globally well simulated without specific constraint
Figure 3. Metrics describing the network
in the simulation algorithm. That reveals that the choices are limited: more ditches are simulated on the downstream areas and where the density of field boundaries is higher which correspond to the reality. Then, by respecting approximately the distribution in space, the distribution of slopes is also respected.
G. Hydrological response of simulated networks
Each simulated network is used to perform a run of MHYDAS. All the simulated networks have the same outlet and consequently, drain the same area. It allows comparing the hydrographs where differences are only due to transfer function (G). The hydrographs corresponding to the simulations seem well centered on the real one and the variability looks rather low. Indeed the peak discharge is comprised between 0.71 and 0.92 m3/s with a mean of 0.81
m3/s, which represents some variations of -9% and +17 %
compared to the real network (0.79 m3/s). The conclusion is
the same for the lag time with a minimum at 202 min, a maximum at 253 min (variations of -13% and +10% compared to the real value of 231 min) and an average of 228 min. Simulations produce a satisfying hydrological response at the outlet with a rather low variability.
Figure 4. Hydrographs at the outlets
A simple catchment hydrology has been explored in this study (homogeneous rain and land cover, ditch height, width and manning…), in order to facilitate the link between the hydrological response of each network with its descriptors and then, to explain the observed variability. In fact, in order to propagate the diffusive wave, MHYDAS calculates celerity for each ditch thanks to Manning Strickler formula. Thus, celerity increases when the ditch slope increases. Besides, if we assume that time for the transfer on the surface units is relatively low comparing to the transfer time in the network (dense network with low downstream slope), the lag time is closely related with the average distance from ditch to outlet. These statements are confirmed when looking at the correlation coefficients between average distance to outlet or Shreve weighted average slope and lag time: 0.69 and -0.49. For the peak discharge, the correlation is less strong with only 0.30 in both cases. By contrast, the number of sources doesn’t seem at all to be correlated with hydrologic variables (0.16 with lag time and 0.02 with peak discharge). A similar result is observed for the total length, which is expected since the simulations algorithm is parameterized for allowing only slight variations of this parameter.
DISCUSSIONANDCONCLUSION
The network generation method succeeds to simulate some ditch networks that look comparable to the actual one. Without any more constraint than total network length, the network generation method produces satisfying results with regards to a few geometrical and topographical metrics.
Concerning the hydrological response, the variability of the simulated hydrographs at the outlet is similar to the error on the measurement of a discharge (more or less 15 % for the ten year floods, Lang et al. 2006). Then, this uncertainty on the outlet discharge due to the uncertainty on the network mapping seems reasonable. In addition, slopes distributions and average distance to outlet induce this uncertainty. To minimize it, constraining locally an artificial drainage density could be interesting in order to refine the distribution of the network in space and its resulting distribution of slopes.
As a first study, the hydrological response has been studied only at the outlet of the catchment and in a very
simplified case so that it remains questions regarding scale issues, acceptable incertitude on the drainage density and complexity on real catchment hydrology. A scale change should be realized in order to study the hydrological response per subcatchment. Variability will be certainly more important owing to the difference in drained area for a given ditch. The second point to investigate is on the drainage density criterion. If its real value isn’t known contrary to our case study, how accurate should be its estimation? Lastly, the case of a complex real situation has to be studied. Land cover, rain and ditches parameters (height, manning., etc.) would be distributed in space and would result in the variation of lots of parameters at the same time. A more global sensitivity analysis should be performed.
REFERENCES
Bailly, J.S., 2007. Méthodes de spatialisation de réseaux arborescents et orientés par simulations conditionnelles : Application aux réseaux de fossés de paysages viticoles. PhD Thesis, University of Montpellier, France, 204p.
Bailly, J.S. et al., 2008. Agrarian landscapes linear features detection from LiDAR: application to artificial drainage networks. International Journal of Remote Sensing, 29(12), 3489.
Branger, F., 2007. Utilisation d'une plate-forme de modélisation environnementale pour représenter le rôle d'aménagements hydro-agricoles sur les flux d'eau et de pesticides. Application au bassin versant de la Fontaine du Theil (Ille et Vilaine). PhD Thesis, University of Grenoble, France, 238p.
Carluer, N. & Marsily, G.D., 2004. Assessment and modelling of the influence of man-made networks on the hydrology of a small watershed: implications for fast flow components, water quality and landscape management. Journal of Hydrology, 285(1-4), 76-95. Fabre, J. et al., 2010. OpenFluid: a software environment for modelling
fluxes in landscapes. In LANDMOD2010. Montpellier, France. Forman, R.T.T. & Baudry, J., 1984. Hedgerows and hedgerow networks in
landscape ecology. Environmental Management, 8(6), 495-510. Grayson, R.B. et al., Advances in the use of observed spatial patterns of
catchment hydrological response. Advances in Water Resources, 25(8-12), 1313-1334.
Herzon, I. & Helenius, J., 2008. Agricultural drainage ditches, their biological importance and functioning. Biological Conservation, 141(5), 1171-1183.
Lagacherie, P. et al., 2006. An indicator approach for describing the spatial variability of artificial stream networks with regard to herbicide pollution in cultivated watersheds. Ecological Indicators, 6(2), 265-279.
Lagacherie, P. et al., in press. Geo-MHYDAS: A landscape discretization tool for distributed hydrological modeling of cultivated areas. Computers & Geosciences, (36).
Lang, M. et al., 2006. Incertitudes sur les débits de crue. Available at: HAL:http://hal.archives-ouvertes.fr/hal-00453772/en/ [Accessed April 6, 2010].
Moussa, R., Voltz, M. & Andrieux, P., 2002. Effects of the spatial organization of agricultural management on the hydrological behaviour of a farmed catchment during flood events. Hydrological Processes, 16(2), 393-412.
Shreve, R.L., 1966. Statistical Law of Stream Numbers. The Journal of Geology, 74(1), 17-37.