Analytics for Financing Drug Development
by
David Erik Fagnan
B.Sc., University of British Columbia (2009)
MMath, University of Waterloo (2011)
Submitted to the Sloan School of Management
in partial fulfillment of the requirements for the degree of
Doctor of Philosophy in Operations Research
at the
MASSACHUSETTS INSTITUTE OF TECHNOLOGY
June 2015
c
○
Massachusetts Institute of Technology 2015. All rights reserved.
Author . . . .
Sloan School of Management
May 5, 2015
Certified by. . . .
Andrew W. Lo
Charles E. and Susan T. Harris Professor
Director of Laboratory for Financial Engineering
Thesis Supervisor
Accepted by . . . .
Dimitris Bertsimas
Boeing Professor of Operations Research
Co-Director, Operations Research Center
Analytics for Financing Drug Development
by
David Erik Fagnan
Submitted to the Sloan School of Management on May 5, 2015, in partial fulfillment of the
requirements for the degree of
Doctor of Philosophy in Operations Research
Abstract
Financing drug development has a particular set of challenges including long develop-ment times, high chance of failure, significant market valuation uncertainty, and high costs of development. The earliest stages of translational research pose the greatest risks, which have been termed the “valley of death” as a result of a lack of funding. This thesis focuses on an exploration of financial engineering techniques aimed at addressing these concerns. Despite the recent financial crisis, many suggest that se-curitization is an appropriate tool for financing such large social challenges. Although securitization has been demonstrated effectively at later stages of drug development for drug royalties of approved drugs, it has yet to be utilized at earlier stages.
This thesis starts by extending the model of drug development proposed by Fer-nandez et al. (2012). These extensions significantly influence the resulting perfor-mance and optimal securitization structures. Budget-constrained venture firms tar-geting high financial returns are incentivized to fund only the best projects, thereby potentially stranding less-attractive projects. Instead, such projects have the po-tential to be combined in larger portfolios through techniques such as securitization which reduce the cost of capital.
In addition to modeling extensions, we provide examples of a model calibrated to orphan drugs, which we argue are particularly suited to financial engineering tech-niques. Using this model, we highlight the impact of our extensions on financial performance and compare with previously published results. We then illustrate the impact of incorporating a credit enhancement or guarantee, which allows for added flexibility of the capital structure and therefore greater access to lower costing cap-ital. As an alternative to securitization, we provide some examples of a structured equity approach, which may allow for increased access to or efficiency of capital by matching investor objectives. Finally, we provide examples of optimizing the Sortino ratio through constrained Bayesian optimization.
Thesis Supervisor: Andrew W. Lo
Title: Charles E. and Susan T. Harris Professor Director of Laboratory for Financial Engineering
Acknowledgments
I gratefully acknowledge my advisor Andrew Lo for his guidance throughout my research, and for starting my involvement with financing for drug development which has been a particularly rewarding subject that I have enjoyed contributing to. Thank you for encouraging me the work on problems that interest me, and for your passion for the future of biomedical funding and clinical research.
In addition, I acknowledge Roger Stein, for serving in a co-advisor capacity through-out my research, for his persistence in pushing me to work hard, for his extensive comments during my thesis preparation, and for his friendship. Thank you for ac-tively checking in on my progress, for involving me in your research, and for valuing my input. Your communication and guidance have been invaluable to me.
I would also like to thank my collaborators, Jose-Maria Fernandez for his detailed analysis in preparation of the original megafund work and for his friendship; Austin-Gromatzky for his extensive literature review for our orphan work and assistance in developing assumptions for parameters; Nora Yang for her many hours of data collection and discussions on parameter assumptions for the NCATS work; John McKew for his keen insights and constructive feedback on the NCATS work; Adlar Kim for his insights for extending the MATLAB software in practical directions; and the many panel discussants at conferences organized by Andrew Lo who are too many too name. I also thank my thesis committee: John Guttag and Dimitris Bertsimas who have encouraged me to see the big picture.
My friends and colleagues in the MIT Operations Research Center have made Boston an amazing experience, and have served as a support system through difficult periods in my personal life. Finally I am grateful to my wife Rhea, and my family for their endless support and encouragement, without which I would not have finished this thesis.
Contents
1 Introduction 21
1.1 Contributions . . . 22
1.2 Organization of Thesis . . . 23
1.3 Pharmaceutical Business Models . . . 25
1.3.1 Private Equity and Venture Capital . . . 25
1.3.2 Public Equity . . . 26
1.3.3 Non-Profits and Venture Philanthropy . . . 27
1.3.4 National Center for Advancing Translational Science . . . 28
1.3.5 Drug Royalty Investment Company . . . 28
1.3.6 Crowd-funding . . . 29
1.3.7 Business Development Company . . . 30
1.3.8 Open-source Drug Discovery and Public-Private Partnerships . 31 1.3.9 Megafund or Research-Backed Obligations . . . 32
1.4 Portfolio Theory . . . 32 1.5 Securitization . . . 34 1.5.1 Financial Crisis . . . 35 1.5.2 Historical Examples . . . 36 1.5.3 Structure . . . 37 2 Mathematical Model 41 2.1 Example - Single Period . . . 43
2.2 Multi-Period Model . . . 44
2.3.1 Probability of Technical & Regulatory Success . . . 45 2.3.2 Costs . . . 47 2.3.3 Duration . . . 49 2.3.4 Valuation . . . 50 2.4 Modeling Dependence . . . 53 2.4.1 Technical Correlation . . . 53 2.4.2 Valuation Correlation . . . 56 2.5 Simulation Framework . . . 57 2.6 Simulation Results . . . 59
2.7 Predictive Power and Low Budgets . . . 61
3 Orphan Diseases 63 3.1 Introduction . . . 63
3.2 Suitability for RBO financing . . . 65
3.3 Model Calibration . . . 66
3.4 Simulation Results - Published . . . 67
3.5 Simulation Results - Updated . . . 69
3.6 Discussion . . . 69 4 Guarantee 73 4.1 Introduction . . . 73 4.2 Pricing . . . 74 4.2.1 No-Arbitrage Approach . . . 75 4.3 Simulation Results . . . 76
5 NCATS Portfolio Analysis 79 5.1 Introduction . . . 79
5.2 TRND and BrIDGs Overview . . . 80
5.3 TRND Project Identification and Selection . . . 82
5.4 Data Analysis . . . 83
5.6 Simulation Calibration . . . 85
5.7 Simulation Setup . . . 86
5.8 Simulation Results . . . 87
5.9 Discussion . . . 90
6 Structured Equity 93 6.1 Structured Equity Model . . . 94
6.2 Example - IID Deterministic . . . 96
6.3 Example - Valuation uncertainty sub-optimality . . . 97
6.4 Simulation Results . . . 97
6.5 Discussion . . . 99
7 Optimization of Financing and Transaction Structure 101 7.1 Numerical Results . . . 103
7.1.1 Optimizing Fernandez et al. (2012) . . . 105
7.2 Discussion . . . 109
8 Conclusions 111 A Orphan Supplementary Materials 115 A.1 Orphan Sensitivity Analysis . . . 115
A.2 Orphan Simulation Validation . . . 118
B NCATS Supplementary Materials 121 B.1 Simulation Calibration . . . 121
B.2 Valuation Panel and Calibration . . . 122
B.3 Simulation Framework . . . 123 B.4 Sensitivity Analysis . . . 125 B.4.1 Clinical-Time Distribution . . . 125 B.4.2 Valuation Distribution . . . 126 B.4.3 Probability of Success . . . 129 B.4.4 Valuation . . . 129
List of Figures
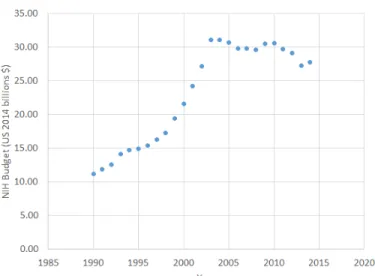
1-1 NIH budget adjusted to 2014 US$ using the GDP price deflator. . . . 28 1-2 Depiction of cash waterfall for securitization with a single senior tranche,
junior tranche and equity tranche. . . 38
2-1 Depiction of Markov-chain for multi-period model of drug development. Withdrawn and approval are absorbing states, and the cost, time and valuation distributions are calibrated to each state separately. . . 45 2-2 Plot of log-normal probability density function by phase and for
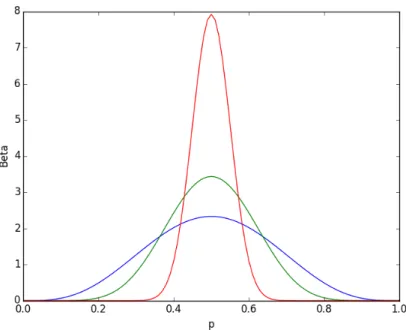
regu-latory approval times, calibrating to obtain similar mean as in [1] and ranges as per [39]. . . 51 2-3 Beta distribution with 𝛼 = 𝛽 with values 4.5 (blue), 9.5 (green) and
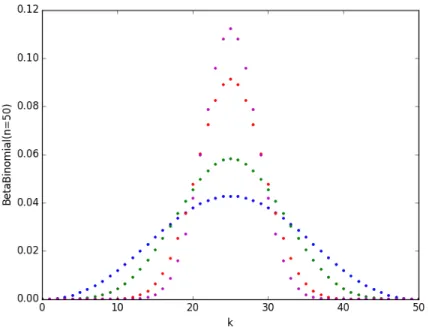
49.5 (red), corresponding to beta-binomial correlation of 10%, 5% and 1%, respectively. . . 54 2-4 Beta-Binomial distribution with 𝑛 = 50, 𝛼 = 𝛽 with correlation 10%
(blue), 5% (green) and 1% (red) and the standard binomial distribution (magenta). . . 55 2-5 Flow-chart of simulation framework for RBO megafund. . . 58
2-6 Simulated performance assuming success rates for 125 projects are drawn from independent identical beta distributions and known prior to investment. The blue (yellow) curve shows the performance as-suming the portfolio includes the best (worst) 𝑛 projects, while the orange shows the performance when projects are indistinguishable to the investor. We also provide the performance of RBO financing (grey), assuming 5% senior debt (3% coupon) and 35% junior debt (5% coupon). 62 5-1 Valuation panel estimates (log-scale) for NCATS rare disease
portfo-lio compared to literature estimates[22] based on project phase alone. Vertical bars represent the range of the respondents lower and higher values. Projects are sorted by the phase at which they were valued from Lead Optimization through to Phase 3. . . 85 5-2 Simulation calibration: weighted averaging of parameter estimates based
on NCATS rare disease portfolio, valuation panel and literature estimates[22], using prior belief weights (details provided in the Appendix B). . . . 86 6-1 Simulated performance metrics comparing traditional and structured
equity. The blue/gray lines are traditional equity at 8 and 16 com-pounds, respectively. The yellow/red lines are low/high risk equity pieces using an ordered success scheme that acquires 16 compounds. 98 7-1 Plot of the Gaussian prior mean using a Sortino ratio objective function
targeting a return of 10%. 125 Pre-clinical projects are acquired and sold upon completion of Phase 1, using the setup described in Chapter 2. The axes are the fraction of the junior and senior debt, which are constrained to a maximum of 50% arbitrarily in order to narrow the search space. The shaded circles are the sampled points after sampling 65 times, and the star represents the best single simulation run, which is not necessarily significant. . . 104
7-2 Plot of the Gaussian prior mean using a Sortino ratio objective function targeting a return of 10%. 60 Pre-clinical and 60 Phase 1 projects are acquired and sold upon completion of Phase 1, using the setup described in Chapter 2. The axes are the fraction of the junior and senior debt, which are constrained to a maximum of 50% arbitrarily in order to narrow the search space. The shaded circles are the sampled points after sampling 96 times, and the star represents the best single simulation run, which is not necessarily significant. . . 105 7-3 Plot of the Gaussian prior mean of the constraint controlling the
proba-bility of selling for interest coverage. The x markers represent sampled points that failed to meet the constraint, while the circles satisfied the constraint. The parameters and setup used are the same as in Fernan-dez et al., with the modifications discussed in Chapter 2. . . 106 A-1 Comparison of approximately optimized RBO structure (solid blue
line) with an all-equity structure (dotted black-line) for pair-wise asset correlation ranging from 5% to 40%. Compounds are intended to be sold upon completion of Phase 2 trials. . . 116 A-2 Comparison of an approximately optimized RBO structure (solid blue
line) with an all-equity structure (dotted black-line) for increasing scale from 6-100 compounds with a proportional increase in capital (215−3600 million). Compounds are intended to be sold upon comple-tion of Phase 2 trials. . . 117 A-3 Comparison of fixed capital structure RBO structure (solid blue line)
with an all-equity structure (dotted black-line) where the clinical prob-abilities of success shown in Table 3.1 are scaled by a relative variable amount. A capital of $575 is used to purchase 8 pre-clinical and 8 phase 1 compounds. The RBO structure uses $86.25 million senior tranche and $115 million junior tranche. Compounds are intended to be sold upon completion of Phase 2 trials. . . 118
B-1 Plot of density functions for various Phase 2 clinical trial time distri-butions calibrated by matching first and second moments. The black line shows the mean of all distributions. . . 126 B-2 Plot of density functions for various Phase 3 valuation distributions
calibrated using first and second moment matching. The black line shows the mean of all distributions. . . 128 B-3 Performance metrics for RBO structure (without guarantee) from
Ta-ble 5.2 for adjusted probability of success applied to all stages. . . 129 B-4 Performance metrics for RBO structure (without guarantee) from
List of Tables
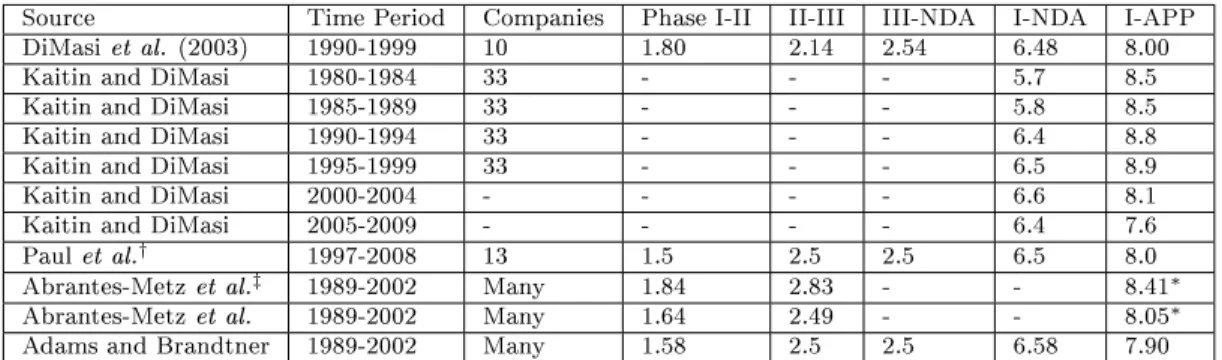
1.1 Example parameters of an RBO securitization structure using a single senior tranche, junior tranche and equity tranche. Bond amortization is done in equal parts every 6 months during the amortization period. Protection for the bonds is provided by . . . 38 2.1 Success rates by clinical phase and FDA review for various studies and
data time periods. * self-originated compounds ** all-indications (lead
and non-lead)*** includes success or failure of NDA review. †oncology
compounds . . . 46 2.2 Mean costs ($ millions) for drugs entering each phase of development
-adjusted to 2014 dollars using the US Gross Domestic Product (GDP) deflator. . . 48 2.3 Clinical trial and regulatory review times (years) by phase or
approx-imated from IND-filing date, where sources not marked use only suc-cessful trials. Dashes mark entries not provided by the authors. †does
not provide transparent information on methodology. ‡ includes both
successful and failed trials. * confirmed with author to include NDA
filing times. . . 49 2.4 Average duration (years) by phase and approximate log-normal
param-eters calibrated to obtain ranges similar to that reported by Kaitin and DiMasi[39]. . . 50
2.5 Debt capacity and probability of achieving a fixed number of successes for varying project size (𝑛) assuming pairwise correlation of 𝜌 = 0.1 under a beta-binomial model for successful compounds. Assumptions follow the example in 2.1. . . 55 2.6 Parameters used by Fernandez et al. (2012) for their cancer megafund
simulation[24]. . . 59 2.7 Results for a simulated cancer megafund using parameters based on
Fernandez et al. (2012), compared to results using the log-normal clin-ical trial times developed here, and correlated beta draws to determine success. We present an additional set of simulations in the third col-umn, highlighting the lower performance of the pre-clinical compounds due to the assumptions of upfront payments. . . 60 3.1 Simulation parameters calibrated to orphan diseases. . . 66 3.2 RBO simulation results from Fagnan et al (2014) for orphan diseases
using a target selling phase of Phase 3. . . 68 3.3 Results using the parameters established by Fagnan et al. (2014) with
allowance for earlier flows to equity. The second column provides a comparison with log-normal clinical trial times, and the final column includes both log-normal clinical trial times and scientific correlation following Chapter 2. . . 70 3.4 Average duration by phase and approximate log-normal parameters
calibrated for orphan diseases based on the same relative variance as-sumptions described in Chapter 2. . . 70 4.1 Summary statistics of a cancer megafund simulation for all-equity (AllEQ)
and debt-and-equity-financed (RBOs) cases, with (GT) and without (NoGT) guarantees of principal. 60 Pre-clinical and 60 Phase 1 com-pounds are acquired using $3,000 million in equity. . . 77 5.1 TRND application criteria and weights. . . 82
5.2 RBO performance for one all-equity structure, one senior/junior tranche structure, and one guaranteed senior tranche structure. Each structure acquires only pre-clinical compounds with a target goal of reaching Phase 3 and a maximum horizon of 11 years. . . 88
7.1 Sortino ratio, mean internal rate of return, and downside risk using a target return of 10% for three structures: an all-equity structure with no debt financing, a junior-debt (5% coupon, amortized equally over 3 periods from year 5) structure using 28% debt, and a senior-debt (3% coupon, amortized equally 3 periods from year 3.5) structure using 15% debt. 125 Pre-clinical compounds are acquired at the start of the simulation using $2650 million. . . 104
7.2 Sortino ratio, mean internal rate of return, and downside risk using a target return of 10% for three structures: an all-equity structure with no debt financing, a junior-debt (5% coupon, amortized equally over 3 periods from year 5) structure using 28% debt, and a senior-debt (3% coupon, amortized equally 3 periods from year 3.5) structure using 15% debt. 60 Phase 1 and 60 Pre-clinical compounds are acquired at the start of the simulation using $2900 million. . . 106
7.3 Sortino ratio, mean annualized return on equity, and downside risk using a target return of 8% using parameters from Fernandez et al. (2012). The results of optimizing the Sortino ratio of annualized return on equity through bayesian optimization (BO) are compared to the structure proposed by the authors. Two optimizations are performed, each with at least 50 samples, with no IC constraint and a 1% IC constraint, respectively. . . 107
7.4 Sortino ratio, mean internal rate of return, and downside risk using a target return of 8% using parameters from Fernandez et al. (2012). The results of optimizing the Sortino ratio of internal rate of return through bayesian optimization are compared to the structure proposed by the authors. The optimizations is performed with at least 50 sam-ples, with no IC constraint. . . 108 7.5 Sortino ratio, mean internal rate of return, and downside risk using a
target return of 12% using parameters from Fernandez et al. (2012). The results of optimizing the Sortino ratio of annualized return on equity through bayesian optimization (BO) are compared to the struc-ture proposed by the authors. Two optimizations are performed, each with at least 50 samples, with no IC constraint and a 1% IC constraint, respectively. . . 108 7.6 Sortino ratio, mean internal rate of return, and downside risk using a
target return of 15% using parameters from Fernandez et al. (2012). The results of optimizing the Sortino ratio of internal rate of return through bayesian optimization are compared to the structure proposed by the authors. The optimization is performed with at least 50 samples, with no IC constraint. . . 109
A.1 Results using the parameters from Table 3.3 (third column), but with infinite cash (first column) so that trials are always immediately funded, and deterministic trials (second column) so that trials always complete within the simulation horizon. . . 119 A.2 Results using the parameters from Table 3.3 (second column), but with
deterministic valuations (first column) to isolate Jensen’s inequality type effects. . . 120
B.1 Observations of NCATS rare-disease projects including success, dura-tion, and cost of trials. In addition success rates include trials com-pleted by collaborators after completing the BrIDGs program. Projects included are those that have undergone a change in status since be-coming active, particularly the first round of TRND and BrIDGs rare-disease projects. . . 121 B.2 Prior weight given to literature data for orphan diseases [22], with lower
values relying more on the NCATS observations. Larger weights are used for later stages, where there are fewer observations. . . 122 B.3 Posterior estimates of parameters for simulating an NCATS rare-disease
megafund, combining literature estimates for orphan diseases [22]. . . 122 B.4 Summary of key comments from valuation panel respondents when
asked to value a portfolio of rare-disease projects within NCATS. . . 123 B.5 Panel median valuations compared with literature estimates for orphan
diseases [22]. Posterior estimates used in simulation are taken to be equally weighted between the panel and literature estimates. . . 123 B.6 Parameters and distributions used in simulation framework for an NCATS
rare-disease megafund. Missing entries are not used in this set of sim-ulations, which carries projects only to completion of Phase 2. . . 124 B.7 Performance metrics for RBO structure (without guarantee) from
Ta-ble 5.2 for alternative clinical trial time distributions. . . 127 B.8 Calibrated parameters for valuation distributions at Phase 3. . . 127 B.9 Performance metrics for RBO structure (without guarantee) from
Ta-ble 5.2 for alternative valuation distributions. . . 128 B.10 Performance metrics for RBO structure (without guarantee) from
Ta-ble 5.2 for adjusted probability of success applied to all stages. . . 130 B.11 Performance metrics for RBO structure (without guarantee) from
Chapter 1
Introduction
Over the past 60 years, pharmaceutical research productivity has declined by approx-imately half roughly every 9 years as measured by the number of drugs approved by the Food and Drug Association (FDA) per billion US dollars spent. [80]. The financial performance in the industry has also waned, resulting in a loss of roughly $850 billion in shareholder capital among the top 15 companies in the industry from December 2000 to February 2008[30]. Another hurdle faced by the industry is the patent cliff caused by the expiration of existing patents resulting in an estimated $113 billion of sales being lost to generic substitution between 2010-2014[73]. Regulatory hurdles are also increasing, with the growth of FDA regulations by word count in-creasing at about 12,000 words per year according to data analyzed by Regulatory Focus [26]. The budget for the NIH has also declined over the past decade, reaching an all time low (GDP adjusted) in 2013 as illustrated in Figure 1-1.
Numerous recent works address the economics of drug development, including estimates of historical success rates of clinical projects[17, 73, 36], clinical/research costs[73], clinical development times[39], and revenue forecasting[8]. Each problem poses a significant individual challenge. Incorporating all into a unified solution is critical to the decision making process. Currently, however, industry participants do not take an integrated decision making approach. Typically, they decide on project funding based on a single risk-adjusted net-present value (rNPV) estimate, assuming a fixed cost of capital[85]. This thesis will argue that this metric oversimplifies the
inherent complexities and uncertainties. This can lead to suboptimal decisions both socially and financially. A forthcoming work on optimization of pharmaceutical port-folios suggests that one reason the pharmaceutical industry is behind on quantitative decision making is because of the historical ease of drug approvals[71].
The work of Fernandez et al. is the first academic work to combine estimates of all of these inputs with the intention of deciding how to raise funds for drug development. More broadly, there are numerous analytical and optimization works focused on the biomedical industry that deal with improving clinical trial design and selection such as adaptive clinical trial design[57], optimal trial size of a portfolio of drugs[72], optimal selection of next best trial[5], and optimal indication sequencing among many other contributions.
This thesis continues the work of Fernandez et al. (2012) and focuses on exploring new financing models for drug-development, through the use of financial engineering. In particular, we focus on quantifying the risk profile of a portfolio of pharmaceutical projects by exploring historical industry success rates, costs, clinical/stage duration, and valuations. After extending the Fernandez et al. model for the financing of a portfolio of pharmaceutical projects, we characterize the risk-return tradeoff as a function of the financing vehicle, and provide some examples of optimizing such a vehicle.
1.1 Contributions
We briefly discuss some of the major contributions of our work. A detailed discussion is deferred to subsequent parts of the thesis.
∙ Model of Drug Development: We propose novel extensions to recent work in modeling the financing of drug development including non-Markovian clinical trial times, enhanced performance measures, and new measures of correlation, each of which has a significant impact on the translational and financial per-formance compared to previously published work. Furthermore, we provide a first demonstration of the impact of prediction power on such models and
high-light the potential impact (stranding of drug projects) that this creates on the industry and society as a whole.
∙ Drug Price Policy: Amidst a literature review of pharmaceutical risks in-cluding costs, success rates, clinical duration, we provide new insights that connect the published works of several authors. This literature is particularly important, since it plays a critical role in the discussion of pricing policy. We believe our model and simulation framework provides a novel alternative to the usual way of addressing pricing or reimbursement policy decisions for drug development. Unlike the standard approach which ignores all uncertainty, our framework captures uncertainty in key inputs including costs, timing, success rates, and valuations. Furthermore, although the usual approach uses a sim-plistic cost of financing (discount rate), we instead characterize the risk-return tradeoff which depends on the structure of the financing vehicle.
∙ Simulation Optimization: We propose a novel example application (securi-tization) of simulation optimization under unknown constraints through recent work in Bayesian Optimization. This framework is robust to changes in mod-eling assumptions and may be appropriate for securitization applications more broadly.
1.2 Organization of Thesis
In the remainder of Chapter 1 we will first present a broad overview of current business and financing models, highlighting their differences, advantages, and disadvantages. We then provide a brief discussion of portfolio theory and securitization as it pertains to our work.
Subsequently in Chapter 2, we will discuss a model for drug development based on Fernandez et al., with an extensive discussion of the literature of estimates around historical success rates, clinical costs, trial/stage duration, and valuation that serve as inputs to the model. In particular, we provide key extensions to the original
model that serve to model reality in a number of ways, including a more detailed correlation model, potential for early cash-flows to equity (as measured by internal rate of return), and generalized distributions for clinical trial times. We show that the impact of these changes is significant economically, particularly to the timing and performance of the resulting financial vehicle.
Following this, in Chapters 3-5, we summarize three published joint works in-tended to provide key improvements to the model. Chapter 3 discusses the particular challenges of financing orphan diseases in addition to developing a calibrated model that suggests, given current policies, orphan drugs are a particularly attractive finan-cial investment. Additionally the model presented therein has the potential to play a role in the discussion of orphan drug reimbursement policy due to its novel approach. Chapter 4 highlights the added benefit of incorporating an external credit en-hancement or guarantee, potentially a key component to obtaining bond ratings from a ratings agency. Without such ratings, the practical implementation of a securitiza-tion structure may be extremely difficult, since many institusecuritiza-tional investors may be restricted to rated instruments.
Although the works of Fernandez et al. (2012) and Fagnan et al. (2013,2014) are important, they are based on literature estimates of average success. To address this, Chapter 5 demonstrates an approach using a live portfolio of drugs, constructing a model specific to the rare disease portfolio at the National Center for Advancing Translational Science (NCATS). These published results incorporate the updated performance measures and clinical trial times discussed in Chapter 2 as well as the external credit enhancement or guarantee discussed in Chapter 4
As an alternative to securitization, in Chapter 6 we discuss joint work on a struc-tured equity approach, and characterize the risk-return tradeoff with multiple in-vestors with differing objectives or utility. This may be particularly important when combining philanthropic investment or in the context of longevity risk-hedging[47].
Finally, in Chapter 7 we provide some examples of optimizing the financing vehicle through bayesian optimization subject to constraints on the probability of the bond instruments, and reliance on interest coverage protection rules. We show that the
addition of debt financing can significantly increase an objective function such as the Sortino ratio for the investor, without changing the underlying portfolio.
We conclude with a discussion of our findings in Chapter 8.
1.3 Pharmaceutical Business Models
Recent discussion has suggested that the challenges and conflicts presented by a science-based business are not satisfied by the traditional business model of the in-dustry which typically uses venture capital financing or public/private equity[75]. In this section we provide a comprehensive comparison of many of the models currently observed in practice.
Desired characteristics of various pharmaceutical business models include: inde-pendent scientific, financial, and legal oversight; access to several sources of capital (e.g. debt,equity,government,philanthropy, and the crowd); unfiltered access to the set of potential projects; the ability to take on high-risk early-stage projects with potentially poor or uncertain expected profits; and diversification of risks across di-mensions including indication, modality, and collaborating organization.
1.3.1 Private Equity and Venture Capital
Since the Small Business Investment Act of 1958, venture capital or professionally managed private equity has been a cornerstone to funding early stage start-ups and new ventures. Such venture capitalists often sit on the boards of ventures they fund, retaining rights beyond mere ownership and providing management desired by their investors.
While venture capital is capable of providing valuable expertise and indepen-dent oversight, its time horizon and funding model is most appropriate for liquidity horizons of a few years[76]. In addition, sufficient diversification on pharmaceutical projects alone becomes challenging at the scale of a typical VC-fund, given the esti-mated average cost of more than $1 billion to develop a successful drug[73]. Indeed, some venture funds such as Polaris Partners ($3 billion under management) maintain
an equal investment in both technology and healthcare in order to provide greater diversification and faster liquidity events.
Regardless, the overarching goal in pharmaceutical venture capital is to seek out only the most promising projects in terms of scientific and financial potential, for which investors typically expect high returns (e.g. a minimum of 20% expected re-turns).
1.3.2 Public Equity
While public-equity has been successful at raising large amounts of capital, valua-tion of pharmaceutical R&D is particularly challenging at all stages of the project life-cycle[8], and it is unreasonable to expect a typical public equity investor to be able to ascertain whether projects are worth continued investment[76]. Guedj and Scharfstein (2004) suggest that smaller firms may be less willing to abandon their only project compared to later stage firms with multiple projects, correlating to in-creased failure of projects in Phase 2 and lower likelihood of advancing to a Phase 3 trial[34]. Financial analysts have often suggested that large pharmaceutical com-panies should be in the business of acquiring projects, rather than doing their own drug-discovery research[37, 42]. Pisano argues that the structure of public equity was never designed for companies with assets largely composed of R&D, where valuation based on earnings is unrealistic. There is little doubt that publicly traded firms are under various pressures by investors to make particular decisions, that may be driven more by financing than translational merit.
The added benefit to more innovative structures over traditional public equity is the ability to diversify across all aspects of the projects, including the company performing the research, individual career risk, and organizational structures. This is encouraging if the end goal is a structure in which decisions are made truly based on the translational merit alone with financing issues secondary, influencing the nature of the underlying financing.
1.3.3 Non-Profits and Venture Philanthropy
Non-profits and other mission-driven organizations play a critical role in the drug development ecosystem. The largest of the US charitable organizations, the Bill and Melinda Gates Foundation, maintains an endowment of $42.3 billion as of 24 November 2014, and its global health division started The Global Fund to Fight AIDS, Tuberculosis and Malaria in 2002. The Global Fund disbursed an average of $3.2 billion per year from 2009-2013[29]. Other examples within the biomedical space include the Broad Institute, which has received over $700 million in funding from the Broad Foundation. Recently, the Broad institute also received a single gift of $650 million from the Stanley Family Foundation intended to fund research on the genetics of psychiatric disorders, which is the second largest non-anonymous donation of 2014[74].
Although a significant portion of non-profit financing goes towards basic research, the focus of this thesis will be on translational and clinical medicine. During this portion of development, research is approaching, entering or completing clinical trials where non-profit organizations also play a significant role. One example includes the Leukemia and Lymphoma Society which focuses on blood cancers, and spends a portion of its budget funding clinical trials. A particularly innovative foundation is the Cystic Fibrosis foundation, which created an affiliated nonprofit named the Cystic Fibrosis Foundation Therapeutics, Inc. (CFFT) to maintain investments in a drug development pipeline across a spectrum of drugs and technologies, returning the royalties to be reinvested in the mission[27]. In addition, the foundation has also sold future royalty streams to Royalty Pharma (See Section 1.3.5), providing over $3 billion in cash and reducing its potential risk exposure due to future sales performance[79].
The Gates foundation also employed financial engineering in its transactions by appointing Lion’s Head as the fund manager for the Global Health Investment Corp. (GHIC) and offering investors a partial guarantee of up to 60% of their invested capital[28]. The fund invests in a number of projects including drugs and vaccines.
Figure 1-1: NIH budget adjusted to 2014 US$ using the GDP price deflator.
1.3.4 National Center for Advancing Translational Science
The National Center for Advancing Translational Sciences (NCATS) is the newest National Institute of Health (NIH) institute, founded in December 2011. Its mission is to “catalyze the generation of innovative methods and technologies that will enhance the development, testing and implementation of diagnostics and therapeutics across a wide range of human diseases and conditions”. Of the NCATS annual budget ap-propriated by Congress for 2015 ($635 million), over 74% will go towards the Clinical and Translational Sciences Awards (CTSA) program supporting a national network of medical research institutions. The remainder of the budget is spread across several initiatives within the NCATS Division of Pre-clinical Innovation. Our focus will be on two of these programs: TRND and BRIDGs, which directly support early stage drug discovery and development, and are discussed in detail in Chapter 5.1.3.5 Drug Royalty Investment Company
Drug royalty investment companies are primarily privately owned companies that aim to acquire ownership interests in approved or late-stage pharmaceutical assets. A recent case study by Lo and Naraharisetti focused on Royalty Pharma, the largest of such companies, which was founded in 1996 by Pablo Legorreta and now manages
over $10 billion in assets. After initial success, Royalty Pharma began to use debt-financing in 2003 and currently uses an even mixture of about $4 billion each in debt and equity significantly reducing its cost of capital. They have issued multiple tranches with varying interest rates, maturities and sizes, totalling over $3 billion, and ranging from LIBOR+2.25 to LIBOR+3% notes[45].
Royalty Pharma acquires potential assets both by reaching out to academic and research institutions and from requests from interested parties looking to sell royalties. The management team performs all research and due-diligence prior to presenting a particular project to a separate seven-person investment committee[45]. To further assess the scientific merit, patent-strength, and sales-projects, it consults key opinion leaders, clinicians, patent attorneys, specialists, doctors, investment banks and other sources[45]. In addition to diversifying its portfolio, Royalty Pharma also provides various options for sellers including synthetic or accelerated royalties[45]. Like ven-ture capital, drug royalty investment companies have the potential to be protected against misaligned incentives such as career risk through independent oversight and decision making. At the same time, their scale, diversity and use of debt make them significantly distinct.
1.3.6 Crowd-funding
Crowd-funding is a relatively new form of funding that aims to appeal to the general public through website-based platforms. Similar to some non-profit organizations, crowd-funding often has low average donation amounts from a large number of people. According to a report by crowd-sourcing.org, the 2012 crowd-funding market raised $2.7 billion, successfully funding over a million campaigns with a forecasted increase of over 80% for 2013[51].
Although crowd-funding shares some similarities to charities/non-profits and social-networking, key differences include the ability to provide reward or investment-based funding, relatively short time horizons (weeks) to contribute, partial transparency in contribution levels of other backers, and the notion of an allornothing system -contributions are often refunded if the project fundraising goal is not reached.
Impor-tantly, the contributions are not refunded if the project later fails. Recent applications include the music industry (e.g. SellaBand), independent movies, fashion designers, and many other start-ups [66]. Illustrative of the power of crowd-funding, the card game Exploding Kittens designed by Elan Lee and others raised nearly $9 million during its 30 day campaign, well in excess of its goal of a mere $10,000 after reaching 1000% funded within an hour.
In the biomedical space, a number of donation-based campaign portals have fo-cused on cancer research, and a recent study by Dragojlovic and Lynd (2014) aggre-gated over 125 such public campaigns[18]. They show that despite many portals with relatively low average amounts per campaign, Indiegogo had an average per-campaign goal of $447,938 with the second-lowest average donation of $87 among those included by the authors, suggesting that large amounts can be raised through small average donations.
Because of recent legislation through the JOBS Act, increased flexibility for equity-based crowdfunding could dramatically change the nature of crowdfunding. The im-plementation has been delayed by the SEC with a target date of October 2015 because of concerns with investor protection, including speculation that the crowd-funding legislation may increase the opportunity for fraud[25]. Clearly, it is unreasonable to expect the general public to possess the expertise to evaluate the scientific or financial risks of particular cancer or drug development projects.
While the JOBS Act is being finalized, Poliwogg is one example of a crowdfunding platform that targets accredited investors, allowing them to invest in private health-care companies that run campaigns on their platform. The Poliwogg platform clearly states that its "investments are intended for investors who do not have a need for liquidity and can afford to lose their entire investment"[77].
1.3.7 Business Development Company
Created in the 1980s, a business development company (BDC) is a designation that allows public firms to invest in small to mid-size businesses. While similar to venture-capital or private-equity funds, they may be more accessible to smaller investors
allowing shares to be bought on the open market, allowing for potential liquidity. Data from Closed-end Fund Advisors (CEFA) lists 51 BDC closed-end funds with combined market cap of $35 billion and an average market yield of 9.3%[49], signifi-cantly lower than that of desired VC returns. One example is the Harris and Harris Group that has elected BDC status since 1995, and invests primarily in nanotechnol-ogy companies with areas including medical devices, pharmaceutical manufacturing, drug discovery and delivery.
In the context of drug development, a BDC has immediate potential as an alter-native to crowdfunding in that it may provide access to a broader range of investors; potentially increasing capital availability and efficiency. As for venture capital, BDCs have a potential for direct involvement through supervision or sitting on the board of companies in which it invests, and in fact significant managerial assistance is often a requirement. In addition, it can achieve financial benefits through diversification and leverage which could allow for a lower cost of capital.
1.3.8 Open-source Drug Discovery and Public-Private
Part-nerships
Recent successes in the software industry through open-source collaboration include Wikipedia, Firefox, and Linux have motivated similar approaches in drug discov-ery, particularly for neglected tropical diseases[61]. Similar collaboration has been achieved through various Public-Private Partnerships (PPP) such as the Medicines for Malaria Venture, TB Alliance, and International AIDS Vaccine Initiative, each with a relatively small number of staff. Notably, they are able to operate on relatively low budgets, and have achieved costs per phase dramatically lower than traditional Big Pharma for a number of reasons including using others’ unused capacity and out-sourcing to developing countries[61]. Another example of a public-private partnership is the Israeli Life Sciences Fund, which resembles a typical venture capital model, with the addition of government funding to boost returns for investors by taking a first-loss position.
1.3.9 Megafund or Research-Backed Obligations
One alternative, proposed by Fernandez et al. [24], is the idea of using financial en-gineering through diversification and securitization (See Section 1.5) to fund biomed-ical products, creating what they call a ‘megafund’ or Research-Backed Obligations (RBO) structure. The megafund idea shares some similarities with drug royalty in-vestment companies, such as Royalty Pharma, Inc., which manages billions in assets and uses approximately an even mixture of debt and equity[45]. The royalty business focuses where the risks are lower (primarily on approved royalties), while the mega-fund model demonstrates potential at earlier stages of drug development as well [24], where the need for financial innovation is greatest. This thesis focuses on exploring financial engineering techniques for financing structures for the biomedical industry, of which the megafund or RBO type structure are a primary example.
1.4 Portfolio Theory
Modern portfolio theory, first developed by Markowitz in 1952, formulates the tradeoff between expected return and risk for a portfolio of securities[50]. Rather than sug-gesting a particular portfolio, Markowitz characterized the set of efficient portfolios, or those portfolios with the lowest variance given a particular expected return. Since its development, a number of criticisms have arisen including, normally distributed returns, not taking into account higher moments of the distribution, weights can be continuous, and many others which have resulted in extensions to the original model, but will not be our focus here. Our focus will be on projects where free choice of portfolio allocation (ie., corresponding portfolio weights), may not be possible. In particular, we assume that the project must receive full funding to go forward, and that efficient (or optimal) portfolio allocation may not be possible. This leads to a non-linear dependence of return on the amount of resources allocated, which is not something modeled by the broader financial portfolio literature[46].
Although we will primarily focus on highlighting potential options in terms of risk-reward tradeoff by comparing multiple potential structures and scales, we provide an
example in Chapter 7 of choosing between such structures by optimizing a specific risk-return metric known as the Sortino ratio. The Sortino ratio was proposed as a modification of the well-known Sharpe ratio, and has been shown to be superior in the presence of skewness[9]. The Sharpe ratio (𝑆𝑅) is simply,
𝑆𝑅 = E[𝑅𝑝] − 𝑟𝑓 𝜎𝑝
, (1.1)
the mean return of the portfolio E[𝑅𝑝]subtracted by the risk free rate (or possibly
an-other benchmark) divided by the standard deviation 𝜎𝑝 of the portfolio. The Sortino
ratio, 𝑆, is instead scaled by the downside semi-deviation, which we will refer to as simply downside risk,
𝑆 = E[𝑅𝑝] − 𝑟𝑡
DR , (1.2)
where the downside risk (DR) is given by, DR =
√︃ ∫︁ 𝑟𝑡
−∞
(𝑟𝑡− 𝑟)2𝑓 (𝑟)d𝑟, (1.3)
where 𝑟𝑡 is the target return.
Note that our use of the Sharpe and Sortino ratio departs from the traditional setting where returns are realized across a time-series. Instead, here we use these ratios across a single distribution which is estimated via data and models. Typically, one would fit such a distribution using historical realized returns across time. Finally, although we use the Sortino ratio as an example in this thesis, one could imagine using a different objective function depending on investor preferences. Such alternatives include the Omega ratio, upside-potential ratio, or many other custom risk-return metrics. As mentioned, we use the Sortino ratio due to its popularity and ability to differentiate between upside and downside risk.
1.5 Securitization
Securitization is the pooling of a set of assets, combined with the tranching of the re-sulting portfolio into slices of increasing risk. Commonly, the first tranche is referred to as the senior tranche, the second the junior/mezannine tranche, and the final tranche is the equity tranche. In practice there may be many tranches correspond-ing to many levels of associated risk. Debt tranches typically are assigned a bond rating, which is provided by an independent Credit Ratings Agency (CRA) such as Moody’s Investors Service and Standard & Poor’s. Our focus in this thesis will be on cash-flow securitization (also referred to as true-sale securitization), as opposed to synthetic securitization which does not require a transfer of assets. Broadly, cash-flow securities are referred to as Asset Backed Securities (ABS)1, subclasses of which
in-clude mortgage-backed securities (MBS), collateralized debt obligations (CDO), and patent-backed securities (PBS).
The key players involved in securitization transactions include: the originator, a bankruptcy-remote special purpose vehicle (SPV) or issuer, servicer, and occasion-ally an arranger, trustee, and guarantor. The originator acquires or already owns the assets to be pooled, who then transfers the assets to the issuer (e.g. BioPharma Royalty Trust) which issues and sells the securities either privately or on the open-market. The role of the servicer is to perform the payment notifications to borrowers, generate informational reports, and monitor or manage the assets. In our context the servicer may also perform the actual research or clinical trials. The arranger is typically an investment bank, that helps design the specific tranche-levels and specifications according to investor preferences, while the guarantor provides an ex-ternal credit-enhancement by guaranteeing the principal and interest payments. The servicer and originator may be the same, particularly due to shared required asset expertise. Lastly, the trustee is charged with protecting the investors and monitoring the servicer, notifying the investors of any breach of protection criteria and ensuring compliance.
1Asset backed securities are sometimes defined more narrowly as non-mortgage or collateralized
Motivation for securitization is a reduction in cost of capital, increased access to long-term capital through lower-risk institutional investors who may not otherwise be able to participate.
In addition to risks particular to certain types of securitization structures, several risks and misaligned incentives are common across any such structure. In particular, both investment managers who earn a performance fee, and may also be responsible for assembling the portfolio encouraging a risk-seeking behavior to boost expected returns, a risk referred to as Moral hazard.
Recently, Bugg-Levine et al. published an article on the Harvard Business Re-view discussing securitization in the context of social enterprises, suggesting the ex-traordinary capability of such a tool, and its ability to balance philanthropic and non-philanthropic investment. The authors discuss several recent examples of financ-ing innovation, includfinanc-ing loan guarantees by the Bill and Melinda Gates Foundation, pooling by Switzerland-based BlueOrchard, and social impact bonds launched in the UK. They admit that stakeholders in this sector must build the market structure to harness the power of such tools, and that this is a crucial step toward creating a greener, healthier, and more equitable world.
1.5.1 Financial Crisis
Although we will not discuss the crisis in detail, the type of financial engineering proposed here is related to the tools used in mortgage securities that were partly blamed for the financial crisis of 2008. Since the crisis, the SEC has taken action against 175 individuals or entities, totaling almost $2 billion in penalties; the most severe of these charges fall under the description “Concealed from investors risks, terms, and improper pricing in CDOs and other complex structured products:”[82]. Importantly, it was typically the abuse of this technology, rather than the technology itself that is the focus of the blame, suggesting preventative measures be improved. There is little doubt that if used fairly and appropriately, these tools can have an extraordinary impact. Although the structures proposed in this thesis can potentially be abused, as in the case of the crisis, we do not believe that this warrants abandoning
such a technique. Instead, we believe that with proper monitoring, transparency, and independent oversight, we can safeguard against past mistakes and mitigate risks such as moral hazard and intentional misuse.
1.5.2 Historical Examples
The idea of intellectual property (IP) and patent-backed securities has been around for at least two decades. While structurally similar to other asset-backed securities, uncertainty around the nature of the assets, patent valuation, potential risk of litiga-tion, and risk of technological obsolescence can lead to increased difficulty. Further specific risks to securitization in the pharmaceutical industry include risk of regulatory or statutory changes.
An early example of securitization in the music industry came in 1997 when musi-cian David Bowie issued $55 million in asset-backed securities by selling ten years of future royalties to Prudential Insurance Company offering a 7.9% interest rate with 15-year maturity[10]. The bonds were backed by about 300 songs, and a credit en-hancement provided by EMI Music was needed to obtain an A3 investment grade rating by Moody’s Investor Service. This illustrates that there has long been a prece-dent of combining credit-enhancements in practice.
The movie industry performed at least a dozen securitization transactions from 1995-2005, ranging from $300 million to $1.1 billion in size, most of which received an Aaa rating from Moody’s[19]. These transactions include future film portfolio transactions, for which the securitization was needed to support the cost of produc-tion, which is encouraging, in that it is a practical example of securitization of assets that have yet to reach production. After performance of these deals was roughly in line with Moody’s expectations, newer structures intended to transfer more risk to investors became more popular, suggesting an increased appetite for securitization.
Recent examples of securitization in the biomedical sector include Royalty Pharma’s securitization in 2000, using only a single asset which later failed to meet expectations. Following this, Royalty Pharma issued a second securitization in 2003 using a pool of 13 drugs (only nine of which were generating royalties at the time of issuance) for
which it received an Aaa rating from Moody’s and an AAA rating from Standard and Poor’s as a result of insurance provided by MBIA Insurance Group[63]. Despite its use at later stages of development, such a securitization has yet to be performed on a portfolio including early stage assets where the financial need is greatest. In an effort to demonstrate that the typical risks could be quantified, the work of Fernandez et al. (2012) was the first publication to attempt to build a model to assess the associated risks at early stages[24]. Another recent example by Alafita and Pearce characterized the risks associated with securitization of solar power purchase agreements, assessing the impact of contract policy on securitization structures[4]. The authors proposed overcollateralization as a credit enhancement, which is simply issuing securities with face value below the value of assets, and explored the impact of policy implications on securitization structures.
The topic of applying securitization in practice even when valuation is difficult has been discussed previously, including an example by Nathan Myhrvold, co-founder of Intellectual Ventures, proposed the use of patent-backed securitization as a possibil-ity for funding invention, envisioning an open-market for patents[62]. Finally, since at least early 2012, it has been highlighted how important such tools could be for large social problems, despite poor public perception recently[7]. This is particularly important for financing translational medicine, where non-profit financing currently plays a significant role, and could potentially be incorporated into a securitization structure.
1.5.3 Structure
This section will discuss the details of the securitization structure that is a focus of this thesis, including subordination through a standard cash waterfall approach, interest coverage ratios, amortization of tranches, and credit enhancements through external guarantees. Each tranche has a defined face value, amortization schedule (set of maturities), coupon amount, and subordination level, an example illustration is provided in Table 1.1.
Tranche Capital Amortization (years) Coupon Interest-Coverage Ratio
Senior 275 3.5-4.5 3 1.75
Junior 550 5-6 5 2.75
Equity 1925 — — —
Table 1.1: Example parameters of an RBO securitization structure using a single senior tranche, junior tranche and equity tranche. Bond amortization is done in equal parts every 6 months during the amortization period. Protection for the bonds is provided by
Figure 1-2: Depiction of cash waterfall for securitization with a single senior tranche, junior tranche and equity tranche.
cash payments for principal and interest agreements first, prior to lower tranches. Figure 1-2 depicts this for a structure with three tranches, senior, junior, and equity. Amortization schedule refers to the repayment of principal, which in this case occurs gradually over time unlike "‘bullet pay"’ bonds which are typically paid back all at once upon maturity. For simplicity, as in the work by Fernandez et al. (2012), we will assume that repayment for each tranche occurs in equal installments from a start and end date. Typically, as in Table 1.1, we also assume that payments to principal are non-overlapping, meaning that payments to principal on a lower tranche are only allowed once all higher tranches are retired.
Potential protection mechanisms and criteria are often used to decrease risk of default. One such test is the over-collateralization (OC) test, which looks at the ratio of asset value, compared to the principal value of the current tranche and any tranches preceding it in the waterfall. Typical values range from slightly above 1 to 3. The interest coverage test, instead compares the ratio of liquid assets and tranche coupons. In our setting of research-backed securities, we will typically only include cash on hand in all coverage test checks, since the value of the asset portfolio is subject to significant uncertainty. If at any time during the life of the securitization a test is violated (i.e. not enough cash is available to meet the requirement), subsequent action to address the violation must be taken. Possible action may include partial or complete liquidation of the assets.
Chapter 2
Mathematical Model
Following the model proposed by [24], we illustrate the basic mechanisms by which diversification and financial engineering can facilitate large-scale innovation, using a stylized model of drug development. Although we start with a stylized model for intuition, we ultimately use a detailed1 Monte Carlo simulation framework to
model the drug development process. In particular, suppose the R&D process for investigating the therapeutic potential of a single biochemical compound requires 𝐶 in capital at date 0 and the outcome is only determined 𝑇 years later. If successful, the compound will be sold at time 𝑇 for an amount 𝑉 . In general 𝑇 , 𝑉 and 𝐶 may all be possibly-correlated random variables and could be project-specific.
For a set of 𝑛 projects, we define the cost, time and values to be 𝐶𝑖, 𝑇𝑖 and 𝑉𝑖
respectively. If we model the outcome of the R&D process for each project as a Bernoulli trial 𝐼𝑖 with probability 𝑝𝑖 of success (𝐼𝑖= 1) and probability 1−𝑝𝑖 of failure
(𝐼𝑖= 0), then the probability of at least one success in 𝑛 independently and identically
distributed (IID) trials is: Pr (︃ 𝑛 ∑︁ 𝑖=1 𝐼𝑖 ≥ 1 )︃ = 1 − Pr (︃ 𝑛 ∑︁ 𝑖=1 𝐼𝑖 = 0 )︃ = 1 − (1 − 𝑝)𝑛 . (2.1)
1We attempt to validate the details of the framework through partial unit testing and external
validation. It is however possible, due to the interactions of parameters and assumptions, that there are undetected bugs in the software which could impact the simulation performance. We provide an example of such testing in Appendix A.2.
In general (See Section 2.4.1) we allow for correlation among the success of trials, which we will refer to as technical correlation
In the traditional equity model investors receive the sum of values 𝑉𝑖 for all
suc-cessful projects. If we denote the number of successes as 𝑁 =
𝑛
∑︁
𝑖=1
𝐼𝑖, (2.2)
the total sum of cash flows to the investor 𝑉 is then 𝑉 =
𝑁
∑︁
𝑖=1
𝑉𝑖, (2.3)
where 𝑁 is a random variable.
When the project valuations 𝑉𝑖 are distributed with mean 𝜇𝑖 and variance 𝜎2𝑖, the
expected cash to the investor is
E[𝑉 ] = ∑︁ 𝑗=1 Pr(𝑁 = 𝑗) 𝑗 ∑︁ 𝑖=1 𝜇𝑖, (2.4)
while the variance can be split into two terms by using the law of total variance, Var[𝑉 ] = E [︃ Var [︃ 𝑁 ∑︁ 𝑖=1 𝑉𝑖|𝑁 ]︃]︃ + Var [︃ E [︃ 𝑁 ∑︁ 𝑖=1 𝑉𝑖|𝑁 ]︃]︃ . (2.5)
For the case where the 𝑉𝑖 are independent and identically distributed with mean 𝜇
and variance 𝜎2, the total mean and variance are,
Var[𝑉 ] = E[𝑁 ]𝜎2+ Var[𝑁 ]𝜇2 (2.6)
E[𝑉 ] = E[𝑁 ]𝜇. (2.7)
When the trials are IID Bernoulli the variance simplifies to
while the mean is
E[𝑉 ] = 𝑛𝑝𝜇. (2.9)
2.1 Example - Single Period
In this example, investors acquire compounds prior to pre-clinical testing, and plan to sell them upon completion of phase I trials. As a result the probability of success is on the order of 𝑝 = 0.5, see Section 2.3.1 for a detailed discussion of historical success rates. Notably, the probability of success will be much lower when carrying drugs further along the drug development process, as will be the case in some of our examples later in the thesis.
Investing in only a single project, the expected upfront cost (𝐶) of trials and acquisition is about 24 million[73, 24], with a valuation (𝑉 ) of approximately 82 million on completion of Phase I trials. As such, the annualized expected rate of return (𝑅) and standard deviation of returns (𝜎𝑅) when investing in 𝑛 projects are
𝑅 = (︂ 𝑝𝑉 𝐶 )︂1/𝑇 − 1, (2.10) and 𝜎𝑅= √︀𝑝(1 − 𝑝)𝑉 𝐶 √ 𝑛𝑇 . (2.11)
Assuming the parameters above, with a time horizon of 𝑇 = 5 years, for a single compound (𝑛 = 1) the expected return is 𝑅 = 11.3% and the standard deviation is 𝜎𝑅= 76.4%. For a portfolio of 50 compounds, which requires a capital of 1.2 billion,
the standard deviation becomes 76.4/√50 = 10.8%.
Consider now the example of 𝑛 = 50 compounds, where we wish to issue debt financing. Applying the binomial formula, the probability of at least 14 successes, as-suming no correlation, is 99.95%, which would allow for 14×82 million = 1.148 billion to be paid to the debt holders after 7.5 years. Assuming a zero-coupon bond with 5% annual rate, the present value of the debt would be 1.148/(1.05)7.5 billion =
return on equity is 24.6%, with standard deviation 43.1%. In addition, a guarantee for the debt could be purchased, which is discussed in detail in Chapter 4.
More generally, given a level of default 𝛿 we define the debt capacity 𝐹*(𝛿)to be
given by the solution to the equation, max
𝐹 Pr (𝐾 < 𝐹/𝑉 ) ≤ 𝛿 , (2.12)
where 𝐹 is the future value of the debt and 𝐾 is the random variable representing the number of successful projects.
2.2 Multi-Period Model
Of course, drugs actually have to go through a number of stages of development, each associated with increasing costs, and stage-dependent durations and probabilities of success. For the multi-period case, we start from the model developed by Fernandez et al. [24], where we define a multi-state Markov-chain with states corresponding to the phase of drug development, depicted in Figure 2-1. We make a slight modification for the clinical trial times, for which we allow a generalized distribution and use the Markov chain only to determine success outcomes. This causes an important change in the timing distributions, which were implicitly geometric in past works. Our definitions of the phases of development follow most closely to Paul et al (2010), where pre-clinical is the final stage prior to clinical studies, and is performed after earlier drug discovery including target to lead optimization. Although we do not focus on earlier stages in this thesis, the framework is flexible to do so, provided sufficient data.
2.3 Model Inputs
In this thesis we will focus primarily on industry-wide averages, but in practice once an originator assembles a specific portfolio, an analysis tailored to the specific set
Figure 2-1: Depiction of Markov-chain for multi-period model of drug development. Withdrawn and approval are absorbing states, and the cost, time and valuation dis-tributions are calibrated to each state separately.
of projects would be critical. We will provide some discussion of recent work on project-level analysis and predictions, including frameworks available in practice.
2.3.1 Probability of Technical & Regulatory Success
A number of studies have characterized the historical probabilities of success for clinical-trials across a number of dimensions including company size, therapeutic area, source of compound, biochemical profile, stage of development, lead vs non-lead in-dication, and others[13, 14, 41, 73, 15, 69, 36, 24]. Of the recent studies included in Table 2.1, the likelihood of approval (LOA) from start of Phase 1 is from 10-19% depending on the inclusion criteria, time period, and methodology. Of these studies, only Pammolli et al. and Paul et al. provide estimates of pre-clinical success rates, and their definitions of pre-clinical may be different as Pammolli et al. do not provide a clear definition.
Although DiMasi et al. (2010) find little support of changing success rates among the 50 largest pharmaceutical firms over the time period from 1993-2004, Pammolli et al. (2011) find decreasing success rates across a broader set of companies over a similar period, which corresponds to a shift of R&D to riskier areas of development and near doubling of the fraction of small-organization projects. More recently, Hay et al. (2014) provide an extremely comprehensive set of success rates using 4451
Source Time Period Number. ofCompounds Phase I-II II-III III-NDA NDA-APP
Dimasi et al. 1993-2004 1738 71% 45% 64% 93%
Dimasi et al.* 1993-2004 1225 65% 40% 64% 93%
Paul et al. 1997-2008 NA 54% 34% 70% 91%
Fernandez et al.† 1990-2010 733 72% 45% 59% 95%
Kola and Landis 1991-2000 NA 68% 38% 55% 77%
Abrantes-Metz et al. 1989-2002 NA 80.7% 57.7% 56.7%***
Hay et al. 2003-2011 4451 66.5 39.5% 67.6% 86.4%
Hay et al.** 2003-2011 4451 64.5% 32.4% 60.1% 83.2%
Table 2.1: Success rates by clinical phase and FDA review for various studies and data time periods. * self-originated compounds** all-indications (lead and non-lead) *** includes success or failure of NDA review. † oncology compounds
compounds, highlighting the impact of lead vs non-lead indication status impacting the results significantly.
In each of these studies, censorship occurs when trials used in each dataset have yet to advance or withdraw, and past work has shown that the expected duration of failed trials is longer which could create bias[1]. The approach taken to account for censorship includes survival analysis (or a generator matrix)[14, 24], duration modeling[1], and ignoring or justifying the potential bias[69, 36, 15]. Although Fer-nandez et al. (2012) used a generator matrix approach to handle censoring, they assumed time-homogeneity, an unrealistic assumption for clinical trial times, some-thing that we address in this thesis by using generalized distributions for clinical trial duration.
Likelihood of approval and phase transition rates also vary significantly by ther-apeutic area. DiMasi (2010) measure that the LOA for self-originated compounds from Phase 1 ranges from 8.2% for the central nervous system (CNS) to 23.9% for systemic anti-infective[15]. Collectively, therapeutics in oncology are exceptionally low, achieving only a Phase 1 LOA of 7% according to Hay et al. 2014, and 5% according to Kola and Landis[36, 41]. Multiple studies have also documented the impact of drug class, including both lead and non-lead indications, Hay et al. find small molecules have the lowest Phase 1 LOA at 7.6%, compared to large molecules, mono-clonal antibodies, non mono-clonal proteins, and vaccines which range from 13-15%[36].
While cancer compounds have particularly low success rates, rare or orphan drugs have been particularly successful over the past decade. We discuss rare and orphan diseases in more detail in Chapter 3. According to Hay et al. (2014), the P1 LOA for all orphan drugs is around 33%, and as high as 44.5% for non-oncology orphan drugs. The significant increase occurs mostly at the P1 and P2 stages, and is relatively similar to non-orphan drugs at P3 and during regulatory review.
For the purposes of this thesis, we will incorporate uncertainty around the prob-ability of success at a given phase through a Beta distribution, and in practice, one would want to further calibrate the Beta distribution to project-level factors. Follow-ing the work of Hay et al. (2014), a service has been available through BioMedTracker which provides baseline probability estimates for new clinical trials with subjective adjustments based on project-specific data with live updating.
2.3.2 Costs
Over the past three decades, two notions of pharmaceutical development costs have emerged: 1) out-of-pocket and 2) capitalized costs. Out-of-pocket costs refer only to the dollar values actually spent on clinical trials, and often even neglect fixed costs, while capitalized costs are intended to include the opportunity cost of time and the cost spent on failed drugs. A recent review article written by Morgan et al. (2011) tried to perform a systematic review of past published work, collecting thirteen published articles of which the majority had issues with confidentiality and lack of transparency, leading the authors to conclude that it is impossible to assess validity and reliability[60]. Adams and Branter (2006) seemingly claimed to reproduce the approximate findings of DiMasi et al. (2003) using public data. Unfortunately, it appears the authors re-used the survey data of DiMasi et al. and only verified the portion of the calculations arising from timing and success rates. A later work published by the same authors in 2010 attempted to address this through a new approach, estimating the marginal cost of an additional drug, but ultimately ran into difficulty recreating reasonable estimates of cost per phase[3]. Despite this, results from these published works are often used in policy discussions and have impacted


![Figure 2-2: Plot of log-normal probability density function by phase and for regulatory approval times, calibrating to obtain similar mean as in [1] and ranges as per [39].](https://thumb-eu.123doks.com/thumbv2/123doknet/13994808.455277/51.918.171.724.369.795/figure-probability-density-function-regulatory-approval-calibrating-similar.webp)

![Table 2.6: Parameters used by Fernandez et al. (2012) for their cancer megafund simulation[24].](https://thumb-eu.123doks.com/thumbv2/123doknet/13994808.455277/59.918.132.785.112.498/table-parameters-used-fernandez-et-cancer-megafund-simulation.webp)
