HAL Id: hal-02736962
https://hal.inrae.fr/hal-02736962
Submitted on 2 Jun 2020
HAL is a multi-disciplinary open access
archive for the deposit and dissemination of sci-entific research documents, whether they are pub-lished or not. The documents may come from teaching and research institutions in France or abroad, or from public or private research centers.
L’archive ouverte pluridisciplinaire HAL, est destinée au dépôt et à la diffusion de documents scientifiques de niveau recherche, publiés ou non, émanant des établissements d’enseignement et de recherche français ou étrangers, des laboratoires publics ou privés.
Heritability and Genetic Variation of Plant Biomass,
Transpiration, and Water Use Efficiency for an Apple
Core-Collection.
G. López, Benoit Pallas, Sébastien Martinez, Pierre-Eric Lauri, Jean-Luc
Regnard, Charles Eric Durel, Evelyne Costes
To cite this version:
G. López, Benoit Pallas, Sébastien Martinez, Pierre-Eric Lauri, Jean-Luc Regnard, et al.. Heritability and Genetic Variation of Plant Biomass, Transpiration, and Water Use Efficiency for an Apple Core-Collection.. 14. EUCARPIA Symposium on Fruit Breeding and Genetics, Jun 2015, bologne, Italy. 437 p., �10.17660/ActaHortic.2017.1172.59�. �hal-02736962�
Heritability and genetic variation of plant biomass,
transpiration, and water use efficiency for an apple
core-collection
G. Lopez1, B. Pallas1, S. Martinez1, P.E. Lauri1, J.L. Regnard2, C.E. Durel3 and E. Costes1
1INRA, UMR 1334, AGAP CIRAD-INRA-Montpellier SupAgro Team, Architecture and functioning of fruit species,
TA A 96/03, 34398 Montpellier Cedex 5, France; 2Montpellier SupAgro, UMR 1334, AGAP
CIRAD-INRA-Montpellier SupAgro Team, Architecture and functioning of fruit species, TA A 96/03 34398 Montpellier Cedex 5, France; 3INRA, UMR 1345, IRHS, INRA-AgroCampus-Ouest-Université d’Angers, 42 rue G. Morel, BP 60057,
F-49071 Beaucouzé Cedex, France. Abstract
To study the heritability and genetic variation of plant biomass, transpiration and water use efficiency (WUE) in apple (Malus × domestica Borkh.), 193 genotypes from an INRA apple core-collection were evaluated in 2014. Four grafted replicates per genotype grown as one-year-old scions were studied in a high-throughput phenotyping platform (PhenoArch). Individual pot weight was recorded twice a day and irrigation was scheduled to maintain constant soil water content (SWC) and avoid any water stress during 46 days. Plant 3D pictures were automatically taken every two days. Analysis of pictures and pot weights differences allowed the estimation of whole-plant biomass and transpiration during the experiment. WUE was calculated as the ratio of accumulated biomass to transpiration. For each trait, we tested nine mixed models to account for the genetic effect and spatial variability inside PhenoArch. The Best Linear Unbiased Predictors (BLUPs) of genetic values were estimated after model selection. For each trait, broad-sense heritability (H2) was
calculated from variance estimates. Plant biomass, transpiration and WUE had H2
values of 0.76, 0.54, and 0.73, respectively. The H2 value of WUE is high enough to
consider that this trait is under genetic control in apple. The genetic variation of WUE indicated that apple genetic resources such as the INRA core-collection could be extremely useful to improve apple plant material for the use of water.
Keywords: high-throughput phenotyping, Malus × domestica Borkh., plant breeding, plant
images
INTRODUCTION
Apple (Malus × domestica Borkh.) is the most cultivated temperate fruit tree worldwide (Faostat, 2012). Thus, the genetic improvement of apple has been undertaken in multiple breeding programs. The most common objective is to select cultivars resistant to pests and diseases with high fruit quality (Brown and Maloney, 2003). Although the cultivation of plants with high water use efficiency (WUE) is becoming increasingly important in the context of feeding the increasing world population with lower availability of hydric resources, breeding for high WUE has received little attention in apple. To incorporate WUE in apple-breeding programs, it is first necessary to perform phenotyping studies to understand the genetic control and variation of WUE. While much information is available on the heritability and genetic variation of morphological (Segura et al., 2006) and physiological (Regnard et al., 2008; Lauri et al., 2011) traits that could be related with plant water use, no study has determined the heritability for whole-plant WUE and the traits used in its calculation (whole-plant biomass and transpiration). This lack of information in large collection of apple trees may be related to the difficulty of measuring whole-plant biomass and transpiration. Recent advances in high-throughput phenotyping technologies (HTPT)
318 biomass accumulation and transpiration of four replicates of 193 genotypes from an apple core-collection with the objective of studying the heritability and genetic variation of whole-plant WUE, biomass and transpiration. MATERIAL AND METHODS In this study we used plant material from an INRA apple core-collection located at the INRA experimental unit ‘DiaScope’ in Montpellier, France. The collection was originally developed by the IRHS-INRA in Angers (France) from a larger dessert apple germplasm corresponding to old French and European cultivars (Lassois et al., 2016). In 2014, one-year-old shoots for 193 genotypes from the collection were grafted onto M9 rootstock to generate eight replicates for each genotype (1,544 plants). On April 2, the rootstock+scion units were planted in nine litre pots in a greenhouse located in the ‘DiasScope’ unit. After bud break (~April 12), one shoot plant-1 was maintained. Plants were grown in the
greenhouse until June 3.
On June 3, plants were transferred into a greenhouse equipped with HTPT located in Montpellier (PhenoArch: http://bioweb.supagro.inra.fr/phenoarch). At this time plants had a mean value of 20 leaves. Plants were grown in PhenoArch from June 4 until July 19. PhenoArch conveyors allowed the movement of plants within the greenhouse, facilitating the repeated measurements of soil water content (SWC) from pot weighting and plant biomass from processed images under optimal environmental conditions for apple growth. During the experiment, mean air temperature, humidity, and vapour pressure deficit were similar from day to day with respective values of 24.77°C, 64.85%, and 1.13 kPa. The maximum values of photosynthetically active radiation oscillated between 300 and 745 μmol m-2 s-1. PhenoArch had 28 lines and 60 rows for each line. Line and row spacing in
PhenoArch was respectively 40 and 20 cm. The 1,544 plants from the core-collection and 24 pots without plants (for the calculation of soil evaporation) were located in PhenoArch according to a matched pairs design with four block-replicates. For each block, two replicates of the same genotypes were located in the same row in two consecutive lines. For each pair of rows, one replicate was grown under well-watered conditions and the other one was grown under water stress. This study presents results for well-watered plants, which received irrigation to maintain constant SWC at 70% of field capacity.
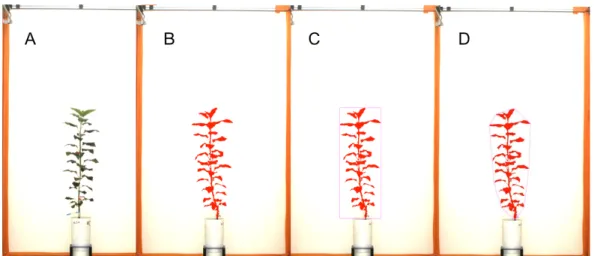
Aerial biomass for all the plants was determined every two days using plant images and models to estimate biomass from picture parameters. Three plant images were taken every two days for each plant by using a 3D Scanalyzer (LemnaTec, Wüerselen, Germany). The Scanalyzer recorded images from the side of each plant for two different rotations (0° and 90° view) and a view from the top (top view) (Figure 1). For each picture, three parameters were computed using the LemnaGrid software (LemnaTec, Wüerselen, Germany): Object Sum Area (OSA), Object Extend (OE), and Convex Hull Circumference (CHC) (Figure 1). After testing the assumptions of linear regression, a multiple linear regression was used to model the relationship between the picture parameters and measured plant biomass:
Plant biomass = ß0 + ß1 OSA_0° + ß2 OSA_90° + ß3 OSA_top + ß4 OE_0° + ß5 OE_90° + ß6
OE_top + ß7 CHC_0° + ß8 CHC_90° + ß9 CHC_top
where ß0 represents the coefficient for the intercept, and ß1 to ß9 the regression coefficients
for the pictures parameters. After taking the last plant image of plants (19 July), the regression coefficients of the models were calculated by measuring plant biomass for all the plants. The biomass model had a root mean square error of 18 g. Accumulated plant biomass during the experiment (A_Bio) was calculated as the difference between plant biomass at the beginning and at the end of the experiment.
Figure 1. Example of the frontal view (0° view) of a 3D plant image and parameters derived
from the image analysis. A: original plant image; B: ‘Object Sum Area’ (number of all pixels that have been identified as part of the plant); C: ‘Object Extend’ (number of pixels of the width and height of the bounding box that surrounds the plant); and D: ‘Convex Hull Circumference’ (number of pixels of the area of the smallest convex envelope that contains all pixels that have been identified as part of the plant). The same picture parameters were calculated for the second frontal view (90°) and the top view.
During the experiment, PhenoArch recorded pot weights (before and after each irrigation) twice a day. Plant evapotranspiration (ET) between irrigation events was calculated as the difference between the pot weight after a given irrigation and the pot weight before the subsequent irrigation. The ET values recorded during two consecutive complete days were summed-up. Soil evaporation (E) for pots without plants was computed using the same protocol. Plant transpiration (Plant_T) was calculated after subtracting the mean values of E of the empty pots located in the same blocks from the corresponding plants from the ET value. WUE was calculated as the ratio of accumulated plant biomass to plant transpiration during the experiment.
All the analyses were performed using the R software (R Development Core Team, 2012 version). Analyses of data were performed for 183 genotypes because all the plants for ten genotypes died during the experiment. For each trait, nine mixed effect models were developed to account for the genetic effect and the spatial heterogeneity inside PhenoArch (Table 1). For each model, the genetic effect was considered as a random effect. The different models differed only in the way they took spatial effects into account. The modelling of spatial effects was performed using the ‘asreml’ package of R software. Model 1 did not take into account any spatial effects. Models two, three and four took into account a fixed effect of blocks, lines, and rows, respectively. Models five, six, and seven considered a two-dimensional structures for the residuals using a first order autoregressive correlation models on the line direction only (model 5), on the row direction only (model 6) or in both directions (model 7). Two metric based models were also tested: a two-dimensional exponential model (model 8) and a two dimensional Gaussian model (model 9) to model the correlation between residuals. These models were based on kriging methods and assumed a decrease in the spatial correlation between residuals with increasing distance (Burrough, 1986). The Best Linear Unbiased Predictors (BLUPs) of genetic values were estimated by selecting the model with the lowest Bayesian Information Criterion (BIC). For each genotype its genetic value was calculated as the sum of the overall mean and its corresponding BLUPs. Variance estimates of the selected models were used to estimate the mean broad-sense heritability (H2) as:
320
where σ2G is the genetic variance, σ2R the residual variance, and n the number of replicates
genotype-1.
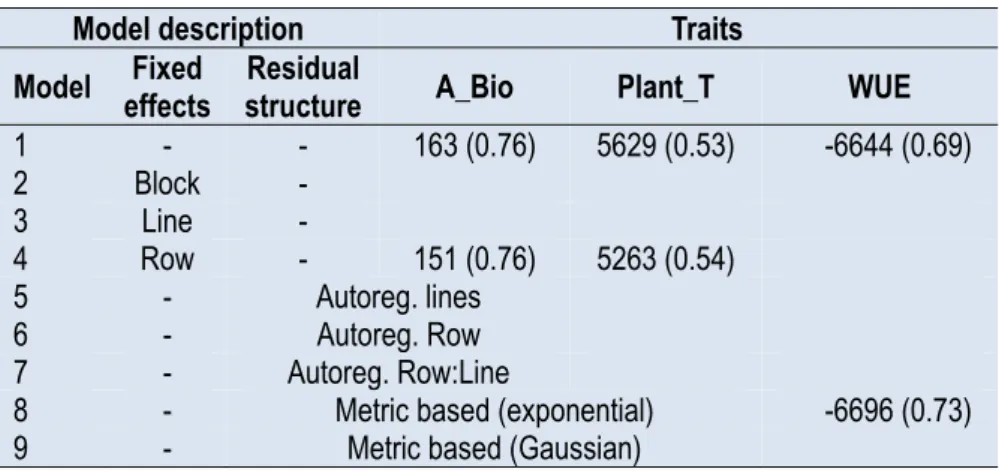
Table 1. Mixed models developed to account for the genetic effect and the spatial heterogeneity inside PhenoArch. The Bayesian Information Criterion (BIC) and heritability (in brackets) for the model with the lowest BIC and model 1 that did not take any special effect into account was presented for accumulated biomass (A_Bio), plant transpiration (Plant_T), and water use efficiency (WUE).
Model description Traits
Model effects Fixed structure Residual A_Bio Plant_T WUE
1 - - 163 (0.76) 5629 (0.53) -6644 (0.69) 2 Block - 3 Line - 4 Row - 151 (0.76) 5263 (0.54) 5 - Autoreg. lines 6 - Autoreg. Row 7 - Autoreg. Row:Line
8 - Metric based (exponential) -6696 (0.73)
9 - Metric based (Gaussian)
RESULTS
Among nine mixed models, only two models were selected by BIC minimization (Table 1). Model 4 containing the fixed effect of row position was selected for A_Bio and Plant_T, while model 8, containing an exponential spatial model for plant position was selected for WUE (Table 1). This result indicated that traits exhibited certain variability depending on the position of the plants in PhenoArch. However, the similarity between the selected models and the model that did not take any spatial effects into account (Model 1) also indicated that the effect of plant position was low. A_Bio, Plant_T and WUE had H2 values of
0.76, 0.53 and 0.73, respectively (Table 1). The genetic values for the traits had a relevant variability within the collection (Figure 2). The trait with the highest genetic coefficient of variation was A_Bio (0.22) (Figure 2). Plant_T and WUE had genetic coefficient of variation of 0.09 and 0.19, respectively (Figure 2).
Figure 2. Frequency distributions for accumulated biomass (A_Bio), plant transpiration
(Plant_T), and water use efficiency (WUE) for an apple core-collection grown under well-watered conditions. For each trait the mean broad-sense heritability and the genetic coefficient of variation (CV) was presented.
DISCUSSION
In this study HTPT were used to study the genetic control and variation of whole-plant biomass, transpiration, and WUE for 183 genotypes of an apple core-collection grown under
well-watered conditions. The H2 values from our study indicated that whole-plant WUE
could be under genetic control in apple (Table 1). H2 values were much higher than those
previously reported in sunflower (Adiredjo et al., 2014) and barley (Honsdorf et al., 2014). The high values in our study could be explained in part with the origin of the plant material. In our study, we used a core-collection, while in other studies whole-plant WUE was studied for recombinant inbred lines in sunflower (Adiredjo et al., 2014) and intogression lines in barley (Honsdorf et al., 2014). We may have therefore covered a higher genetic variability in WUE than in other studies. The fact that we used four replicates plant-1 may explain also the
high H2 values. The high H2 and genetic variation in WUE in apple is a promising result,
indicating that available apple genetic resources could be extremely useful to improve apple plant material for the use of water.
CONCLUSION
Under well-watered conditions, apple WUE had a mean broad-sense heritability of 0.73 and could be therefore implemented in breeding programs to improve apple plant material for the use of water. In future studies we would like to address the relative contribution of plant biomass and transpiration to WUE. A detailed study of plant morphology could also facilitate the identification of easy-to-measure traits correlated with WUE and/or morphotypes with high WUE. The response of the apple core-collection to water stress will be also addressed in future studies.
ACKNOWLEDGEMENTS
This study was partly funded by the EU 7th Framework Programme project
FruitBreedomics (N°265582). Gerardo Lopez received the support of the BAP-INRA department and the European Union, in the framework of the Marie-Curie FP7 COFUND People Programme, through the award of an AgreenSkills’ fellowship (under grant agreement N°267196).
Literature cited
Adiredjo, A.L., Navaud, O., Muños, S., Langlade, N.B., Lamaze, T., and Grieu, P. (2014). Genetic control of water use efficiency and leaf carbon isotope discrimination in sunflower (Helianthus annuus L.) subjected to two drought scenarios. PLoS ONE 9 (7), e101218. PubMed http://dx.doi.org/10.1371/journal.pone.0101218.
Brown, S.K., and Maloney, K.E. (2003). Genetic improvement of apple: breeding, markers, mapping and biotechnology. In Apples: Botany, Production and Uses, D.C. Ferree, and I.J. Warrington, eds. (CAB International), p.31–59.
Burrough, P.A. (1986). Principles of Geographical Information Systems for Land Resources Assessment (New York: Oxford University Press).
Coupel-Ledru, A., Lebon, E., Christophe, A., Doligez, A., Cabrera-Bosquet, L., Péchier, P., Hamard, P., This, P., and Simonneau, T. (2014). Genetic variation in a grapevine progeny (Vitis vinifera L. cvs Grenache×Syrah) reveals inconsistencies between maintenance of daytime leaf water potential and response of transpiration rate under drought. J. Exp. Bot. 65 (21), 6205–6218. PubMed http://dx.doi.org/10.1093/jxb/eru228.
Faostat. (2012) Citation database results, FAO. http://faostat.fao.org/faostat.
Honsdorf, N., March, T.J., Berger, B., Tester, M., and Pillen, K. (2014). High-throughput phenotyping to detect drought tolerance QTL in wild barley introgression lines. PLoS ONE 9 (5), e97047. PubMed http://dx.doi.org/1 0.1371/journal.pone.0097047.
Lassois, L., Denancé, C., Ravon, E., Guyader, A., Guisnel, R., Hibrand-Saint-Oyant, L., Poncet, C., Lasserre-Zuber, P., Feugey, L., and Durel, C.E. (2016). Genetic diversity, population structure, parentage analysis and construction of core collections in the French apple germplasm based on SSR markers. Plant Mol. Biol. Rep. http://dx.doi.org /0.1007/s11105-015-0966-7.
Lauri, P.E., Gorza, O., Cochard, H., Martinez, S., Celton, J.M., Ripetti, V., Lartaud, M., Bry, X., Trottier, C., and Costes, E. (2011). Genetic determinism of anatomical and hydraulic traits within an apple progeny. Plant Cell Environ. 34 (8), 1276–1290. PubMed http://dx.doi.org/10.1111/j.1365-3040.2011.02328.x
322
Segura, V., Cilas, C., Laurens, F., and Costes, E. (2006). Phenotyping progenies for complex architectural traits: a strategy for 1-year old apple trees (Malus x domestica Borkh.). Tree Genet. Genomes 2 (3), 140–151 http://dx.doi.org/10.1007/s11295-006-0037-1.