HAL Id: hal-02486307
https://hal.archives-ouvertes.fr/hal-02486307
Submitted on 26 May 2020
HAL is a multi-disciplinary open access archive for the deposit and dissemination of sci-entific research documents, whether they are pub-lished or not. The documents may come from teaching and research institutions in France or abroad, or from public or private research centers.
L’archive ouverte pluridisciplinaire HAL, est destinée au dépôt et à la diffusion de documents scientifiques de niveau recherche, publiés ou non, émanant des établissements d’enseignement et de recherche français ou étrangers, des laboratoires publics ou privés.
Consumer behaviour in the prediction of postharvest
losses reduction for fresh strawberries packed in
modified atmosphere packaging
Celine Matar, Valérie Guillard, Karine Gauche, Sandrine Costa, Nathalie
Gontard, Stéphane Guilbert, Sebastien Gaucel
To cite this version:
Celine Matar, Valérie Guillard, Karine Gauche, Sandrine Costa, Nathalie Gontard, et al.. Con-sumer behaviour in the prediction of postharvest losses reduction for fresh strawberries packed in modified atmosphere packaging. Postharvest Biology and Technology, Elsevier, 2020, 163, pp.1-11. �10.1016/j.postharvbio.2020.111119�. �hal-02486307�
Version postprint
Consumer behaviour in the prediction of postharvest losses reduction for fresh
1
strawberries packed in Modified Atmosphere Packaging
2
Matar Céline a, Guillard Valérie a, b, Gauche Karine c, Costa Sandrine c, Gontard Nathalie a, Guilbert
3
Stéphane a & Gaucel Sébastien * a
4
aJoint Research Unit Agro polymers Engineering & Emerging Technology
5
b Institut Universitaire de France (IUF)
6
c Joint Research Unit Market Organizations, Institutions & Actors’ strategies,
7
UM - INRA- Supagro & CIRAD, 2 place Pierre Viala, Bat 31, 34060 Montpellier cedex 01 France 8
* sebastien.gaucel@inra.fr 9
Abstract 10
MAP can maintain the storage life of products and thereby reduce food losses. However, the benefits 11
of MAP for reducing losses is not well quantified, especially in relation with practices in the postharvest 12
chain. This paper proposes an innovative approach, at the intersection between the domains of food 13
engineering, social sciences and humanities and computer science to quantify the real benefit of using 14
MAP in the postharvest chain of fresh strawberries. To take into account the diversity of postharvest 15
storage conditions and consumer practices on reduction of food losses, 132 scenarios for storage of 16
fresh strawberries were investigated with a numerical model and used as inputs to calculate the losses 17
generated in the postharvest chain as a function of product deterioration. Considering the probability of 18
occurrence of each scenario and consumer practices, the use of MAP instead of commercial macro-19
perforated packaging, would lead to 17 % reduction of losses on average. The losses reduction is low 20
because 50 % of consumers open the packaging before storing the fruit into the refrigerator, disrupting 21
the benefit of MAP before the fruit is consumed. Losses would be reduced by as much as 74 % if all 22
the consumers stored the strawberries in the fridge and kept the MAP intact. 23
Version postprint
MAP modelling tool; food loss reduction; consumer behaviour; supermarket; post-harvest scenarios; 25
fresh fruit and vegetables. 26
1 Introduction
27
Packaging, was recently identified as an essential element to address the key challenge of sustainable 28
food consumption and as a pillar of the reduction of food losses (Angellier-Coussy et al., 2013; 29
Licciardello, 2017). Among packaging technologies, modified atmosphere packaging (MAP) can 30
maintain storage life of products, and thus contribute to loss reductions (Belay et al., 2016; Chaix et al., 31
2015; Falagán and Terry, 2018; Peano et al., 2017). The MA is created by the fresh fruit or vegetables 32
(FFV) after packing due to product respiration and permeation through the film. At the steady state, a 33
so-called equilibrium MA (eMA) is reached that should be as close as possible to the optimal 34
recommended storage atmosphere to maintain product quality and safety (Guillaume et al., 2010). An 35
increase of storage life is expected to lead to a significant reduction of FFV losses especially at the 36
consumer stage. FFV losses represent 50%, with no less than 19% for the consumer stage (Gustavsson 37
et al., 2011). 38
Strawberries have limited storage potential due to their extreme tenderness, vulnerability to mechanical 39
damage, high respiration and transpiration rates, and their susceptibility to fungal spoilage, especially 40
Botrytis cinerea (Cagnon et al., 2013; Sousa-Gallagher et al., 2013). They are also subject to high level
41
of losses especially in households (Meyer et al., 2017). Strawberries are mainly sold in plastic or 42
wooden punnets and wrapped in a macro-perforated plastic bag to avoid dehydration and fruit 43
manipulation by the consumer. Macro-holes are necessary to maintain because the plastic film has gas 44
barrier properties that are too high for this type of product. MAP is not used commercially for 45
strawberries but could emerge in the near future with availability of new packaging films suitable for 46
respiring food products (e.g. new green cellulose-based films, starch-based polymers). From a scientific 47
point of view, several studies have highlighted the benefit of using MAP for strawberries (Aday and 48
Caner, 2013; Almenar et al., 2007; Cagnon et al., 2013; Giuggioli et al., 2015; Hertog et al., 1999; Matar 49
et al., 2018a) even if the resulting storage life extension was not always well quantified. The most 50
Version postprint
elaborate work is that of Matar et al. (2018a) who proposed integration the dynamic headspace gas 51
concentrations and temperature on quality of fresh strawberries in eMAP. Even if the link between a 52
gain of shelf life and reduction of food losses is not direct, one may expect that an increase of product 53
shelf life thanks to MAP may avoid losses at different stages of the post-harvest chain, especially at the 54
distribution and household stages, contributing to reducing the corresponding negative impact of such 55
losses (Verghese et al., 2015). To the best of our knowledge, none of the available studies focusing on 56
the benefit of MAP on fresh produce storage life attempted to study this link. The main difficulty 57
consists in the apparent nonlinearity of the link between storage life and loss reduction, which is 58
additionally strongly sensitive to the behaviours and practices of the different actors of the post-harvest 59
chain (Muriana, 2017; Porat et al., 2018). It appears thus very important to take into account stakeholder 60
practices, in particular those of consumers, to maximize the positive effect of a process or technology 61
on reduction of food losses. 62
Yokokawa et al. (2018) linked consumer behaviour and food losses within a framework that aimed to 63
measure the effects of packaging. They found that food loss reduction of highly functionalized 64
packaging may vary from 0 % to 83 % depending on consumer behaviour (time before consumption, 65
storage place, expiry date perception, food preparation). Moreover a survey to a large population in UK 66
(Plumb et al., 2013) shows that most consumers remove or open packaging before storage of produce 67
(apples: 68 %, bananas: 89 %, carrots: 52 %). From this practice, an issue can be anticipated in applying 68
eMAP technology for fresh produce given that the integrity of the packaging is paramount to maintain 69
the benefit of the MA for the product. This highlights the importance of identifying and considering 70
consumer behaviour and practices before quantifying the benefit of post-harvest technologies. 71
The objective of this study was to build a link between storage life and resulting losses of strawberries 72
while taking into account participants in the postharvest chain, especially in the consumer homes. The 73
case study chosen was the postharvest chain of strawberries as a worst case food model because of its 74
high perishability. The mathematical model developed by Matar et al. (2018a), in which coupling 75
deterioration of the product and gas mass balance in the headspace, was used to numerically explore 76
Version postprint
practices. To collect information about distributor and consumer practices, two surveys were conducted 78
among French distributors and consumers. A mathematical equation was proposed to link the 79
deterioration of the product to the estimation of losses. Finally, based on this equation and the numerical 80
exploration, postharvest losses reduction in the home were estimated using different post-harvest 81
storage strategies to decipher the benefit of eMAP on strawberry loss reduction. 82
2 Material & Methods
83
2.1 MAP system studied
84
‘Charlotte’ strawberries in their red stage were obtained at a local producer (Mauguio, South of France) 85
and taken to the laboratory around 5 h after harvest and cooled at 5°C. Fruit were sorted to eliminate 86
over ripen, i.e. soft texture, and under ripen, i.e. fruit with green, not fully mature spots. Strawberries 87
were packed and cooled directly after harvest according to the scheme in Figure 1 88
The MAP system is composed of 0.100 ± 0.003 kg of strawberries in a polypropylene (PP, Attitud’Pack, 89
Chatuzange Le Goubet-France) tray, with dimensions of 0.14 m × 0.095 m × 0.025 m, and packed with 90
a pouch of low density polyethylene (LDPE, BBA emballages, Lunel – France), 50 × 10-6 m of thickness
91
and O2 and CO2 permeability of 9.57×10⁻¹⁶ ± 0.43×10⁻¹⁶ and 47.85×10⁻¹⁶ ± 0.43×10⁻¹⁶ mol m-1 s-1 Pa-1
92
respectively (Matar et al., 2018a). The tray is assumed impermeable to mass transfer and gases 93
permeation occurs only through the flexible film. Dimensions of the LDPE pouch were calculated to 94
achieve an internal atmosphere close to the recommended one (5 % O2 and 15 % CO2) (Sousa-Gallagher
95
et al., 2013). Quality of stored fruit was assessed using the methodology of Matar et al. (2018b). 96
The post-harvest chain was divided into three steps. Step 1 consisted in the different stages between 97
packaging and arrival at the supermarket and was called “pre-supermarket”, Step 2 was dedicated to the 98
supermarket level and step 3 to the consumer level. To build realistic scenarios of the post-harvest 99
supply chain for fresh strawberries in the south of France, different questionnaires and surveys were 100
conducted. 101
Version postprint
Firstly, interviews with French wholesalers (that buy, pack and sell the product) aimed to identify the 102
main stages encountered in the post-harvest chain. Secondly, two surveys were carried out at the 103
distributor and consumer level to have more detailed information about these two stages suspected to 104
generate a high amount of losses. 105
In addition, a literature review was carried out to gather all available data on strawberry losses at all 106
stages of the post-harvest chain. 107
108
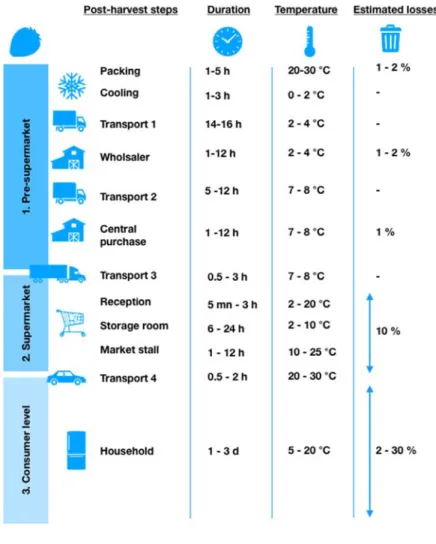
Figure 1: Description of the post-harvest steps considered in this study for fresh strawberries grown in
109
Southern Spain and sold in France with indication of minimal and maximal duration, temperature and
110
percentage of losses when available for each step
Version postprint
2.1.1 Interviews with French wholesalers: definition of the post‐harvest
stages and
112
corresponding losses
113
A typical post-harvest chain for strawberries was constructed based on visits and interviews (detailed 114
in https://doi.org/10.5281/zenodo.1543365) carried out with French wholesalers in the south of the 115
country and using technical reviews from the Interprofessional Technical Centre for fruit and vegetables 116
(CTIFL) dealing with French strawberries supply chain (Moras et al., 2003a, 2003b; Moras and Tamic, 117
2001; Vaysse et al., 2015). This post-harvest chain is expected to include stages from the packing to the 118
consumer level. The time-temperature history was recorded as well as the average percentages of 119
strawberries losses (regarding weight of product discarded) at each stage, when available. These losses 120
correspond to a visual decay and/or apparent mould development. 121
2.1.2 Distributor survey: tracking storage conditions and practices at the supermarket level
122
To build scenarios with realistic storage conditions at the distributor level, operational data are essential. 123
A questionnaire was constructed to understand the organisation of procurement and distribution of 124
strawberries in the French distribution chain. Information on the practices of mass retailing in the fruit 125
and vegetables sector and more particularly for "strawberries" were needed. Then, a typical circuit was 126
built with indication of duration and temperatures of storage, identification of the locations and amount 127
of losses. 128
The questionnaire (see questions on line at https://doi.org/10.5281/zenodo.1543365) was composed of 129
57 questions built on LimeSurvey software (LimeSurvey, Hamburg – Germany) and was sent to 89 130
departments heads working in the fruit and vegetables section of supermarkets. It was constructed based 131
on a report of the CTIFL identifying the brakes and levers for reducing losses for fruit and vegetables 132
including strawberries (Baros and Hongre, 2017). 133
In addition to questions related to common practices in the fruit and vegetable chain, information about 134
fruit shelf life, storage temperatures, losses (in value and/or percentage) and limits of acceptability were 135
requested. 136
Version postprint
2.1.3 Consumer survey: identifying consumer behaviour patterns
137
The survey conducted at the consumer level aimed at defining purchase and consumption habits. It was 138
based on hypotheses found in the literature (Roty, 2011a, 2011b; Vaysse et al., 2013) and on the results 139
of eight exploratory interviews. 140
This questionnaire is available online at https://doi.org/10.5281/zenodo.1543365. 141
The questionnaire begins by a screening question that excluded people who had not bought strawberries 142
within the last month. The first part of the questionnaire concerns the profile of the respondent age, sex 143
and socio professional category. The second part is dedicated to the strawberry purchase habits 144
particularly on the strategy used to select the product during purchase i.e. which of the five senses does 145
the consumer use to evaluate the quality of the fruit. The third part concerns the consumer behaviour 146
after purchase and the identification of storage conditions at home. In fact, strawberries can be 147
consumed immediately or later, whole or cut, stored at ambient temperature or in the fridge, washed 148
and sorted immediately after purchase or right before consumption. The exploratory interviews showed 149
various storage practices included in the questionnaire. 150
The questionnaire is built on LimeSurvey software and was sent to a consumer panel by email. 151
2.2 Mathematical prediction of food losses considering stakeholders’ practices
152
In this work, food losses are assumed to be only due to fruit deterioration. At the distribution stage, it 153
was previously demonstrated that a strawberry tray with more than 13 % of the fruit surface spoiled 154
would be rejected by the consumer, therefore entirely discarded by the distributor (Matar et al., 2018a). 155
At the consumer stage, considering that the consumer takes the time to sort spoiled from non-spoiled 156
fruit, the percentage of losses is therefore directly proportional to the percentage of deterioration. In 157
order to predict losses at home, the starting point of this work is consequently to predict the fruit 158
deterioration throughout its storage life. 159
Version postprint
2.2.1 Prediction of food deterioration
160
The mathematical model used to predict deterioration of the fruit is based on the one previously 161
presented and validated (Matar et al., 2018a). The main hypotheses of the model are listed are: external 162
atmosphere has a constant pressure (1.013×10⁵ Pa, e.g. atmospheric pressure) and constant gas
163
composition (20.9 % O2, 0.03 % CO2 and 79.07 % N2 (Widory and Javoy, 2003)). The headspace
164
volume and total pressure are assumed to be constant. Heat transfer at atmospheric, packaging material, 165
headspace and food commodity levels are assumed to occur faster than mass transfer and were thus 166
neglected. 167
The model takes into account the evolution of product quality based on a multi-criteria degradation 168
assessment in MAP conditions (Matar et al., 2018b). The percentage of deteriorated fruit surface 169
depends on the storage temperature and on headspace CO2 concentration and is modelled using a
170
logistic equation, as follows: 171 172
𝑑𝐷
𝑑𝑡
𝑘
𝑇 𝐷 1
𝐷
𝐷
1-x
CO2t
x
CO2max(1)
where D is the percentage of surface deterioration (%) at time t (s), 𝐷 is the maximum percentage 173
of deterioration (%), kD represents the deterioration rate constant (s-1). The latter term is a dimensionless
174
weighting parameter, representing the inhibiting effect of CO2 on the deterioration rate, xCO2 t and
175
xCO2max being respectively the CO2 concentration (%) in the headspace at time t and the maximal
176
inhibitory CO2 concentration equal to 30% (Matar et al., 2018a).
177
For the gas concentrations in the headspace, a mass balance for O2 and CO2 was done taking into
178
consideration permeation through the film, respiration of the product and deterioration effect as follows: 179
𝑑𝑛
𝑑𝑡
𝑃 𝐴
𝑒
𝑝
𝑝
𝑅
𝑝
𝐾𝑚
𝑝
𝑚
(2)
180Version postprint
𝑑𝑛
𝑑𝑡
𝑃
𝐴
𝑒
𝑝
𝑝
𝑞𝑅𝑄
𝑅
𝑝
𝐾𝑚
𝑝
𝑚 𝛽
𝐷
(3)
where 𝐴 is the surface area of the film (m2), 𝑒 the thickness of the film (m), 𝑝 and 𝑝 are the
181
atmospheric partial pressure of O2 and CO2 respectively (Pa), pO
2
in and p CO2
in are the headspace partial
182
pressure of O2 and CO2 respectively (Pa), PO2 and PCO2 are the permeability of the film for O2 and CO2
183
respectively(mol m-1 Pa-1 s-1), R
O2max corresponds to the maximum respiration rate per kilogram of food
184
commodity (mol kg-1 s-1), 𝐾𝑚 is the constant of Michaelis and Menten (Pa), 𝑚 is the weight of the
185
food product (kg), 𝑞𝑅𝑄 is the respiratory quotient (dimensionless) and βCO
2 represent the rate of carbon 186
dioxide production due to the deterioration (mol s-1 %-1). Note that oxygen consumption due to
187
deterioration was found negligible. 188
In Eq 2 – 3, the first term of the right side refers to the Fick’s first law, describing the mass flow of gas 189
species (O2, CO2) through the film, in a steady state regime, the second term is the expression of the
190
respiration rate using the classical Michaelis and Menten equation without CO2 inhibition. In Eq 3, the
191
third and last term is the metabolic deviation (CO2 production) due to deterioration.
192
The effect of temperature on the deterioration, kD, respiration, RO2max and permeation, PO2 and PCO2is
193
represented through Arrhenius law in Eq 4: 194
𝑘 𝑇 𝑘
exp
𝐸
,𝑅
1
𝑇
1
𝑇
,(4)
where k is the temperature dependent parameter, 𝑘 the value of reference temperature Tref,k (K) 195
, 𝐸 , is the activation energy for parameter k (J mol-1), 𝑅 is the universal gas constant (8.314 J mol-1 K
-196
1). T
ref,k (K) considered in this work was the most central value of temperature range investigated,
197
generally 10 °C. 198
Version postprint
2.2.2 Prediction of food losses from simulated food deterioration
200
It was assumed that the area under the deterioration curve is proportional to the percentage of losses. 201
Thus, the percentage of losses is considered linear to the integral of the deterioration curve 𝐷 as 202
follows: 203
where 𝑝 is the type of the packaging, 𝑠 the number of the scenario tested in a population 𝑃 of scenarios 204
studied, 𝑙 is the percentage of losses (%) of the scenario 𝑠 using the packaging 𝑝, 𝐷 𝑡 𝑑𝑡is the 205
integral (dimensionless) of the deterioration curve 𝑡, 𝐷 𝑡 for scenario 𝑠 in the packaging 𝑝 from 𝑡𝑖 206
to 𝑡𝑗, representing the time at which the post-harvest stage begins and ends respectively (s). 𝑎 and 𝑏 207
(dimensionless) are the estimated parameters of the linear regression. 208
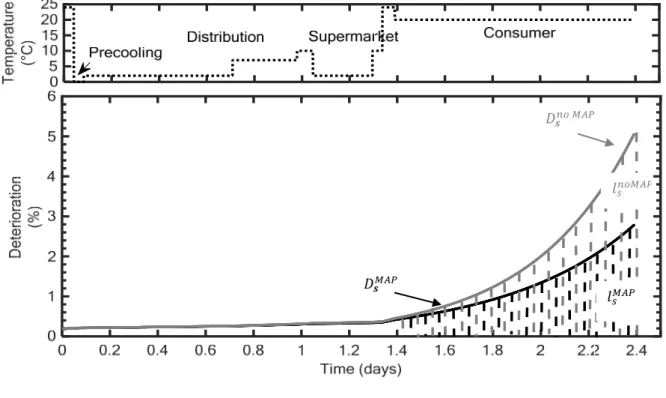
In Figure 2 an example of a temperature profile applied for a post-harvest chain scenario is presented. 209
The corresponding deterioration curves and calculations of their integrals are shown for two different 210
types of packaging 𝑝 = MAP (black hatched area) and 𝑝 = non MAP (grey hatched area) storage at the 211
consumer level i.e. from 1.4 d to 2.4 d (Figure 2). 212
213
Version postprint
214
Figure 2: An example of post-harvest chain scenario including precooling, distribution, supermarket and
215
consumer stages with the applied storage temperature in dotted line (…) (a) and predicted 𝑫𝒔𝒏𝒐 𝑴𝑨𝑷 and
216
𝑫𝒔𝑴𝑨𝑷deterioration curves in non MAP (grey curve) and MAP (black curve) conditions (b). Grey and black
217
hatched areas under the deterioration curves are linked respectively to the percentage of losses at the
218
consumer level 𝒍𝒔 𝒏𝒐 𝑴𝑨𝑷 and 𝒍𝒔 𝒏𝒐 𝑴𝑨𝑷 respectively calculated using equation (5).
219
2.2.3 Including consumer behaviour patterns and diversity of post‐harvest scenarios in the
220
prediction of food losses
221
Food losses at the consumer stage are assumed to depend on consumer behaviour regarding storage 222
temperature and duration and preservation of the modified atmosphere. The likelihood of consumer 223
behaviours, 𝑤, varying between 0 and 1 (dimensionless), taking into account those three variables all 224
together is calculated using the following equation, assuming that events are independent: 225
𝑤
𝑃 𝑃 𝑃
(6)
where 𝑃 is the probability related to storage temperatures at home: ambient or refrigerated storage 226
(dimensionless), 𝑃 is the probability related to storage duration at home, before consumption: one day 227
𝑙
𝑙 𝐷𝒔
Version postprint
or more (dimensionless) and 𝑃 is the probability related to the packaging state: kept or removed 228
packaging at home (dimensionless). 229
The probability of each practice is supposed to be equal to the frequency of this practice within the 230
sample. 231
Finally, the cumulated percentage of losses 𝐿
within the sum of all 𝑠 scenarios participating in 232
the definition of the behaviour of a population 𝑃, is expressed as follows: 233
where 𝑙 is the percentage of losses for the scenario 𝑠 in a packaging 𝑝 (%). 𝑝 being the state of the 234
packaging i.e. in MAP or non-MAP condition. 235
236
2.2.4 Input parameters
237
The MAP modelling tool was composed of equations (1-4) and required 23 inputs. Firstly, 17 238
parameters depict the deterioration of fruit, 𝑘 , 𝐸 , , 𝑇 , , 𝐷 , xCO2max, the respiration of 239
fruit, 𝑅 , 𝐸 , , 𝑇 , , 𝐾𝑚 , 𝑞𝑅𝑄, 𝛽 , and the permeation through the packaging, 240
𝑃 , 𝐸 , , 𝑇 , , 𝑃 , 𝐸 , , 𝑇 , including the temperature dependency for the 241
deterioration rate, the gas permeabilities and the maximal respiration rate. Secondly, three parameters 242
depict the geometry of the packaging, 𝐴, 𝑒 and the mass of fruit, 𝑚. Finally, three constants were used, 243
𝑝 , 𝑝 , 𝑅 (see the nomenclature table for more details about symbol significance and units). Most 244
of them were taken from previous work (Matar et al., 2018a). In addition, to run the MAP modelling 245
tool in dynamic temperature conditions, an activation energy 𝐸 , was calculated for kD representing 246
the deterioration rate constant (s-1). 𝐸
, was found equal to 73514 ± 2205 J mol-1. βCO2 was found
247
𝐿
𝑙 𝑤
Version postprint
constant whatever the temperature (5 °C, 10 °C and 20 °C) with a mean and standard deviation of 248
1.32x10⁻⁹ ± 2.9x10⁻¹⁰ mol s-1 %-1.
249
2.2.5 Numerical simulation
250
Simulations and calculations were performed using Matlab® software (The Mathworks Inc, Natick, 251
Mass., U.S.A) and Microsoft Excel (2016). 252
2.3 Statistics
253
The independence of variables (storage temperature, storage duration and packaging practices) in 254
answers to consumer surveys was analysed using Chi-Square tests (performed with SAS 9.3). 255
Logistic analyses (performed with SAS 9.3, and available upon request) were carried out to determine 256
if variables depend on sex, age and occupation. Results showed that the duration of storage depends on 257
age, and that removing the package depends on age and occupation. 258
3 Results and discussions
259
The methodology presented in this work and validated on the typical strawberry supply chain commonly 260
found in South of France, aimed at predicting the benefit of MAP in terms of reduction of product loss, 261
in particular at the consumer stage. The losses considered here are assumed to be directly proportional 262
to the percentage of fruit deterioration. Therefore, all losses estimation relied on the prediction of fruit 263
deterioration (Eq. 1). The consumer step is the step where the storage conditions are the least well 264
controlled and managed, and lead, therefore, to an important amount of losses. As the final step of the 265
supply chain, the deterioration level of the product arriving at consumer homes is strongly dependent 266
on the previous stages (wholesaler, supply and distribution chains). Therefore the first step of this 267
approach was to build realistic scenarios of the strawberry supply chain with determination of storage 268
conditions for each stage. 269
Version postprint
3.1 Post‐harvest chain scenarios
270
Setting up of post-harvest scenarios was done based on interviews with wholesalers, from the literature 271
(Mercier et al., 2017), and from the Interprofessional Technical Centre for fruit and vegetables (CTIFL) 272
dealing with the French supply chain of strawberries (Moras et al., 2003a, 2003b; Moras and Tamic, 273
2001; Vaysse et al., 2015). It was found that a typical pre-supermarket step for packed strawberries 274
could include up to seven stages, such as packaging, precooling, wholesaler, central purchase, and three 275
transport stages. The seven stages were gathered under the same item: “pre-supermarket step” (Figure 276
1), which is followed by the distribution step (in supermarket), excluding the transport phase and the 277
consumer step, including transport from the supermarket to home, and storage at home until 278
consumption. The transport duration n°1 is rather long, mimicking the case where strawberries are 279
grown far away from the wholesaler location considered as a worst case in the pre-supermarket scenario. 280
Minimal and maximal temperatures applied at each stage are indicated in Figure 1. 281
3.1.1 Distributor behaviour patterns
282
To collect information about distributor practices, a survey targeted to this stakeholder was carried out. 283
Only 21 answers were obtained on 89 distributors solicited, and among them, only four departments 284
heads answered the whole questionnaire. These distributors belonged to mini-markets and supermarkets 285
and sell strawberries mainly in trays of 0.25 or 0.50 kg. Although few data were obtained, they will be 286
used as guidelines (master data) to confirm information found in the literature. 287
The results of the questionnaire showed that supermarket step is mainly divided into three stages: the 288
reception, storage room and supermarket display (Figure 1). At the reception stage, the product is either 289
refrigerated (2 °C) or kept at ambient temperature (20 °C) for a short duration varying from 5 min to 3 290
h. In the storage room, the product is stored at low temperature between 2-10 °C for a duration between 291
6 h and 1 d. Finally, in the supermarket display, products are either stored at 25 °C or in refrigerators at 292
10 °C from 1 to 12 h. Among the survey respondents,the unsold strawberries are discarded and not 293
kept in stock. The supermarket stock was replenished six times per week. 294
Version postprint
3.1.2 Consumers’ behaviour patterns
295
The consumer survey was open for the two last weeks of May 2016, during the strawberry harvest 296
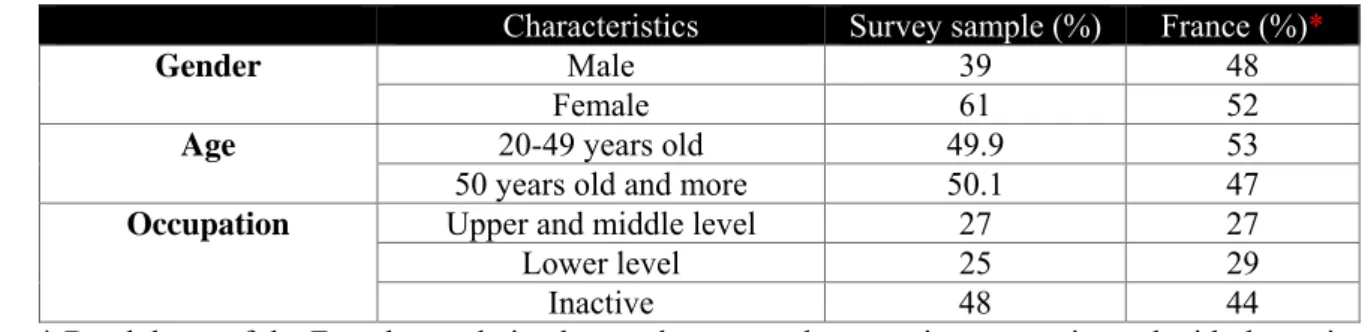
period. A quota method on age and occupation was used. The final sample (749 participants) was close 297
to the French population over 20 years in terms of age and occupation(Table 1). The % women of the 298
sample is higher than in the French population (61 % of women in the sample, 52 % in France). 299
However, it reflects the fact that women are more often the main food purchasers than men in French 300
households. 301
Table 1: Comparison of the sample to the French population over 20 years
302
Characteristics Survey sample (%) France (%)*
Gender Male 39 48
Female 61 52
Age 20-49 years old 49.9 53
50 years old and more 50.1 47
Occupation Upper and middle level 27 27
Lower level 25 29
Inactive 48 44
* Breakdown of the French population by gender, age and occupationwas estimated with the national 303
statistics on employment (in relation with age and gender) published by the “Institut National de la 304
Statistique et des Etudes Economiques“, and available online at https://www.insee.fr/fr/statistiques/
305 306
Once at home, 14.5 % of the consumers stored the product for a maximum of 3 d, 24.5 % for 2 d while 307
61 % kept it for a maximum of 1 d before consumption. This can be explained by the very short storage 308
life of strawberries. The fruit were sorted just before the consumption for half of the participants. A 309
majority (79 %) of the consumers removed the packaging just after purchase, systematically or at least 310
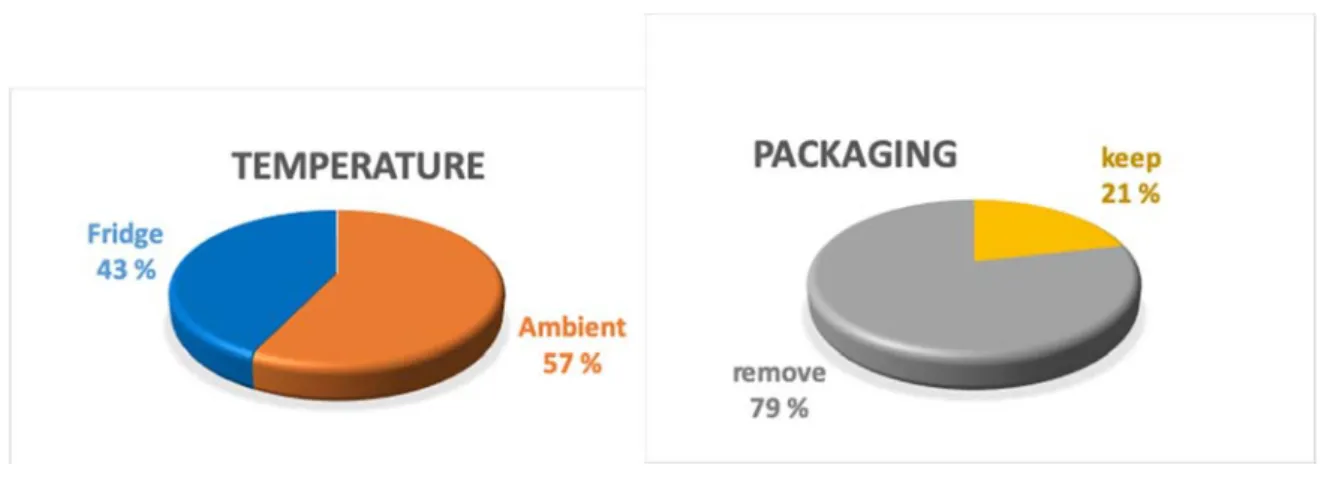
every other time. 57 % of the consumers kept the fruit at ambient temperature while 43 % of them kept 311
them in the fridge. These last features are particularly relevant for the present work and are summarized 312
in Figure 3. The fact that 79 % of consumers removed the pouch just after purchase means that in the 313
case of MAP, the benefit of the MA is lost as soon as the pack is opened, i.e. in some cases, well before 314
Version postprint
damaged parts. This answer confirmed our hypothesis to consider a percentage of losses at the 317
household stage directly proportional to the level of degradation. 318
319
Figure 3: Consumer preferences for post-harvest practices of fresh strawberries; percentage of people
320
using cold chain and removing packaging for storage at home
321
Within the literature on food loss and waste, only a few papers focus on the link between storage 322
practices and consumer food waste, even if storage is identified as a critical step within food waste 323
drivers (Farr-Wharton et al., 2014; Hebrok and Boks, 2017). The results obtained in the present study 324
confirm previous conclusions of the WRAP final report (Plumb et al., 2013) that many consumers do 325
not recognise that packaging protects food in the home. While there is recognition that packaging is 326
important to keep the product safe on its way to and in the store, the opposite view is prevailing at home. 327
This in turn leads many consumers to adopt unpacking strategies that potentially decrease the longevity 328
of products (i.e. taking products out of their packaging or piercing the packaging to ‘let it breathe’) 329
(Plumb et al., 2013). Therefore, the importance of consumer behaviours when putting on the market 330
new technologies such as MAP may be significant if these behaviours do not change. 331
From the survey, three main variables were extracted and were then considered in the prediction of the 332
food losses reduction: 333
The state of the packaging: “keeping” or “removing” the plastic pouch after purchase; 334
The temperature of storage: “low temperature” or ‘high temperature”; 335
Version postprint
The time span before consumption: “short duration” or “long duration”, i.e. one or three days of storage 336
as best and worst case scenario. 337
The independence of storage temperature, storage duration and packaging practices was analysed using 338
Chi-Square tests on dummies (performed with SAS 9.3). Three dummies were considered: fridge, equal 339
to 1 if participant stores strawberries in the refrigerator, 0 otherwise; short, equal to 1 if participant 340
stores strawberries for 1 day (or less), 0 otherwise; remove, equal to 1 if participant removes the 341
packaging before storage, 0 otherwise. Chi-Square tests showed that the three variables are independent 342
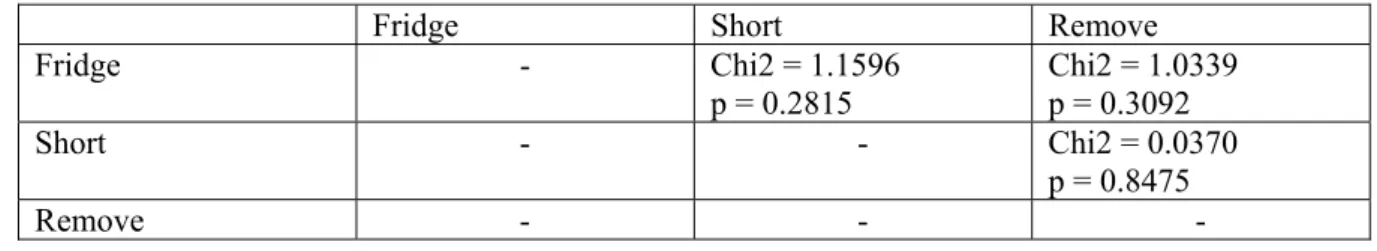
(Table 2). 343
Table 2: Chi-Square tests of independence (N=749, DF=1)
344
Fridge Short Remove
Fridge - Chi2 = 1.1596 p = 0.2815 Chi2 = 1.0339 p = 0.3092 Short - - Chi2 = 0.0370 p = 0.8475 Remove - - - 345
According to the survey results, some likelihood of consumer behaviours, w, could be calculated using 346
Equation 6. For example, the probability that consumers store the strawberries before consumption at 347
low temperature, namely ‘low temperature’ (5 °C), is equal to the rate of participants in the survey who 348
always store their strawberries in the fridge (0.43). Consequently, the rest of the consumers (0.57) store 349
strawberries at ambient temperature, namely ‘high temperature’, i.e. at 20 °C. The same applies for the 350
probability of short/storage duration, where short storage duration means storage of strawberries for 1 351
d maximum before consumption (61 % of the consumers, so p=0.61). The consumers were considered 352
to remove packaging if they do it at least one time in two, on average (p=0.79 for ‘remove packaging’). 353
Consequently, p=0.21 for keeping packaging, namely ‘keep packaging’. Thereby, the probability of 354
consumers storing the tray 1 day before consumption (short duration), in the refrigerator (low 355
temperature) and keeping the package intact until consumption is equal to 0.61×0.43×0.21=0.05. 356
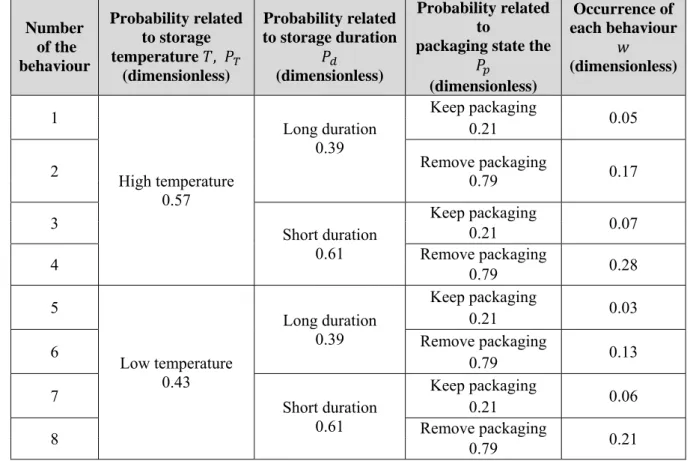
In summary, after aggregating the information gained from the consumer surveys, eight behaviours 357
Version postprint
Table 3: Description of the eight aggregated consumer behaviours based on the temperature, duration of
359
storage and state of the packaging
360 Number of the behaviour Probability related to storage temperature 𝑇, 𝑃 (dimensionless) Probability related to storage duration 𝑃 (dimensionless) Probability related to
packaging state the 𝑃 (dimensionless) Occurrence of each behaviour 𝑤 (dimensionless) 1 High temperature 0.57 Long duration 0.39 Keep packaging 0.05 0.21 2 Remove packaging 0.79 0.17 3 Short duration 0.61 Keep packaging 0.07 0.21 4 Remove packaging 0.79 0.28 5 Low temperature 0.43 Long duration 0.39 Keep packaging 0.03 0.21 6 Remove packaging 0.13 0.79 7 Short duration 0.61 Keep packaging 0.06 0.21 8 Remove packaging 0.79 0.21 361
The composition of our sample in terms of sex, age and occupation was slightly different from the 362
composition of the French population (Table 1), and therefore, estimating French storage practices with 363
our sample practices might provide biased results if storage practices depend on these factors. Logistic 364
analyses, performed with SAS 9.3, showed that the duration of storage depended on age, and that 365
removing the package depended on age and occupation. By taking into account the composition of the 366
French population rather than the composition of our sample for the calculation of the average 367
frequency, the probability of storing the strawberries more than 1 d is equal to 0.6052 rather than 0.613; 368
and the probability of removing the package is equal to 0.7864 instead of 0.7863. The small differences 369
between these two estimations can be explained by the small difference between our sample and the 370
French population in terms of age breakdown (for storage duration), and by the fact that the bias due to 371
age is offset by the bias due to occupation (for package removing). 372
Version postprint
3.1.3 Estimation of strawberry losses
373
The losses at the different stages of the post-harvest chain are shown in Figure 1. The data were 374
provided by professional experts (technical institutes for the sector such as CTIFL, France AgriMer, 375
inter-branch professional organisation, wholesalers, retailers, distributors) through field surveys and 376
interviews were checked for plausibility and completed by academic experts. The reference year was 377
an “average” year for production/retailing. The difficulty of obtaining reliable estimations of strawberry 378
losses directly from the stakeholders necessitated a thorough cross-checking of the information coming 379
through interviews as well as technical and scientific reviews. For instance, wholesalers and distributors 380
were reluctant to disclose this information. 381
Losses were about 1-2 %, at the packing step, the wholesale and central purchase (data communicated 382
by the interviewees), 10 % at the distributor stage as recorded by ADEME (ADEME, 2016) and 2 to 30 383
% at the consumer level identified from interviews with local wholesalers and from literature data 384
(Moras et al., 2003b; Vaysse et al., 2015) (Figure 1). These data are in line with those generally quoted 385
for the whole fruit and vegetable sector. For example, Redlingshöfer et al. (2017) found 12 % of losses 386
from primary production to processing for the FFV sector, including food loss at distribution. This value 387
is consistent with the cumulative losses identified in the present work at the packing step, the supply 388
chain up to distributor and including losses at distribution. Porat et al. (2018) also cited FFV losses of 389
10-11 % from field to retail waste. 390
While data gathered for the primary losses to retailing were confirmed by different technical and 391
scientific experts, those at the consumer level displayed wide variation and uncertainty. Strawberry 392
losses in the household changes with the season, the place and time of consumption, the cost of the 393
product which is lower in peak strawberry season. Abundance and low price would lead consumers to 394
be more prone to wastage. Thorough cross-checking with scientific literature has revealed that the lower 395
value of 2 % of losses at the consumer level is consistent with the inedible fraction of fresh fruit which 396
would vary from 2 to 6 %, depending on the reference (De Laurentiis et al., 2018). This inedible fraction 397
Version postprint
choices of the consumers and poor food conservation. The upper limit of 30 % is consistent with other 400
data: on average 29 % of the mass of FFV purchased by households in the EU28 in 2010 was wasted 401
(De Laurentiis et al., 2018), and 15-30 % of FFV purchases by mass are discarded by consumers 402
(Gustavsson et al., 2011). 403
The 2-30 % range is considered to correspond to the damaged strawberries thrown away by the 404
consumer (pieces or whole strawberry) and this value is assumed to be directly correlated to the level 405
of deterioration predicted by the mathematical model. In the best case scenario of 2 %, only unavoidable 406
losses corresponding to inedible component, would be discarded in all cases, while in the worst case 407
scenario 30 % of the product is discarded due to unsuitable quality (e.g. apparent spoilage, softening 408
and browning). 409
3.2 Predicting product deterioration in multiple scenarios of the post‐harvest chain
410
Eq. 1 was used to predict the product deterioration for different post-harvest scenarios based on data 411
gathered in Figure 1. The 7 different stages of the “pre-supermarket step” were aggregated in one single 412
step with three different storage conditions: “high temperature and long duration”, “low temperature 413
and long duration”, “mean temperature and short duration” (Figure 4). In the case of “high temperature 414
and long duration”, the highest temperature of the range indicated in Figure 1 for each stage (cooling, 415
packing, etc.) was systematically chosen with the longest duration for building this scenario. In contrast, 416
the lowest temperature and longest time span were chosen for building the “low temperature and long 417
duration” scenario. For the short duration case, preliminary simulations showed that deterioration 418
curves were not significantly different, regardless of the packaging conditions, MAP or non-MAP, and 419
the high or low, or the mean, temperature within each stage. Thus, “high” and “low temperature of 420
storage” for “short duration” in the pre-supermarket step were aggregated in a single scenario “mean 421
storage temperature and short duration” in order to reduce the total number of scenarios. Finally, three 422
different scenarios were considered for the pre-supermarket step. 423
For the supermarket step, some simplifications were applied. For the reception stage, temperature varies 424
between 2-20 °C (Figure 1). However, because of the short duration of this stage and its very weak 425
Version postprint
influence on the simulated deterioration, an average temperature (10 °C) and duration (92.5 min) were 426
considered for this storage stage in all simulations. For storage rooms and market stall stages, the 427
combination of “high” and “low temperature” with “long” and “short duration” was considered 428
assuming that the same conditions operate in both storage room and supermarket display stages (Figure 429
4). Finally, four different scenarios were considered for the supermarket step. 430
For scenarios including high temperature and long duration at the pre-supermarket level followed by 431
high temperature and long duration at the supermarket level, the product deterioration at the end of the 432
supermarket step exceeded the maximal acceptable deterioration of 13 % (Matar et al., 2018a). This 433
means that the consumer was not ready to buy the product anymore. Therefore, these scenarios were 434
not considered in the investigation at the consumer step. 435
For the consumer step, the first stage was a transport phase between supermarket and the home 436
(transport 4 - shown in Figure 1). Due to the very small impact of this stage, a mean temperature and 437
duration was considered (1.25 h at 25 °C). For the household stage, a combination of the highest and 438
lowest temperature of storage combined with longest and shortest storage time was considered with the 439
aim of covering a range of possibilities, i.e. four different scenarios at the consumer level. At this level, 440
combining all the cases represented in the pre-supermarket, supermarket and consumer level, and 441
excluding those that did not pass the supermarket stage, finally, 44 scenarios were obtained (Figure 4). 442
These scenarios could be applied for the control packaging (non-MAP). 443
For the case of MAP, additional scenarios should be added at the consumer level. Indeed, surveys 444
revealed that only 21 % of consumers kept the packages sealed before consumption. 79 % of consumers 445
removed it just after purchase even if they do not immediately consume their strawberries. This practice 446
relies on the belief that it is better to store strawberries without packaging as they are living products. 447
Nearly two-thirds of consumers unpack FFV and therefore reduce the longevity of the product – for 448
example, 64 % take apples out of the pack or do something to the bag (e.g. pierce it) (Plumb et al., 449
2013). That means that when MAP is used, the benefit of the technology is lost long before FFV 450
Version postprint
two possible states of the packaging (keeping packaging sealed until consumption or removing it just 453
after purchase) were considered for each of the 44 pre-scenarios, then 88 additional scenarios were 454
added to the 44 control ones, when MAP packaging is used. In total, 132 scenarios were generated 455
where 88 scenarios were in MAP condition and 44 scenarios were in non-MAP conditions. 456
The 132 scenarios were used as inputs in the model to calculate the deterioration curve in each case and 457
then, the corresponding losses. 458
459
Figure 4: Construction of the 132 scenarios among them 88 in MAP and 44 in non MAP condition according
460
to Pre-supermarket, Supermarket and Consumer storage conditions. T refers to the temperature and d to
461
the duration of the stage
462 Pre‐Supermarket Supermarket (storage room + shelves) Steps Tested scenarios Mean T + short d Low T + long d High T + long d High T + long d High T + short d Low T + long d Low T + short d High T + long d High T + short d Low T + long d Low T + short d High T + short d Low T + short d Low T + long d High T + long d High T + short d Low T + long d Low T + short d Remove MAP packaging Keep MAP packaging Consumer … … … … … … … … … … … … … … … … … … … … … … … All postharvest steps in non MAP = 44 scenarios All postharvest steps in MAP = 88 scenarios
Version postprint
3.3 Predicting strawberry losses at the consumer stage considering the diversity of
463
French consumers’ behaviour
464
Losses were calculated for each 132 scenarios by using Eq. 5 (see section 2.3.2). Losses were considered 465
proportional to the degradation of the product, degradation that itself depends on the storage conditions 466
(temperature and internal atmosphere composition under MAP conditions). Input parameters for loss 467
calculations are thus all inputs parameters required for predicting the degradation of the fruit during the 468
whole post-harvest chain and the inputs parameters related to losses (see section 3.1.3) used to calibrate 469
Eq. 5. For this purpose, for each of the 132 deterioration curves generated, the corresponding area under 470
the deterioration curves (i.e. the integrals of deterioration curves 𝐷 ) was calculated. Then these 471
132 scenarios were distributed in eight groups corresponding to the main eight behaviours observed at 472
the consumer stage (Table 3). A mean value of 𝐷 was calculated for each aggregated scenario, 473
i.e. eight for each of MAP, and non-MAP (Table 4). 474
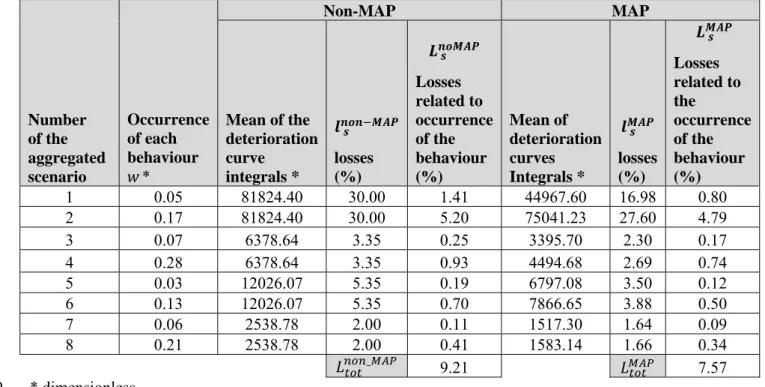
Version postprint
Table 4: Percentage of losses, 𝑳 𝒔𝒑, calculated for each aggregated scenario with the associated area of the
476
deterioration, occurrence of each behaviour, percentage of losses, and total percentage of losses affected by
477
French consumer behaviour in MAP and in non-MAP.
478
* dimensionless 479
In a second step, the % food loss, 𝑙 , was calculated using Eq. 5 and the mean value of 𝐷 for 480
each of the eight aggregated scenarios, in MAP and non-MAP conditions. To do that, 𝑎 and 𝑏 values in 481
Eq. 5 must be first calculated. For this purpose, the minimum and maximum losses identified at 482
household, 2 and 30 % respectively (Figure 1), were attributed to the worst case and best case scenarios 483
respectively, 𝑠 and 𝑠 , i.e. those having the smallest and biggest value of the deterioration integral, 484
in the control situation (non-MAP). In other words, 𝑙 and 𝑙 corresponded to 485
𝐷 and 𝐷 respectively. That means that in the best case (optimal storage 486
conditions and moment of consumption), the consumer discards only 2 % of the fruit against 30 % in 487
the worst case. With these two data set (𝑙 2 %, 𝐷 2538.78) and (𝑙 488
30 %, 𝐷 81824.40), the values of 𝑎 and 𝑏 can be calculated following a linear function 489
of the form 𝑦 𝑎𝑥 𝑏 (Table 4). The two fitted parameters 𝑎 and 𝑏 were found equal to 3.53×10-04
490 Number of the aggregated scenario Occurrence of each behaviour 𝑤* Non-MAP MAP Mean of the deterioration curve integrals * 𝒍 𝒔𝒏𝒐𝒏 𝑴𝑨𝑷 losses (%) 𝑳 𝒔𝒏𝒐𝑴𝑨𝑷 Losses related to occurrence of the behaviour (%) Mean of deterioration curves Integrals * 𝒍 𝒔𝑴𝑨𝑷 losses (%) 𝑳 𝒔𝑴𝑨𝑷 Losses related to the occurrence of the behaviour (%) 1 0.05 81824.40 30.00 1.41 44967.60 16.98 0.80 2 0.17 81824.40 30.00 5.20 75041.23 27.60 4.79 3 0.07 6378.64 3.35 0.25 3395.70 2.30 0.17 4 0.28 6378.64 3.35 0.93 4494.68 2.69 0.74 5 0.03 12026.07 5.35 0.19 6797.08 3.50 0.12 6 0.13 12026.07 5.35 0.70 7866.65 3.88 0.50 7 0.06 2538.78 2.00 0.11 1517.30 1.64 0.09 8 0.21 2538.78 2.00 0.41 1583.14 1.66 0.34 𝐿 _ 9.21 𝐿 7.57
Version postprint
and 1.10 respectively. Consequently, losses 𝑙 corresponding to all other deterioration integrals ranging 491
from the 𝑠 to 𝑠 values could be interpolated using Eq. 5. 492
To calculate the overall value for losses in the post-harvest chain,𝐿 , 𝐿 values were first calculated 493
using Eq 6 for the eight different behaviour scenarios taking care of their probability of occurrence, w, 494
and then aggregated in a single value, 𝐿 , using Eq 7. Finally, eight values of losses were estimated 495
for each of non-MAP conditions, 𝐿 , and MAP conditions 𝐿 . 496
Using this methodology, the average overall losses for the two cases of storage investigated, non-MAP 497
and MAP, considering multiple, realistic post-harvest storage scenarios and consumer practices were 498
9.2 % (rounded to 9 % in the following) in the case of non-MAP and 7.6 % (rounded to 8 % in the 499
following) in the case of MAP, respectively. Considering uncertainty on the loss estimations at the 500
household stage (about 10 %) according to the results of FUSION EU project (Stenmarck et al., 2016), 501
these two values are not significantly different. This could be ascribed to the fact that only 21 % keep 502
the packaging intact until the consumption time. In that case, the benefit of the modified atmosphere 503
would have been lost quite early during the post-harvest chain. This result confirmed that, if the current 504
storage practices of consumers do not change, the benefit of using MAP for the fresh strawberries would 505
be negligible. 506
The absolute value of losses found at the household stage must be considered with caution as they are 507
highly dependent on the upper and lower limits they are derived from (2-30 %). Different values could 508
have been obtained considering other limits, especially the upper limit, which could be discussed. In 509
addition, the consumer practices studied here refer only to the case where the consumer consumes all 510
or part of the product. Waste of strawberries due to inappropriate consumer behaviours (e.g. still edible 511
product voluntarily discarded for instance because the consumer forgot it or did not want to eat it 512
anymore) were not considered because it is difficult if not impossible to predict. 513
3.4 Impact of consumers’ behaviour changes on strawberry losses
Version postprint
current situation, macro-perforated packaging with 43 % of refrigerator storage and 79 % of packaging 517
removed after purchase and the MAP situation (named hypothesis 1 in Figure 5) corresponding to the 518
case when MAP is applied for all strawberries sold but with the current consumer behaviours. The two 519
first new hypotheses tested represented control situations (100 % of people store the strawberries in the 520
fridge or 100 % of people store them at ambient temperature, all strawberries being packed in macro-521
perforated packaging, i.e. without any specific modified atmosphere condition). The four other 522
hypotheses corresponded to alternative behaviours for the consumer: for instance, hypothesis 3 assumes 523
that 100 % of consumers store their strawberries in the refrigerator and 100 % of them kept them in 524
MAP until consumption while hypothesis 5 considered that 100 % of consumers kept their fruit at 525
ambient temperature but in MAP, until consumption. The corresponding losses obtained for each of 526
these eight cases were calculated (Figure 5). 527 528 529 3 14 9 8 6 2 11 8 0 2 4 6 8 10 12 14 16 Control 1 Control 2 Current situation Hypothesis 1 Hypothesis 2 Hypothesis 3 Hypothesis 4 Hypothesis 5 % of losses Scenarios
Version postprint
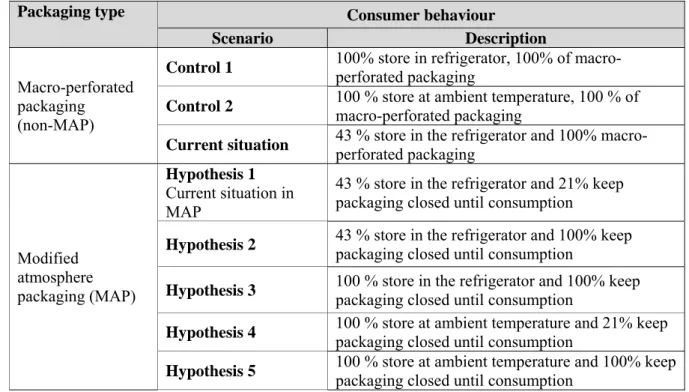
530
Figure 5: Evaluation of percentage of losses* for 8 different scenarios including the current case, 3 control
531
situations and 5 hypotheses of change of consumer behaviours. The details of all scenarios are given in the
532
table below the graph. The state of the packaging for each situation before its arrival to the household stage
533
is indicated on the left of the table. * rounded values
534 535
Figure 5 illustrates that use of MAP reduces losses from 9 % to 8 % (hyp 1), but if the consumers keep 536
the fruit in sealed packages, the loss is reduced to 6 % (hyp 2).This result confirms the benefit of MAP 537
to reduce post-harvest losses (Aday and Caner, 2013; Almenar et al., 2007; Giuggioli et al., 2015; Peano 538
et al., 2017) while quantifying this benefit for the first time. However, benefits are reduced if consumers 539
open the packaging and lose the benefit of MAs. Informing consumers through dedicated front-of-540
package labelling about the food and packaging innovations, is a major driver to raise awareness of the 541
benefits of the new technology (Hebrok and Boks, 2017; Plumb et al., 2013). 542
If in addition to MAs, all consumers keep the strawberries in the refrigerator instead of ambient 543
temperature (hyp 3), the losses decrease from 6 % (hyp 2), to 2 % (hyp 3, Fig. 5). As expected, largest 544
Packaging type Consumer behaviour
Scenario Description
Macro-perforated packaging (non-MAP)
Control 1 100% store in refrigerator, 100% of macro-perforated packaging
Control 2 100 % store at ambient temperature, 100 % of macro-perforated packaging Current situation 43 % store in the refrigerator and 100% macro-perforated packaging
Modified atmosphere packaging (MAP) Hypothesis 1 Current situation in MAP
43 % store in the refrigerator and 21% keep packaging closed until consumption
Hypothesis 2 43 % store in the refrigerator and 100% keep packaging closed until consumption Hypothesis 3 100 % store in the refrigerator and 100% keep packaging closed until consumption Hypothesis 4 100 % store at ambient temperature and 21% keep packaging closed until consumption Hypothesis 5 100 % store at ambient temperature and 100% keep packaging closed until consumption
Version postprint
theoretical case of macro-perforated packaging combined with 100 % of use of cold chain, for which 546
the calculated losses are equal to 3 % (control 1, Fig. 5). Considering only the percentage of losses in 547
households, the benefit of MAP in addition to cold chain would be negligible compared with the 548
exclusive use of cold chain (hyp 3 versus control 1). 549
To better highlight the benefit of using MAP for fresh strawberries, only results obtained at ambient 550
temperature were compared. If all consumers stored fruit at ambient temperature, even if only 21 % of 551
them kept the packaging sealed until consumption (hyp 4, Fig. 5), the percentage of losses would be 552
reduced to 11 % compared with the same non-MAP situation where losses are equal to 14 % (control 553
2, Fig. 5). If 100 % of consumers keep the packaging sealed until consumption, losses would be reduced 554
to 8 % (hyp 5, Fig 5), which corresponds to a relative reduction of loss to 41 %. Comparison of this 555
benefit of MAP at ambient temperature (41 % of relative losses with MAP; hyp 5 versus control 2) with 556
benefit of MAP at cold temperatures (28% reduction of losses; hyp 3 versus control 1), revealed that 557
the benefit of MAP is much higher at ambient temperature than at chilled temperature. 558
Previous results highlight that above all, consumers should use refrigerated storage to maintain 559
strawberry quality at home. However, systematic use of refrigeration is not feasible because: more than 560
55 % consumers will not put their strawberries in the refrigerator because they consider that 561
refrigeration negatively changes the taste of the product. For these consumers, MAP could be a benefit 562
for strawberry providing that these consumers also keep package integrity until the moment of 563
consumption (not in 79 % of cases). Consumer education is needed to increase benefit of MAP. 564
The positive impact of the cold chain should also be put into balance with its environmental cost. In 565
spite of upcoming advances in energy production techniques that reduce costs and environmental 566
impacts of the cold chain, refrigeration still has environmental and economic implications for the food 567
industry. The use of refrigeration is, indeed, still a major contributor to global energy consumption, 568
accounting for 15 % of the electricity consumed worldwide (Camanzi et al., 2017; Coulomb, 2008; 569
Matarolo, 1990). However, MAP technology also carries financial costs and environmental impacts that 570
must be put into balance with its environmental benefit. In a general manner, the benefit for the full 571
Version postprint
chain of loss reduction could be hampered by the economic and environmental cost of the technology 572
used to reduce these losses. 573
4 Conclusion
574
In this paper, 132 post-harvest scenarios representing the diversity of distributor and consumer practices 575
have been simulated for the strawberry supply chain. Percentage of fruit losses were calculated for each 576
scenario with the objective of quantifying the benefit of MAP in the strawberry supply chain compared 577
to the current standard situation (macro perforated pouches). It was found that, considering the current 578
consumer habits for strawberry storage and consumption at home, the use of MAP technology would 579
decrease losses by 18 %. Higher benefits would be expected by changing consumer behaviours: indeed, 580
79 % of them remove the packaging just after purchase before product storage which limits the benefit 581
of MAs and more than half of them stored the strawberries at ambient temperature and not in the 582
refrigerator. If the best storage conditions were maintained at home (i.e. all the consumers stored fruit 583
in the fridge and under MAP), strawberry losses would be reduced by more than 70 %. At ambient 584
temperature, if the MAP is maintained until consumption, loss reduction would be about 40 %. The 585
results obtained here confirmed the need to couple the cold chain and MAP technology, but it also 586
highlighted that the benefit of MAP was greater at ambient temperature than at refrigeration 587
temperature. Even if these results have to be confirmed by in vivo tests, the numerical exploration 588
presented here permitted for the first time to explore the impact of consumer practices on the benefit of 589
MAP for the strawberry post-harvest chain. One important conclusion is that the benefit of MAP will 590
remain very low if consumers are not informed that the packages should not be disrupted until the 591 moment of consumption. 592 593 Acknowledgement 594
This work was conducted in the context of the Pack4Fresh project funded by the INRA-CIRAD 595
Version postprint
5 Nomenclature
597
Parameter Definition Unit
𝐷 Maximum percentage of deterioration %
𝐸 , Activation energy for parameter 𝑘 J mol-1
𝑘 Deterioration rate constant s-1
𝐾𝑚 Constant of Michaelis and Menten Pa
x
CO2 CO2 concentration in the headspace at time t %x
CO2max Maximal inhibitory CO2 concentration (%) in the headspace %𝑘 Value of parameter k at reference temperature 𝑇
𝑙 Minimum percentage of losses %
𝑙 Maximum percentage of losses %
𝑙 Percentage of losses of the scenario 𝑠 using the packaging 𝑝 % 𝐿 Percentage of losses affected by stakeholder’s storage behaviour % 𝐿 Total percentage of losses affected by actor’s storage behaviour for all the scenarios of a population %
𝑃 Permeability of the film to O2 mol m-1 Pa-1 s-1
𝑃 Permeability of the film to CO2 mol m-1 Pa-1 s-1
𝑝 Partial pressure of O2 in the headspace Pa
𝑝 Partial pressure of CO2 in the headspace Pa
𝑝 Atmospheric partial pressure of O2 Pa
𝑝 Atmospheric partial pressure of CO2 Pa
𝑅 Maximum respiration rate per kilogram of food commodity mol kg-1 s-1
𝑇 , Reference temperature for the parameter 𝑘. K
𝛽 Rate of carbon dioxide production due to the deterioration mol s-1 %-1
𝐴 Surface area of the film m2
𝑎 Estimated parameters dimensionless
𝑏 Estimated parameters dimensionless
𝐷 Percentage of surface deterioration %
𝐷𝑎𝑐𝑐 Maximal acceptable deterioration %
𝑒 Thickness of the film m
𝑘 Temperature dependent parameter
𝑚 Weight of the food product kg
𝑝 State of the packaging: MAP or non MAP
𝑃𝑑 Probability related to storage duration: one or three days at the consumer dimensionless 𝑃 Probability related to packaging state: kept or removed packaging at
the consumer level dimensionless
𝑃 Probability related to storage temperatures: ambient or fridge storage at the consumer level dimensionless
𝑞𝑅𝑄 Respiratory quotient dimensionless
𝑅 Universal gas constant J mol-1 K-1
𝑠 Scenario
𝑠 Scenario having the highest value of deterioration integral 𝑠 Scenario having the smallest value of deterioration integral
𝑡 Time s
Version postprint
6 References
598
Aday, M.S., Caner, C., 2013. The shelf life extension of fresh strawberries using an oxygen absorber in 599
the biobased package. LWT - Food Sci. Technol. 52, 102–109. 600
https://doi.org/10.1016/j.lwt.2012.06.006 601
ADEME, 2016. Pertes et gaspillages alimentaires : l’etat des lieux et leur gestion par etapes de la chaine 602
alimentaire. 603
Almenar, E., Del-Valle, V., Hernández-Muñoz, P., Lagarón, J.M., Catalá, R., Gavara, R., 2007. 604
Equilibrium modified atmosphere packaging of wild strawberries. J. Sci. Food Agric. 87, 1931– 605
1939. https://doi.org/10.1002/jsfa.2938 606
Angellier-Coussy, H., Guillard, V., Guillaume, C., Gontard, N., 2013. Role of packaging in the 607
smorgasbord of action for sustainable food consumption. Agro Food Ind. Hi. Tech. 24, 15–19. 608
Baros, C., Hongre, J.B., 2017. Réduire le gaspillage des fruits et légumes frais en Ile de France de la 609
distribution au consommateur. Ile de France. 610
Belay, Z.A., Caleb, O.J., Opara, U.L., 2016. Modelling approaches for designing and evaluating the 611
performance of modified atmosphere packaging (MAP) systems for fresh produce: A review. 612
Food Packag. Shelf Life 10, 1–15. https://doi.org/10.1016/j.fpsl.2016.08.001 613
Cagnon, T., Méry, A., Chalier, P., Guillaume, C., Gontard, N., 2013. Fresh food packaging design: A 614
requirement driven approach applied to strawberries and agro-based materials. Innov. Food Sci. 615
Emerg. Technol. 20, 288–298. https://doi.org/10.1016/j.ifset.2013.05.009 616
Camanzi, L., Alikadic, A., Compagnoni, L., Merloni, E., 2017. The impact of greenhouse gas emissions 617
in the EU food chain: A quantitative and economic assessment using an environmentally extended 618
input-output approach. J. Clean. Prod. 157, 168–176. 619
https://doi.org/10.1016/j.jclepro.2017.04.118 620