HAL Id: hal-01927738
https://hal.archives-ouvertes.fr/hal-01927738
Submitted on 20 Nov 2018
HAL is a multi-disciplinary open access
archive for the deposit and dissemination of
sci-entific research documents, whether they are
pub-lished or not. The documents may come from
teaching and research institutions in France or
abroad, or from public or private research centers.
L’archive ouverte pluridisciplinaire HAL, est
destinée au dépôt et à la diffusion de documents
scientifiques de niveau recherche, publiés ou non,
émanant des établissements d’enseignement et de
recherche français ou étrangers, des laboratoires
publics ou privés.
from IODP–ICDP Expedition 364 downhole logs and
borehole imaging tools.
Johanna Lofi, David Smith, Chris Delahunty, Erwan Le Ber, Laurent Brun,
Gilles Henry, Jehanne Paris, Sonia Tikoo, William Zylberman, Philippe
Pezard, et al.
To cite this version:
Johanna Lofi, David Smith, Chris Delahunty, Erwan Le Ber, Laurent Brun, et al.. Drilling-induced
and logging-related features illustrated from IODP–ICDP Expedition 364 downhole logs and borehole
imaging tools.. Scientific Drilling, Copernicus Publications, 2018, 24, pp.1-13. �10.5194/sd-24-1-2018�.
�hal-01927738�
Sci. Dril., 24, 1–13, 2018
https://doi.org/10.5194/sd-24-1-2018
© Author(s) 2018. This work is distributed under the Creative Commons Attribution 4.0 License.
Repor
ts
Drilling-induced and logging-related features illustrated
from IODP–ICDP Expedition 364 downhole logs and
borehole imaging tools
Johanna Lofi1, David Smith2, Chris Delahunty3, Erwan Le Ber4, Laurent Brun1, Gilles Henry1,
Jehanne Paris1, Sonia Tikoo5, William Zylberman6, Philippe A. Pezard1, Bernard Célérier1,
Douglas R. Schmitt7,8, Chris Nixon7, and Expedition 364 Science Party*
1Géosciences Montpellier, University of Montpellier, CNRS, University of Antilles, Montpellier, France
2British Geological Survey, UK
3DOSECC Exploration Services, Salt Lake City, Utah, USA
4Department of Geology, University of Leicester, UK
5Department of Earth and Planetary Sciences, Rutgers University, New Jersey, USA
6Centre Européen de Recherche et d’Enseignement des Géosciences de l’Environnement,
Aix-en-Provence, France
7Department of Physics, University of Alberta, Canada
8Department of Earth, Atmospheric, and Planetary Sciences, Purdue University, Indiana, USA
*A full list of authors and their affiliations appears at the end of the paper.
Correspondence:Johanna Lofi ([email protected])
Received: 7 December 2017 – Revised: 14 September 2018 – Accepted: 24 September 2018 – Published: 22 October 2018
Abstract. Expedition 364 was a joint IODP and ICDP mission-specific platform (MSP) expedition to explore
the Chicxulub impact crater buried below the surface of the Yucatán continental shelf seafloor. In April and May 2016, this expedition drilled a single borehole at Site M0077 into the crater’s peak ring. Excellent quality cores were recovered from ∼ 505 to ∼ 1335 m below seafloor (m b.s.f.), and high-resolution open hole logs were acquired between the surface and total drill depth. Downhole logs are used to image the borehole wall, measure the physical properties of rocks that surround the borehole, and assess borehole quality during drilling and coring operations. When making geological interpretations of downhole logs, it is essential to be able to distinguish between features that are geological and those that are operation-related. During Expedition 364 some drilling-induced and logging-related features were observed and include the following: effects caused by the presence of casing and metal debris in the hole, logging-tool eccentering, drilling-induced corkscrew shape of the hole, possible re-magnetization of low-coercivity grains within sedimentary rocks, markings on the borehole wall, and drilling-induced changes in the borehole diameter and trajectory.
1 Introduction
Expedition 364 was a joint International Ocean Discov-ery Program (IODP) and International Continental Scientific Drilling Program (ICDP) Mission Specific Platform (MSP) expedition (Morgan et al., 2017). It drilled and cored a sin-gle borehole (Hole M0077A) at a shallow water depth in the Chicxulub impact crater buried below the surface of the Yucatán continental shelf (Mexico). This crater is the best
preserved of the three largest impact structures on the earth (Grieve and Therriault, 2000), has an intact, unequivocal to-pographic peak ring, is associated with a global ejecta layer, and has been directly linked to the K–Pg mass extinction (e.g., Schulte et al., 2010; Kring, 2007).
The post-impact sedimentary cover sequence (0–
617.33 m b.s.f.) and the peak ring of the Chicxulub impact crater (617.33–1334.69 m b.s.f.) were drilled during Expedi-tion 364 (Fig. 1c). Details on both scientific objectives and
~375 m DSF: artesian water flow up pipe when pipe unhooked from drill head
15.5 m DSF 503.6 m DSF 701.7 m DSF 1334.69 m DSF Cased 9 5/8" (24.45 cm) Drilled tricone 12 1/4" (31.11 cm) Cased SW OD 6 5/8" (16.83 cm) ID 6" (15.24 cm) Drilled tricone OHD: 7 7/8" (20.00 cm) Cased PWT OD 5 1/2" (13.97 cm) ID 5" (12.7 cm) Cored oversized PQ3 OHD: 5 7/8" (14.92 cm) Pipe ID: 10.3-12.4 cm Cored standard PQ3 OHD: 4 53/64" (12.26 cm) Pipe ID: 10.3-12.4 500 1000 Depth below seafloor (m b.s.f.) 10 100 200 300 400 600 700 800 900 1100 1200 1300 1400
DRILLING/CORING OPERATIONS RECOVERY LITHOLOGYCORE ACOUSTICCALIPER
30
POST-IMPACT CARBONATES
505.7 m DSF
UPPER PEAK RING
(suevite,
impact-melt rock)
LOWER PEAK RING
(granitoids, pre-impact dikes, suevite, impact-melt rocks)
DOWNHOLE LOGGING OPERATIONS
meanmax
(cm)
79–101 m DSF: mud circulation loss
6" centralizers
5" centralizers
~307 m DSF: misaligned casing and BHA obstruction 60-101 m DSF:
hole cementation
core 99R : drill bit blocked ~821 m DSF:
mud circulation loss (core 123R)
Pipe entrance
Casing entrance
Pipe entrance
~850 m w.s.f.: tool centralization loss
core 73R: drill bit fragment in core -> hole casing and cementation
cores 136R-138R (850.6–852.9 m DSF) : pieces of casing shoe found in liner
~936 m DSF: mud circulation loss (core 169) / possibly unstable zone ~505–509 m DSF: metal debris in core barrel M0077A NO CORING 5" centralizers 6" centralizers 0 HOLE TILT 5 (deg) 8" centralizers Change in borehole diameter UPPER INTERVAL MIDDLE INTERVAL LOWER A INTERVAL LOWER B INTERVAL
(a)
(b)
(c)
(d)
(e)
(f)
701.6 m DFS 823.2 m DFS 829.3 m DFSUnused bit Damaged
bit
Damaged bit Damaged bit
Oversized borehole
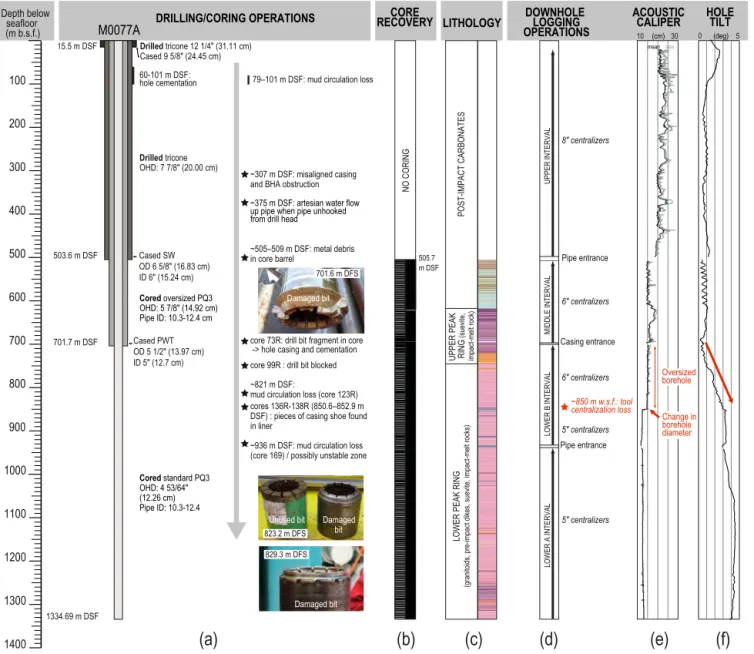
Figure 1.Summary of drilling, coring, and logging operations at Site M0077. The downhole logging data were acquired with slimline tools in three different phases (upper, middle, and lower intervals). Note the change in borehole diameter at ∼ 850 m w.s.f. (wireline seafloor) preceded by an increase in the borehole tilt (see discussion in Sect. 4.3). Pictures illustrate damaged drill bits. ID is the inner diameter, OD the outer diameter, and OHD the open hole diameter; m b.s.f. is meters below seafloor and DSF is the driller’s depth below seafloor.
operations can be found in the IODP proceeding volume (Morgan et al., 2017). In total, 303 cores were recovered from 505.7 to 1334.69 m b.s.f. (Fig. 1b). Open hole down-hole logs were acquired with slimline tools over almost the entire depth (Fig. 1d). Due to favorable borehole conditions, the recovery and overall quality of the downhole logging data are good to excellent, with the exception of the upper
∼400 m b.s.f. within the rotary drilled younger carbonates
that exhibit karst features.
In general, downhole wireline logging tools are used to measure a suite of physical properties within the rocks sur-rounding the borehole as well as to image the borehole wall.
These logs provide critical geological information about the rock formations close to the borehole, including their lithol-ogy, fluid content, porosity, and structural data such as the presence of faults and fractures. Where core recovery is in-complete, log data provide an invaluable way to character-ize the geological formation. Where core recovery is good, log and core data are complementary and can be interpreted jointly. In addition, downhole logs measure formation prop-erties on a scale that is intermediate between the one ob-tained from measurements on core samples at the labora-tory and the one obtained from surface geophysical surveys. Logging is thus useful for the integration of physical
prop-erties at various scales. Downhole logs can also allow the assessment of borehole quality (e.g., hole shape and trajec-tory) and can provide assistance with decision support dur-ing drilldur-ing and cordur-ing operations. Differentiatdur-ing between in situ natural geological features, generally also visible on cores, and drilling-induced or logging-related features is part of the data quality control process and is critical for the in-terpretation of well-log data. Logging-related and drilling-induced features have been described in several studies (e.g., Lofts and Bourke, 1999; Cheung, 1999); here, we provide ex-amples from Site M0077. We focus mainly on acoustic bore-hole images that provide invaluable source of information for sub-surface geology characterization. We will also show how downhole logs have been used to improve the post-operation understanding of the drilling and coring operation history.
2 Expedition 364 offshore operations
As for all MSP expeditions, the downhole logging program was coordinated by the European Petrophysics Consortium (EPC), which is part of the European Consortium for Ocean Drilling (ECORD) Science Operator (ESO). MSPs employ various coring technologies and pipe sizes (here PDC Tri-cone, oversize PQ3, PQ3; Fig. 1a) and drill in a variety of water depths (here <20 m water depth), each of which pro-vides technical constraints on the nature of logging opera-tions and the set of downhole geophysical tools that can be used on a case-by-case basis. Taking into account the techni-cal constraints, the logging program is designed to help meet the expedition-specific scientific objectives.
2.1 Overview of downhole logging operations
For Expedition 364, downhole logging operations at Site M0077 were funded by the ICDP. Slimline wireline log-ging services were contracted by EPC from the University of Montpellier–CNRS (France). Logged data included total gamma radiation, sonic velocity, acoustic and optical images of the borehole wall, electrical formation resistivity, induc-tion formainduc-tion conductivity, magnetic susceptibility, mag-netic field azimuth and intensity, and caliper and borehole fluid parameters (Table 1). Details on logging procedure and logging-tool measurement principles can be found in Mor-gan et al. (2017). Additional technical schemes on individ-ual logging tools and information can be found on the tool manufacturers’ websites (http://geovista.co.uk/, last access: 12 October 2018 and https://www.alt.lu/, last access: 12 Oc-tober 2018).
Logs were recorded either with stand-alone logging tools or for the first time in MSPs, with stackable ultra-slimline tools (tool diameter without centralizers: 3.8 to 5.2 cm) com-bined into tool strings. Most of the measurements were acquired in open borehole conditions (no casing). Hole M0077A was drilled using a series of drill strings of reduc-ing diameters down to the base of the hole at 1334.7 m b.s.f.
(Fig. 1a). The downhole logging runs were performed in stages in order to allow the hole to be cased and ensure the hole remained open and logs could be collected from the entire drilled interval. Data were acquired in three log-ging phases at intervals ∼ 0–503 (upper interval), ∼ 506–699 (middle interval) and ∼ 700–1334 m (lower interval) wire-line seafloor (m w.s.f.; Fig. 1d). In preparation for logging, the boreholes were either flushed of debris by circulating sea water (upper and lower intervals) or left filled with drill mud (middle interval). In each interval logged, the bottom hole assembly (BHA) was either pulled up, or entirely pulled out. During each logging run, incoming data were recorded and monitored in real time with a data acquisition system. As the
L/B Myrtledrill ship was jacked up above the sea surface,
there was no ship heave and thus no need to use a wireline heave compensator.
Advanced Logic Technology (ALT)’s WellCAD software package was used for the visualization, processing, and plot-ting of the downhole data. The processed data are avail-able online in the IODP database (http://mlp.ldeo.columbia. edu/logdb/scientific_ocean_drilling/, last access: 12 October 2018) along with information about how they were collected and processed. Further information can be found in Morgan et al. (2017). During the processing of the downhole log-ging data, both drilling-induced and loglog-ging-related features were noticed. These are described below, and should be kept in mind when making any future geological interpretations of the logging data. In addition, most of the features dis-cussed are not specific to Expedition 364 or to slimline tools and could be observed in logging data acquired during other IODP Expeditions.
2.2 Borehole-imaging logging tools
Borehole-imaging logging tools are commonly used by both the IODP and ICDP (e.g., Lovell et al., 1998). They involve measuring either the electrical conductivity of the borehole wall (Formation MicroScanner tool, Pezard and Lovell et al., 1990; Gaillot et al., 2007; Pezard et al., 1992a, b; Ekstrom et al., 1987) or the sonic travel time and amplitude of a re-flected ultrasonic pulse (acoustic borehole imager – ABI – in this study; Table 1; Zemanek et al., 1969, 1970; Zoback and Anderson, 1982; Anderson and Zoback, 1983; Hayman et al., 1998). A third category allows for the recording of an optical image of the borehole wall (optical borehole imager – OBI – in this study; Table 1; e.g., Paillet et al., 1990; Inwood et al., 2008).
During Expedition 364, both optical and acoustic bore-hole imagers were used. The OBI tool used has the ability to produce high-resolution optical images of the borehole wall down to a millimeter scale (https://www.alt.lu/). This logging tool incorporates a high-resolution, high-sensitivity CCD digital camera located above a conical mirror that cap-tures the image of the borehole wall. The light source is pro-vided by an LED ring assembly located in the optical head.
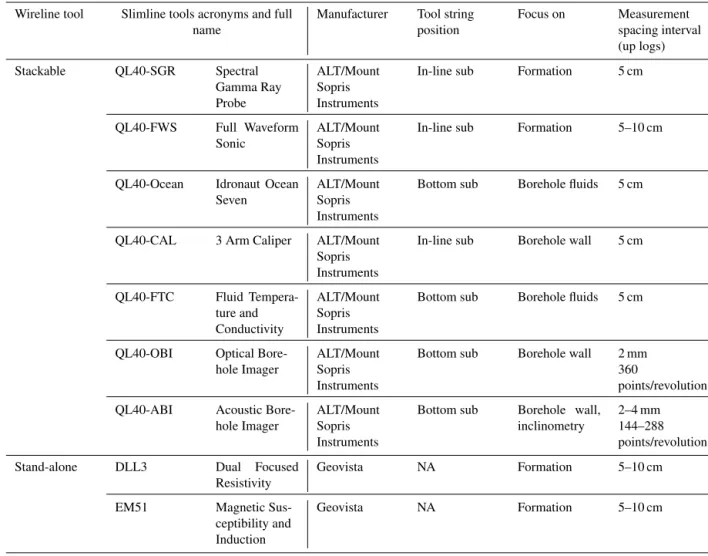
Table 1.Summary of wireline slimline probes; Expedition 364. Modified from Morgan et al. (2017). Wireline tool Slimline tools acronyms and full
name
Manufacturer Tool string position Focus on Measurement spacing interval (up logs) Stackable QL40-SGR Spectral Gamma Ray Probe ALT/Mount Sopris Instruments
In-line sub Formation 5 cm
QL40-FWS Full Waveform Sonic
ALT/Mount Sopris Instruments
In-line sub Formation 5–10 cm
QL40-Ocean Idronaut Ocean Seven
ALT/Mount Sopris Instruments
Bottom sub Borehole fluids 5 cm
QL40-CAL 3 Arm Caliper ALT/Mount Sopris Instruments
In-line sub Borehole wall 5 cm
QL40-FTC Fluid Tempera-ture and Conductivity ALT/Mount Sopris Instruments
Bottom sub Borehole fluids 5 cm
QL40-OBI Optical Bore-hole Imager
ALT/Mount Sopris Instruments
Bottom sub Borehole wall 2 mm 360
points/revolution QL40-ABI Acoustic
Bore-hole Imager
ALT/Mount Sopris Instruments
Bottom sub Borehole wall, inclinometry
2–4 mm 144–288 points/revolution
Stand-alone DLL3 Dual Focused
Resistivity
Geovista NA Formation 5–10 cm
EM51 Magnetic
Sus-ceptibility and Induction
Geovista NA Formation 5–10 cm
Notes: ALT is advanced logic technology. QL stands for quick link.
By using processed camera data in combination with devia-tion sensor data, the tool can generate an unwrapped image
oriented by 360◦. Image quality degrades with hole
diame-ters larger than 15 cm (6 in.) and with the presence of mud in the borehole, as the tool is designed for logs either in air or clear water. The OBI tool cannot be used in the presence of mud cake. During Expedition 364, OBI images during up logs were acquired with various resolutions, ranging from 360 samples by 4 mm or 360 samples by 2 mm (Table 1, Mor-gan et al., 2017).
The ABI downhole tool used during Expedition 364 pro-duces a 1.2 MHz ultrasonic pulse sent toward the borehole wall (https://www.alt.lu/). Both the amplitude and two-way travel time of its first echo from the borehole wall (geolog-ical formation) are recorded. Two-way travel-time data can
be processed to calculate a 360◦borehole caliper. To obtain a
360◦image, a focusing acoustic mirror pivots around a
cen-tral axis. As for the OBI images, the ABI images are oriented with respect to the magnetic north thanks to deviation sensor data and are displayed as an unfolded representation of the
360◦ view. The image resolution is determined by the user
and depends on the number of measurements made in one rotation and the rate at which the tool is raised up the bore-hole while measurements are made. During Expedition 364, ABI40 acoustic images from up logs were acquired with var-ious resolutions, ranging from 288 samples by 2 mm to 144 samples by 4 mm (Table 1, Morgan et al., 2017). Acquisi-tion of the 1st echo is automatically picked within an acous-tic reflection time window whose limits can be set up either automatically or manually by the operator. The latter is use-ful when the formation echo is weak and can be mixed with echoes, multiples, or when borehole fluid contains particles that return a false first echo. As for the OBI, image quality will degrade with hole diameters larger than 15 cm and with the presence of mud in the borehole fluid due to the higher attenuation of the ultrasonic pulse.
0°N 90° 180° 10 20 30 40 m 10 20 30 40 10 20 30 40 m 10 20 30 40 m M0077A borehole deviation
270° 41.34 m
(a)
(b)
100 300 500 700 800 850 900 950 1000 1050 1100 1150 1200 1250 1300 Change in borehole azimuth 520 530 540 Depth (m w.s.f.) 550 560 570 580 590 600 610 7 6 5 7 6 5 4 3 Distance westward (m) Distance southward (m) 510 100 200 300 400 500 600 700 800 900 1000 1100 1200 1300 Depth (m w.s.f.)Horizontal distance southward (m)
TD 1334.35 m WSF Projected depth 1333.02 m 0 10 20 30 40 Increase in borehole tilt
]
0.0 0.7 1.8 2.4 2.9 3.6 4.3 4.7 5.2 5.4 5.7 6.0 6.4 6.9 7.2 7.6 8.0 9.8 12.7 15.3 18.2 21.4 24.9 28.5 32.0 35.4(c)
7 6 5 7 6 5 4 3 Corkscrew hole shapeFigure 2.(a) true vertical depth and southward deviation of Hole M0077A. Note the increase in borehole tilt between 750 and 850 m w.s.f. (b) top view projection of the borehole path (modified from Gulick et al., 2017). Note the change in hole direction from southwest to southeast between 800 and 950 m w.s.f. (c) zoom on the 500–610 m w.s.f. interval in post-impact carbonates illustrating a corkscrew borehole shape. m w.s.f. is meter wireline depth below seafloor.
3 Logging-related features
Logging-related features arise from the downhole logging-data acquisition phase and mainly result from logging-tool eccentering, logging-tool malfunctions, and signal perturba-tion by an external factor (e.g., steel pipe for magnetic data).
3.1 Steel pipe and metal debris
Both the OBI and ABI contain a three-axis magnetometer and three accelerometers that allow for the orientation of the logging tools with respect to the magnetic north (azimuth) and vertical direction (tilt) to be determined. Such informa-tion can be used to compute the borehole’s trajectory in 3-D (Fig. 2) and is key in orienting the borehole images with respect to the magnetic north. Consequently, any perturba-tion of the local earth’s magnetic field to the borehole pre-vents the proper registration of the true magnetic north by the logging tool and results in incorrectly displayed or oriented borehole images. This problem is most commonly observed when, during up-log acquisition, the bottom entrance to the steel pipe or casing is approached as the presence of this fer-rous metal locally distorts the magnetic field (e.g., Lofts and Bourke, 1999; Shipboard Scientific Party, 1993). During Ex-pedition 364, this phenomenon has been clearly observed in both ABI and OBI data. In Fig. 3, perturbation in the ABI im-age and azimuth starts about 1.4 m below the casing entrance and increases upward (Fig. 3a, b, d). A deviation in the mag-netic field intensity is also observed, starting ∼ 2.5 m below
the casing (Fig. 3e). The disturbance of the total magnetic field (Fig. 3e), calculated from the three magnetometer com-ponents (X, Y , Z), starts deeper than the one of the azimuth (Fig. 3d), which is derived from the radial components (X,
Y). This is because the axial component of the pipe
magne-tization is stronger than the radial one. As a consequence, the axial component (Z) of the magnetometers on the log-ging tool is more influenced by the pipe further below than the radial components (X, Y ) that are disturbed much closer to the pipe. Importantly, it is also notable that the depths at which the perturbations are observed below the pipe entrance are overestimated by ∼ 1.2 m for both the ABI image and azimuth and the total magnetic field intensity logs. This is related to the way the ABI images are processed in the Well-CAD software and how the depths of the various sensors are
displayed. Indeed, for a given depth, the 360◦ABI image is
oriented with respect to the magnetic north thanks to the de-viation sensor data that are acquired 1.2 m above the acoustic window data at the same instant. The magnetic field is thus assumed to be constant over this 1.2 m long interval, which is true most of the time, with the exception of the presence of a strong magnetic anomaly such as the one generated by the casing. As a consequence, the perturbation of the total magnetic field starts in reality about 1.3 m below the casing entrance while the perturbation of the azimuth occurs when the magnetometers inside the ABI almost reach the casing shoe. For future works on the IODP expedition 364 down-hole magnetic data from Site M0077, both the azimuth and
ACOUSTIC IMAGES (ABI) ORIENTED TO MAGNETIC NORTH
Depth (m w.s.f.)
Amplitude Travel time
0 1800
0° 90°180°270° 0° 0° 90°180°270° 0°
Azimuth
Tilt Magn. field
0 deg360 0 deg 1 0 µT 110 507 508 509 510 Casing Casing Magnetometer data Open hole Open hole (a) (b) (c) (d) (e)
Figure 3.Commonly encountered magnetometer perturbation ob-served when approaching the entrance of a steel pipe or casing as the presence of metal close to the tool perturbs the magnetic field (d, e). As a result, the acoustic borehole image is incorrectly displayed and oriented (a, b). Grey shaded area indicates the zone under casing in-fluence, overestimated here (see discussion in Sect. 3.1). m w.s.f. is meter wireline depth below seafloor.
magnetic field logs should thus be shifted upward by 1.2 m over the entire hole before any interpretation.
Localized perturbations in the magnetometer data have also been noted elsewhere in open hole along the borehole and may possibly be related to the presence of highly magne-tized formations (Gaillot et al., 2004). The presence of pieces of metal lodged in the borehole wall as a consequence of technical difficulties during the drilling operations can also cause perturbations in the magnetometer data (e.g., azimuth and magnetic field spikes at ∼ 851 m w.s.f. in Fig. 4m). These metal pieces are also revealed by anomalous spikes on both the magnetic susceptibility (MSUS) and formation conduc-tivity (IL) logs (e.g., ∼ 850 m w.s.f. on Fig. 4n). Note that the azimuth and magnetic field spikes are lying ∼ 1 m be-low the MSUS and IL spikes as a result of the 1.2 m pro-cessing offset previously discussed. Once corrected from this offset, all anomalies align coherently at the same depth (∼ 850 m w.s.f.).
3.2 Logging tool eccentering effect on images
Logging tool eccentering commonly occurs in non-circular holes or over intervals that are caved or washed out beyond the dimensions of the centralizers (e.g., Lofts and Bourke, 1999). As a consequence, the logging tool is no longer cen-tered in the borehole. Not all the wireline logging tools are
sensitive to eccentering, which particularly affects acoustic borehole imaging quality.
During Expedition 364, the ABI and OBI logging tools were run with two centralizers to ensure tool centralization. Yet, tool eccentering appears to have affected the ABI data across some depth intervals. Tool eccentering is generally expressed by dark and light stripes on the amplitude images, as eccentering causes the amplitude to increase at azimuths where the tool is closer to the borehole wall, and vice versa (e.g., Lofts and Bourke, 1999). In Hole M0077A, logging-tool eccentering is illustrated in Fig. 5 by two sets of ABI data acquired over the same depth interval (Fig. 5-1 and 5-2). Travel-time cross sections clearly illustrate the non-circular shape of the hole over this interval (Fig. 5c, f). On the am-plitude images two dark stripes (see blue arrows in Fig. 5a, d) appear as regular, almost vertical non-planar features that are not randomly oriented. Their azimuths are highlighted by the bold blue lines on the travel-time cross sections (Fig. 5c, f). They correlate with portions of the borehole wall that are orientated obliquely with respect to the incident angle of the acoustic wave. This sloping angle of incidence is likely to lead to signal scattering over these sections of the bore-hole and be associated with low amplitudes in the recorded data. The amplitude of the acoustic signal indeed depends on the surface roughness of the borehole wall, the acoustic impedance contrast between the borehole fluid (or mud cake) and the formation, the attenuation in the borehole fluid, and the angle of incidence. In this case, logging-tool eccentering
is not expressed by the classical dark and light stripes at 180◦
from each other (Lofts and Bourke, 1999), probably because the eccentering occurs in a non-circular-shaped hole (Fig. 5c and f) instead of a circular one.
Over the same interval, the azimuths of the two dark stripes are not the same when comparing Up-log 1 (Fig. 5a, c) and Up-log 2 (Fig. 5d, f). This difference suggests that the position of the logging tool in the hole was different, and that the tool followed two different trajectories during the succes-sive up-logs. The amplitude images acquired on up-logs 1 and 2 (Fig. 5a, d) have been merged (Fig. 5g). The resulting image clearly shows an abrupt jump in the orientation of the dark low amplitude stripes at ∼ 610.6 m w.s.f. This feature, which is entirely related to eccentering, should not be misin-terpreted and taken as an incorrect display or orientation of one of the two ABI images (either Up-log 1 or Up-log 2). Indeed, the correct orientation of both Up-log 1 and Up-log 2 images is confirmed by the “F” sedimentary feature which displays the same orientation on each of the amplitude and travel-time images (white arrows in Fig. 5a, b, d, e, g).
4 Drilling-related features
Drilling-related features are physically produced during the drilling or coring phase. They include any operation that may have affected the shape or trajectory of the hole (e.g.,
ream-0 deg360 2 deg 4 0 uT100
ACOUSTIC IMAGES (ABI) ACOUSTIC IMAGES (ABI) ACOUSTIC IMAGES (ABI) Up-log 1 0deg360 2deg 4 0 uT100 Up-log 2 0 deg360 2 deg 4 0 uT100
Merged up-logs 1 and 2
1 2 3 MSUS 0 SI IL 3 mmho 12 cm Azimuth Tilt Magn. field 820 830 840 850 860 870 880 Depth (m w.s.f.) Travel-time cross section µs 50 100 Amplitude Travel-time µs 00°90°180°270°3000 600°0°90°180°270° 900° Travel-time cross section µs 50 100 Amplitude Travel-time µs 0 3000 60 90 0°90°180°270°0° 0°90°180°270°0° Travel-time cross section µs 50 100 Amplitude Travel-time µs 0 3000 60 90 0°90°180°270°0° 0°90°180°270°0° 820 830 840 850 860 870 880 820 830 840 850 860 870 880 acoustic (mean, max) calipers bit size 18 820 830 840 850 860 870 880 3000 0.35 Mechanic &
acquired with 5" centralizers
Azimuth Tilt Magn. field acquired with 6" centralizers
Azimuth Tilt Magn. field
Tool centralization lost as a result of borehole enlargement Metal piece lodged in the borehole wall 0° 270° 180° 90° 0° 270° 180° 90° 0° 270° 180° 90° 0° 270° 180° 90° 0° 270° 180° 90° 0° 270° 180° 90° 0° 270° 180° 90°
(a) (b) (c) (d) (e) (f) (g) (h) (i) (j) (k) (l) (m) (n)
Figure 4.Drilling induced borehole enlargement as a result of fallen metal pieces (see discussion in Sect. 4.3). (1) Up-log 1; (2) Up-log 2; (3) merged Up 1 and Up 2 logs. Change in borehole diameter is evidenced at ∼ 850 m w.s.f. by acoustic borehole image data (b, f, j, l). The presence of steel pieces lodged in the borehole wall at the same depth is highlighted by azimuth, magnetic field, magnetic susceptibility, and conductivity spikes (m, n). Note that the travel-time cross sections’ lower limits have been set to 50 µs (c, g, k). m w.s.f. is meter wireline depth below seafloor.
Figure 5.Example of tool eccentering effect in a non-circular borehole. (1) Up-log 1; (2) Up-log 2; (3) merged Up 1 and Up 2 logs. Two dark low-amplitude stripes (blue arrows) are observed on the ABI amplitude images (a, d). Their location is highlighted with the bold blue lines on the travel-time cross sections (c, f). Over the same interval, the azimuth of these stripes varies depending on the up-log (1 or 2), resulting in a stepped change in stripe orientation on the merged image (g). This is interpreted as a change in tool eccentering between the two successive acquisition passes. The sedimentary feature “F” (white arrows), which shows the same azimuth on both up-logs (a, d, g), attests to the correct orientation of both sets of images. Note that travel-time cross sections’ lower limits have been set to 80 µs (c, f). m w.s.f. is meter wireline depth below seafloor.
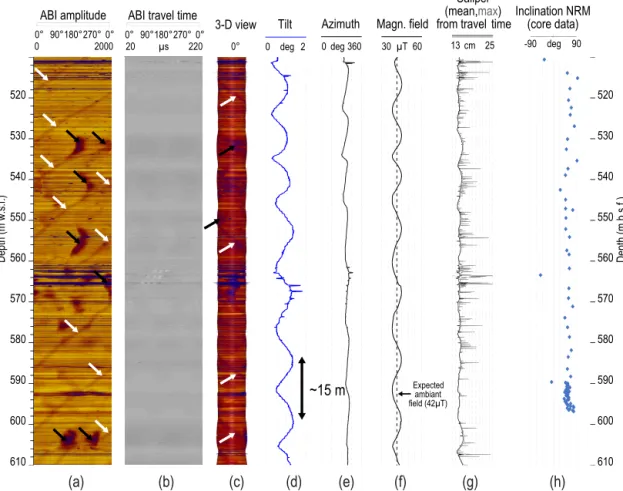
Figure 6.Drilling-induced corkscrew borehole shape in the post-impact carbonates, possibly due to drill bit wobble, steel wedged at the bit or overfeed of rods. This shape (see also Fig. 2c) is evidenced by cyclic oscillations in both accelerometer (tilt) and magnetometer (azimuth) data (d, e). One continuous regular spiraling narrow dark stripe (white arrows in a and c) may result of the drill pipe rubbing on the carbonate formation. Drilling induced re-magnetization of the formation is tentatively proposed to account for the cyclic changes observed in the magnetic field (f). (h) Non-demagnetized NRM measured on core samples dominated by positive inclination (indicative of normal polarity), suggesting a pervasive normal polarity remagnetization. m w.s.f. is meter wireline depth below seafloor; m b.s.f. is meters below seafloor.
ing), drill marks on the borehole wall, and the in situ pollu-tion by debris produced by the drilling operapollu-tions (e.g., here, metal pieces of casing and stuck drill bits that were ground up).
4.1 Corkscrew hole and formation re-magnetization
Boreholes are rarely drilled as perfect vertical cylinders. In particular, some drilling operations can cause the borehole to take the shape of a corkscrew (spiral). Such a shape can result from drilling and reaming operations including the bit-whirl and wiper trips. In the post-impact carbonates at Site M0077, 10 to 15 m long regular undulations are observed in both the tilt and azimuth of the ABI logging-tool data between 510 and 610 m w.s.f. (Fig. 6d, e). Tilt and azimuth are provided by two distinct types of sensors, accelerometers (accuracy: ±0.5 degree) and magnetometers (accuracy: ±1.2 degree), respec-tively. The observed undulations are interpreted as reflecting
a corkscrew shaped hole (see zoom of the borehole trajec-tory over this depth interval in Fig. 2c). Oscillations <2 cm in the acoustic borehole caliper are also observed with a shorter wavelength (2–8 m). The local presence of one or two large low-amplitude dark stripes on the ABI amplitude im-age (black arrows in Fig. 6a, c) occurred where the borehole shows a non-circular shape and is enlarged. As discussed in Sect. 3.2, these stripes possibly reflect logging-tool eccenter-ing. Superimposed on these possible eccentering features, the amplitude image also displays one continuous, spiraling, nar-row dark stripe (white arnar-rows in Fig. 6a, c) wherein the path is independent of the changes in borehole diameter and shape in cross section. A clear link is, however, observed between the orientation of this stripe and the tilt and azimuth (Fig. 6a, d, e). The origin of the stripe remains unclear, but based on the tight link with borehole geometry, we suggest that it may reflect a mark on the borehole wall (see also Sect. 4.2) re-sulting from the drill pipe rubbing the carbonate formation
during operations. This can occur as the bit engages the for-mation and the stand drill-pipe torques into a helical.
At the drill site, the expected ambient field intensity as given by the World Data Center for Geomagnetism (http: //wdc.kugi.kyoto-u.ac.jp/index.html, last access: 12 Octo-ber 2018) is ∼ 42 µT (Fig. 6f), which corresponds to the mean intensity value measured by the magnetometers over the 510 and 610 m w.s.f. intervals. However, apparent 10– 15 m long cyclic oscillations in the local magnetic field are also observed with values ranging between 38.2 and 45.5 µT (Fig. 6f). These oscillations in the magnetic field intensity (as measured by the magnetometers) vary jointly with the bore-hole tilt (as measured by the accelerometers). High values in the local magnetic field (Fig. 6f) correlate with high tilts (Fig.6d), and vice versa. We tentatively interpreted this cycli-cal pattern in magnetic field intensity as a possible drilling-induced magnetization overprint in the surrounding rocks. Indeed, in the 510 and 610 m w.s.f. interval, the lithology mainly consists of marlstone and limestone (Morgan et al., 2017) with low coercivity (Urrutia-Fucugauchi et al., 2017). Such material is susceptible to acquiring drilling-induced magnetization (e.g., Jackson and Van der Voo, 1985). The ef-fect of drilling and sawing on the magnetization of rocks is a known phenomenon, and the magnetic overprint imparted by the drill string is a problem commonly encountered in cores taken by the IODP (e.g., Fuller et al., 1998). Preliminary pa-leomagnetic measurements performed on discrete samples within this depth interval (Fig. 6h) suggest that a pervasive normal polarity re-magnetization of the carbonates likely oc-curred within the low-coercivity fraction of magnetic grains, supporting the idea that overprinting may readily occur in this formation. Therefore, we suggest that the drilled carbon-ates have undergone magnetization overprinting during the drilling operations possibly as a result of the rotary perfora-tion of the formaperfora-tion associated with the presence of a steel BHA, steel wedged at the bit or overfeed of rods. As the changes in ambient field intensity follow the changes in the borehole tilt, we also suggest a possible link between the de-gree of drilling-induced magnetization and the drilling condi-tions that cause the borehole to take the shape of a corkscrew.
4.2 Borehole wall drilling marks
During Expedition 364, helical stripes with a wavelength of
∼0.2 m are observed locally on the borehole wall images
acquired in the peak-ring granitoids (Fig. 7). They are evi-denced through either low amplitudes zones on the ABI im-ages or dark zones the OBI imim-ages (arrows in Fig. 7a, b, d). They are also slightly visible on the travel-time images (Fig. 7a). Unlike the corkscrew related stripes (see Sect. 4.1 above), these stripes are not associated with any changes in the borehole tilt or azimuth (Fig. 7e, f). They are interpreted as drilling-induced markings on the borehole wall, left by a drilling tool in a relatively soft, shock-metamorphosed
gran-ite with an unusually low density (Morgan et al., 2016, 2017; Christeson et al., 2018).
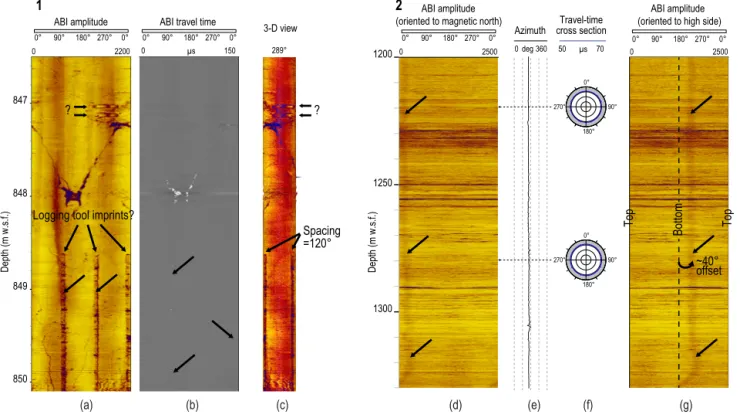
In another example, at a larger scale, a low amplitude, dark stripe (Fig. 8d) is observed in the lower half of the hole
(Fig. 8d) where the tilt is increased to about 4.2◦(Fig. 2a and
b). The mean orientation of the path of the stripe is ∼ 25◦N
(Fig. 8d). Orienting the image to the high side (Fig. 8g) in-stead of to the magnetic north (Fig. 8d) clearly shows that the stripe is parallel to the axis of the hole, thus illustrating a clear link between the presence of this stripe and the bore-hole inclination. We thus tentatively interpreted this large-scale stripe as a key-seat-related feature that developed in the inclined part of the hole because the drill pipe was rubbing the bottom side of the borehole. However, no clear groove cut is observed on the acoustic caliper data (Fig. 8f). In addition,
the stripe is not oriented to 180◦(i.e., aligned on the lowest
part of the hole), as expected from a key seat, but at ∼ 220◦,
i.e., with an offset of ∼ 40◦(Fig. 8g) westward. This angular
offset may result from the change in azimuth of the hole ob-served at 850 m w.s.f. (Fig. 2b), which deviated the drill pipe and forced it to the lateral westward side of the borehole.
4.3 Drilling induced borehole enlargement
Below ∼ 700 m w.s.f., the borehole shape at Site M0077 was good to excellent (Fig. 1e). During up-log ABI data acquisition, logging-tool centralization was however lost at
∼850 m w.s.f. (Fig. 1d), suggesting drastic borehole
enlarge-ment. The tool string was brought back to the surface and the
500 centralizers replaced by 600 centralizers. These later
al-lowed for a proper centralization of the logging tool string from 850 to ∼ 702 m w.s.f. (casing entrance). As shown in Fig. 4l, this borehole enlargement is confirmed by acous-tic travel-time data that evidence a change in diameter from
∼12.5 cm (close to the outside diameter of the drill bit of
12.26 cm) below 850 m w.s.f. to ∼ 14.7 cm (∼ 2.5 cm larger than the outer bit diameter) above 850 m w.s.f. (Fig. 1a). The enlarged borehole diameter is observed over the entire 850– 702 m w.s.f. interval (Fig. 1e).
No clear explanation exists to account for this oversized borehole since (1) although the drill bit has been replaced by a new one at 823.24, 829.34 and 851.65 DSF (driller’s depth below seafloor), the entire 702–1334 m b.s.f. interval was nominally drilled with the same bit size (Fig. 1a), and (2) no major change in lithology is observed at 850 m w.s.f., except for the presence of a ∼ 5 m thick dolerite dike intru-sion, extending from 846.3 to 851.1 m b.s.f. (Fig. 1c). This dike is characterized by a high amplitude on the ABI image (yellowish color in Fig. 4e, i), as dolerites are harder than the surrounding granite. It also has a higher magnetic suscepti-bility (Fig. 4n), as dolerites are enriched in iron compared to granitoids. The change in lithological properties when en-tering in the dolerite dike was probably responsible for the need to change the drill bit at ∼ 851 DSF. However, it cannot
Depth (m w.s.f.)
1009
1010
1011
1012
Amplitude Travel time
µs
0 2200 65 75
0° 90°180°270°0°
ACOUSTIC IMAGES (ABI) 0° 90°180°270° 0°
43° 3-D view
Caliper (mean,max) from t ravel time
cm 12 14 Magn. field 40µT 50 Tilt 0 deg 5 Azimuth 0deg360 ~0.2 m OPTICAL IMAGE 0° 90°180°270°0° Figure 7
(a)
(b)
(c)
(d)
(e)
(f)
(g)
(h)
Figure 7.Drilling-induced helical marking on the borehole wall, evidenced by helical stripes (arrows) on both the optical and acoustic borehole images. m w.s.f. is meter wireline depth below seafloor.
Depth (m w.s.f.)
ABI amplitude ABI travel time
µs 3-D view 847 848 849 850 0 2200 0 150 289° 0° 90° 180° 270° 0° 0° 90° 180° 270° 0° Spacing =120° Logging tool imprints?
?
1 2
Depth (m w.s.f.)
ABI amplitude (oriented to magnetic north) 1200 1250 1300 0 2500 0° 90° 180° 270° 0° Azimuth 0deg360 ABI amplitude (oriented to high side)
0 2500 0° 90° 180° 270° 0° Top Bottom Top ~40° offset (a) (b) (c) (d) (e) (g) ? Travel-time cross section µs 50 70 0° 270° 180° 90° 0° 270° 180° 90° (f)
Figure 8.Marks on the borehole wall. (1) possible tool imprint oriented to 120◦, and residue possibly left in mud residue by arms of the mechanical caliper. (2) ABI image oriented with respect to the magnetic north (d) and to the high side, (g) illustrating that the continuous regular narrow dark stripe (black arrows) is closely related to borehole inclination and may be the result of the drill pipe rubbing on the borehole wall. (f) travel-time cross section (magnetic north orientation) illustrates a regular borehole shape with no evidence for groove cut to be associated with the narrow dark stripe. Note that the travel-time cross sections’ lower limit has been set to 50 µs.
explain why the borehole diameter is oversized above that depth.
Besides the change in borehole diameter, large spikes in both conductivity and magnetic susceptibility are also no-ticeable at ∼ 850 m w.s.f. (Fig. 4n). These anomalies are not observed on resistivity and magnetic susceptibility MSCL data acquired on whole round cores taken at the same depth (Morgan et al., 2017), and we consequently interpret these spikes as reflecting the presence of pieces of metal lodged in the borehole wall. This interpretation appears to be con-firmed by pieces of steel that were found in the liners of cores 136R–138R (850.6–852.9 m DSF), among which a large piece (>1 cm) of a casing shoe found in the liner of core 137R (Fig. 1a) and coming from the casing shoe po-sitioned at ∼ 702 m w.s.f. Some other pieces possibly come from a misaligned casing located at ∼ 307 m w.s.f., which we drilled through during the coring operations, as well as from a broken drill bit (Fig. 1a, picture of drill bit replaced at 701.6 m DSF). In order to explain for the oversized borehole diameter over the 702–850 m w.s.f. interval, we tentatively suggest that some large pieces of casing shoe and damaged drill bit were trapped outside the drill bit during the coring phase, which led to an enlargement of the hole over this en-tire interval in the relatively soft granitic basement. The dam-ages done to the successive drill bits are illustrated in Fig. 1a (pictures of drill bits replaced at 823.2 and 829.3 m DSF). Although the hole shape remained relatively subcircular, a change in borehole quality is clearly observed on both the ABI amplitude image (Fig. 4i) and mean caliper (Fig. 4l) when crossing 850 m w.s.f., with a smoother borehole below 850 m w.s.f. and a more rugose one just above. The presence of these pieces of metal outside the drill bit also seems to have affected the borehole trajectory at some point, since a drastic increase of the borehole tilt and a clear change in the borehole azimuth are observed from ∼ 750 to 850 m w.s.f. (Fig. 1f and Fig. 2a, b). The above observations are a nice example of how operational difficulties at shallower depths indirectly induced changes in borehole diameter, shape and trajectory at greater depths.
Just before the change in borehole diameter described above, we noticed the presence in both the amplitude and travel time of borehole images of an unusual feature
consist-ing of three vertical narrow stripes oriented to 120◦and
ex-tending from 846 to 850.4 m w.s.f. (Fig. 8a, b). This feature cannot be interpreted as drill marks (see also Sect. 4.2) on the borehole wall, since no drill tool with such a shape has been used during the drilling/coring operations. We believe that these marks have been left by the three arms of the me-chanical caliper in a thin layer of mud residue covering the borehole wall. This mud may have been left over from the formation during flushing because of the borehole enlarge-ment and associated increase in the annular space between the pipe and the geological formation, thus reducing annular circulating fluid velocity. If this interpretation is correct, this is an example of a combined drilling- and logging-induced
feature. Above these vertical imprints, two sub-horizontal features are observed at ∼ 847 m w.s.f. (Fig. 8a). Their ori-gin remains unknown so far.
5 Conclusions
Differentiating geological features from operation-related features is critical for downhole logging-data quality con-trol and interpretations. High quality data were acquired downhole with slimline tools during the IODP–ICDP Expe-dition 364. Yet, some non-geological features are observed and illustrated in this paper. Such features are grouped in two families: logging-related and drilling-induced features. We mainly focus on acoustic borehole images that pro-vide invaluable source of information for sub-surface geol-ogy characterization but are also very sensitive to acquisi-tion context and borehole condiacquisi-tions. Slimline tools are of-ten used in MSP expeditions (e.g., IODP Expeditions 310, 313, 325, 364, 381), as MSPs employ various coring tech-nologies and pipe sizes that provide constraints on the di-ameters of logging tools to be used. This methodology is different from other IODP platforms, the JOIDES Resolu-tion and the Chikyu, where the fixed larger pipe sizes allow larger diameter standard sets of logging tools to be deployed. The logging-related and drilling-induced features presented and discussed in this paper are based on data acquired with slimline tools, but most of them should be valid for standard tools.
Data availability. Downhole logging data are stored and made available on the IODP log database (see also page 3, sec-ond paragraph in this article): http://mlp.ldeo.columbia.edu/logdb/ scientific_ocean_drilling/
Team list. Expedition 364 Scientists: Sean P. S. Gulick (Institute for Geophysics and Department of Geological Sciences, Jackson School of Geosciences, University of Texas at Austin, Austin, TX, USA), Joanna V. Morgan (Department of Earth Science and En-gineering, Imperial College London, London, UK), Elise Chenot (Biogéosciences Laboratory, Université de Bourgogne-Franche Comté, Dijon, France), Gail L. Christeson (Institute for Geophysics and Department of Geological Sciences, Jackson School of Geo-sciences, University of Texas at Austin, Austin, TX, USA), Philippe Claeys (Analytical, Environmental and Geo-Chemistry, Vrije Uni-versiteit Brussel, Brussels, Belgium), Charles S. Cockell (Centre for Astrobiology, School of Physics and Astronomy, University of Edinburgh, Edinburgh, UK), Marco J. L. Coolen (Department of Chemistry, WA-Organic and Isotope Geochemistry Centre, Curtin University, Perth, Western Australia, Australia), Ludovic Ferrière (Natural History Museum, Vienna, Austria), Catalina Gebhardt (Al-fred Wegener Institute Helmholtz Centre of Polar and Marine search, Bremerhaven, Germany), Kazuhisa Goto (International Re-search Institute of Disaster Science, Tohoku University, Sendai, Japan), Sophie Green (British Geological Survey, Edinburgh, UK),
Heather Jones (Department of Geosciences, Pennsylvania State University, University Park, PA, USA), David A. Kring (Lunar and Planetary Institute, Houston, TX, USA), Chris M. Lowery (Institute for Geophysics and Department of Geological Sciences, Jackson School of Geosciences, University of Texas at Austin, Austin, TX, USA), Claire Mellett (British Geological Survey, Edinburgh, UK), Rubén Ocampo-Torres (ICPEES, Université de Strasbourg, Stras-bourg, France), Ligia Perez-Cruz (Instituto de Geofísica, Universi-dad Nacional Autónoma De México, Mexico City, Mexico), An-nemarie E. Pickersgill (School of Geographical and Earth Sciences, University of Glasgow, Glasgow, UK), Michael Poelchau (Depart-ment of Geology, University of Freiburg, Freiberg, Germany), Au-riol S. P. Rae (Department of Earth Science and Engineering, Impe-rial College London, London, UK), Cornelia Rasmussen (Institute for Geophysics and Department of Geological Sciences, Jackson School of Geosciences, University of Texas at Austin, Austin, TX, USA), Mario Rebolledo-Vieyra (Independent consultant, Cancun, Mexico), Ulrich Riller (Institut für Geologie, Universität Hamburg, Hamburg, Germany), Honami Sato (Japan Agency for Marine-Earth Science and Technology, Kanagawa, Japan), Jan Smit (Faculty of Earth and Life Sciences (FALW), Vrije Universiteit Amsterdam, Amsterdam, Netherlands), Naotaka Tomioka (Kochi Institute for Core Sample Research, Japan Agency for Marine-Earth Science and Technology, Kochi, Japan), Jaimie Urrutia-Fucugauchi (Insti-tuto de Geofísica, Universidad Nacional Autónoma De México, Mexico City, Mexico), Michael T. Whalen (Department of Geo-sciences, University of Alaska Fairbanks, Fairbanks, AK, USA), Axel Wittmann (LeRoy Eyring Center for Solid State Science, Ari-zona State University, Tempe, AZ, USA), Long Xiao (School of Earth Sciences, Planetary Science Institute, China University of Geosciences, Wuhan, China), Kosei E. Yamaguchi (Department of Chemistry, Toho University, Chiba, Japan), and third party scientists Tim J. Bralower (Department of Geosciences, Pennsylvania State University, University Park, PA, USA).
Author contributions. PAP and BC helped in interpreting the downhole data. All other coauthors participated in sampling and data collection offshore and/or onshore during IODP–ICDP Expe-dition 364. All authors contributed to the writing and editing of the manuscript.
Competing interests. The authors declare that they have no con-flict of interest.
Acknowledgements. Expedition 364 was funded by IODP with co-funding from ICDP and implemented by ECORD, with contribu-tions and logistical support from the Yucatán state government and the National Autonomous University of Mexico. Drilling Services were provided by DOSECC Exploration Services. The drillers are acknowledged for their hard work and the captain and crew of the L/B Myrtleare thanked for having made our life easier during the offshore phase of this expedition. We also wish to warmly thank the wide ECORD Science Operator (ESO) team for its precious contri-bution, especially the offshore team, including the drilling coordi-nators. Jochem Kück and an anonymous reviewer are thanked for their very constructive comments in reviewing the manuscript.
Edited by: Tomoaki Morishita
Reviewed by: Jochem Kück and one anonymous referee
References
Anderson, R. N. and Zoback, M. D.: The implications of fracture and void distribution from bore-hole televiewer imagery for the seismic velocity of the upper oceanic crust at Deep Sea Drilling Project Holes 501 and 504B (Costa Rica Rift), Init. Rep. DSDP, 69, 255–270, 1983.
Cheung, P. S.: Microresistivity and ultrasonic imagers: tool opera-tions and processing principles with reference to commonly en-countered image artefacts, in: Borehole Imaging: applications and case histories, edited by: Lovell, M. A., Williamson, G., and Harvey, P. K., Geol. Soc. Lond., Special Publications, 159, 1, 45–57, 1999.
Christeson, G. L., Gulick S. P., Morgan, J. V., Gebhardt, C., Kring, D. A., Le Ber, E., Lofi, J., Nixon, C., Poelchau, M., Rae, A. S. P., Rebolledo-Vieyra, M., Riller, U., Schmitt, D. R., Wittmann, A., Bralower, T. J., Chenot, E., Claeys, P., Cockell, C. S., Coolen, M. J. L., Ferrière, L., Green, S., Goto, K., Jones, H., Lowery, C. M., Mellett, C., Ocampo-Torres, R., Perez-Cruz, L., Pickers-gill, A. E., Rasmussen, C., Sato, H., Smit, J., Tikoo- Schantz, S. M., Tomioka, N., Urrutia-Fucugauchi, J., Whalen, M. T., Xiao, L., Yamaguchi, K. E., and Zylberman, W.: Extraordinary Rocks from the Peak Ring of the Chicxulub Impact Crater: Physi-cal Property Measurements from IODP/ICDP Expedition 364, EPSL, 495, 1–11, 2018.
Fuller, M., Hastedt, M., and Herr, B.: Coring-induced magnetiza-tion of recovered sediment, Proc. ODP, Sci. Res., 145, 455–468, 1998.
Ekstrom, M. E., Dahan, C., Chen, M.-Y., Lloyd, P., and Rossi, D. J.: Formation imaging with microelectrical scanning arrays, The Log Analyst, 28, 294–306, 1987.
Gaillot, P., Einaudi, F., Stoll, J., and Leven, M.: General-purpose in-clinometry modules in highly magnetized formations: are bore-hole wall microresistivity images properly oriented?, Proc. ODP, Sci. Res., 197, 1–22, 2004.
Gaillot, P., Brewer, T., Pezard, P., and Yeh, E.-C.: Contribution of Borehole Digital Imagery in Core-Log-Seismic Integration, Sci. Dril., 5, 50–53, https://doi.org/10.2204/iodp.sd.5.07.2007, 2007. Grieve, R. and Therriault, A.: Vredefort, Sudbury, Chicxulub: three
of a Kind?, Annu. Rev. Earth Plan. Sci., 28, 305–338, 2000. Gulick, S., Morgan, J., Mellett, C. L., and the Expedition 364
Sci-entists: Expedition 364 Preliminary Report: Chicxulub: Drilling the K-Pg Impact Crater, IODP, 2017.
Hayman, A. J., Parent, P., Cheung, P., and Verges, P.: Improved Borehole Imaging by Ultrasonics, SPE Production and facilities, 13, 5–13, 1998.
Inwood, J., Brewer, T. S., Braaksma, H., and Pezard, P.: Integration of core, logging and drilling data in modern reefal carbonates to improve core location and recovery estimates (IODP Expedition 310), J. Geol. Soc. Lond., 165, 585–596, 2008.
Jackson, M. and Van der Voo, R: Drilling-induced remanence in carbonate rocks: occurrence, stability and grain-size dependence, Geoph. J. Intern., 81, 75–87, 1985.
Kring, D. A.: The Chicxulub impact event and its environmen-tal consequences at the Cretaceous – Tertiary boundary, Palaeo-geogr. Palaeoclimatol. Palaeoecol., 255, 4–21, 2007.
Lofts, J. C. and Bourke, L. T.: The recognition of artefacts from acoustic and resistivity borehole imaging devices, in: Borehole Imaging: applications and case histories, edited by: Lovell, M. A., Williamson, G., and Harvey, P. K., Geol. Soc. Lond., Special Publications, 159, 59–76, 1999.
Lovell, M., Harvey, P. K., Brewer, T. S., Williams, T., Jackson, P. D., and Williamson, G.: Application of FMS images in the Ocean Drilling Program: an overview, in: Geological Evolu-tion of Ocean Basins: Results from the Ocean Drilling Program, edited by: Cramp, A., MacLeod, C. J., Lee, S. V., and Jones, E. J. W., Geol. Soc. Spec. Publ. London, 131, 287–303, 1998. Morgan, J. V., Gulick, S. P. S., Bralower, T., Chenot, E.,
Christe-son, G. L., Claeys, P., Cockell, C. S., Collins, G. S., Coolen, M., Ferrière, L., Gebhardt, C., Goto, K., Jones, H., Kring, D. A., Le Ber, E., Lofi, J., Long, X., Lowery, C., Mellet, C., Ocampo-Torres, R., Osinski, G. R., Perez-Cruz, L., Pick-ersgill, A., Pölchau, M., Rae, A., Rasmussen, C., Rebolledo-Vieyra, M., Riller, U., Sato, H., Schmitt, D., Smit, J., Tikoo-Schantz, S., Tomioka, N., Urrutia-Fucugauchi, J., Whalen, M. T., Wittmann, A., Yamaguchi, K., and Zylberman, W.: The forma-tion of peak rings in large impact craters, Science, 354, 878–882, https://doi.org/10.1126/science.aah6561, 2016.
Morgan, J. V., Gulick, S. P. S., Mellet, C. L., Green, S. L., and the Expedition 364 Scientists: Chicxulub: Drilling the K-Pg Im-pact Crater, Proceedings of the International Ocean Discovery Program, 364: College Station, TX (International Ocean Discov-ery Program), https://doi.org/10.14379/iodp.proc.364.103.2017, 2017.
Paillet, F. L., Barton, C., Luthi, S., Rambow, F., and Zemanek, J. R.: Borehole imaging and its application in well logging – an overview, in: Borehole Imaging, edited by: Paillet, F. L., Barton, C., Luthi, S., Rambow, F., and Zemanek, J. R., Houston, Texas, (Society of Professional Well Log Analysts), 3–23, 1990. Pezard, P. A., Lovell, M. A., and Ocean Drilling Program Leg 126
Shipboard Scientific Party: Downhole images – electrical scan-ning reveals the nature of subsurface oceanic crust, Eos, 71, 710, 1990.
Pezard, P. A., Hiscott, R. N., Lovell, M. A., Collela, A., and Malin-verno, A.: Evolution of the Izu-Bonin intraoceanic forearc basin, western Pacific, from cores and FMS images, Geol. Soc. Lond., Special Publications, 65, 43–69, 1992a.
Pezard, P. A., Lovell, M. A., and Hiscott, R. N.: Downhole electri-cal images in volcaniclastic sequences of the Izu-Bonin forearc basin, western Pacific, in: Proc. ODP, Sci. Results, 126, 603–624, 1992b.
Schulte, P., Alegret, L., Arenillas, I., Arz, J. A., Barton, P. J., Bown, P. R., Bralower, T. J., Christeson, G. L., Claeys, P., Cockell, C. S., Collins, G. S., Deutsch, A., Goldin, T. J., Goto, K., Grajales-Nishimura, J. M., Grieve, R. A. F., Gulick, S. P. S., Johnson, K. R., Kiessling, W., Koeberl, C., Kring, D. A., MacLeod, K. G., Matsui, T., Melosh, J., Montanari, A., Morgan, J. V., Neal, C. R., Nichols, D. J., Norris, R. D., Pierazzo, E., Ravizza, G., Rebolledo-Vieyra, M., Reimold, W. U., Robin, E., Salge, T., Speijer, R. P., Sweet, A. R., Urrutia-Fucugauchi, J., Vajda, V., Whalen, M. T., and Willumsen, P. S.: The Chicxulub asteroid im-pact and mass extinction at the Cretaceous–Paleogene boundary, Science, 327, 1214–1218, 2010.
Shipboard Scientific Party: Site 894, Proc. ODP, Init. Repts., 147, 45–108, https://doi.org/10.2973/odp.proc.ir.147.103.1993, 1993. Urrutia-Fucugauchi, J., Pérez-Cruz, L., Rebolledo-Vieyra, M., Tikoo, S. M., Zylberman, W., and IODP-ICDP Expedition 364 Science Party: Rock Magnetic Properties of IODP/ICDP Expe-dition 364 Site M0077 Core, Chicxulub Crater – Preliminary Re-sults, Lunar and Planetary Science XLVIII, 2017.
Zemanek, J., Caldwell, R. L., Glenn, E. E., Halcomb, S. V., Nor-ton, L. J., and Strauss, A. J. D.: The borehole televiewer: A new logging concept for fracture location and other types of borehole inspection, J. Petr. Techn., 21, 762–774, 1969.
Zemanek, J., Glenn, E. E., Norton, L. J., and Caldwell, R. L.: For-mation evaluation by inspection with the borehole televiewer, Geophysics, 35, 254–269, 1970.
Zoback, M. D. and Anderson, R. N.: Ultrasonic borehole televiewer investigation of oceanic crustal layer 2a, Costa Rica rift, Nature, 295, 375–379, 1982.