HAL Id: insu-01622053
https://hal-insu.archives-ouvertes.fr/insu-01622053
Submitted on 24 Oct 2017
HAL is a multi-disciplinary open access
archive for the deposit and dissemination of
sci-entific research documents, whether they are
pub-lished or not. The documents may come from
teaching and research institutions in France or
abroad, or from public or private research centers.
L’archive ouverte pluridisciplinaire HAL, est
destinée au dépôt et à la diffusion de documents
scientifiques de niveau recherche, publiés ou non,
émanant des établissements d’enseignement et de
recherche français ou étrangers, des laboratoires
publics ou privés.
poorly-constrained semi-arid coastal aquifer at Ras
El-Hekma, Northwestern Coast, Egypt
Mustafa Eissa, Jean-Raynald De-Dreuzy, Beth Parker
To cite this version:
Mustafa Eissa, Jean-Raynald De-Dreuzy, Beth Parker. Integrative management of saltwater
intru-sion in poorly-constrained semi-arid coastal aquifer at Ras El-Hekma, Northwestern Coast, Egypt.
Groundwater for Sustainable Development, Elsevier, 2018, 6, pp.57-70. �10.1016/j.gsd.2017.10.002�.
�insu-01622053�
Integrative management of saltwater intrusion in
poorly-constrained semi-arid coastal aquifer at Ras
El-Hekma, Northwestern Coast, Egypt
Mustafa A. Eissa, Jean-Raynald de-Dreuzy, Beth
Parker
PII:
S2352-801X(16)30070-4
DOI:
https://doi.org/10.1016/j.gsd.2017.10.002
Reference:
GSD72
To appear in:
Groundwater for Sustainable Development
Received date: 14 December 2016
Revised date:
24 September 2017
Accepted date: 9 October 2017
Cite this article as: Mustafa A. Eissa, Jean-Raynald de-Dreuzy and Beth Parker,
Integrative management of saltwater intrusion in poorly-constrained semi-arid
coastal aquifer at Ras El-Hekma, Northwestern Coast, Egypt,
Groundwater for
Sustainable Development,
https://doi.org/10.1016/j.gsd.2017.10.002
This is a PDF file of an unedited manuscript that has been accepted for
publication. As a service to our customers we are providing this early version of
the manuscript. The manuscript will undergo copyediting, typesetting, and
review of the resulting galley proof before it is published in its final citable form.
Please note that during the production process errors may be discovered which
could affect the content, and all legal disclaimers that apply to the journal pertain.
Integrative management of saltwater intrusion in poorly-constrained semi-arid coastal aquifer at Ras
El-Hekma, Northwestern Coast, Egypt
Mustafa A. Eissaa, cc*, Jean-Raynald de-Dreuzyb, Beth Parkerc
a Desert Research Center, Hydrogeochemistry Dept., Cairo, Egypt
mustafa.eissa@g360group.org*
b Géosciences Rennes, Université Rennes I, France
c
Abstract
Saltwater intrusion is a major concern in coastal aquifers, particularly in arid and semiarid regions, where recharge is limited and groundwater withdrawal is the main source of potable water. In Ras El Hekma groundwater occurs in the Pleistocene aquifer as a thin lens of freshwater where groundwater quality is very sensitive to pumping stresses. High groundwater withdrawals from the Pleistocene aquifer deteriorate the groundwater quality along the coast due to upwelling of saltwater into the thin lens freshwater. The Pleistocene aquifer is poorly-constrained; the hydrological and geochemical records are sparse. Therefore, a simple analytical approach has been used in order to address local and regional groundwater management issues, for cases of data scarcity using little known and well defined parameters. The model assumes steady state flow as an initial condition in an isotropic and homogeneous medium, with a sharp interface between the freshwater and seawater wedge. The model combines the hydrogeological and geochemical characterization, adapted to the aquifer geometry, in order to provide global salt and freshwater balances to the Ras El Hekma scale site. The model shows progressive extension of the seawater intrusion zone (x-toe) upon increasing the groundwater withdrawals from 250 m3/day to an order of magnitude of this amount. The x-toe distance has been extended from 1700 to 5000 meters from the tip of Ras El Hekma to inland. Such model could be applied to estimate the volume of the freshwater and seawater wedge along the coast as well as to predict the groundwater withdrawals under different pumping scenarios. Seawater intrusion, in the Ras El Hekma area, is caused by the unbalance between the pumping withdrawal rates and the natural recharge from precipitation. The model can be applied for similar hydrogeological systems, specifically, coastal aquifers located in semiarid to arid environments where limited aquifer data is available.
1. Introduction
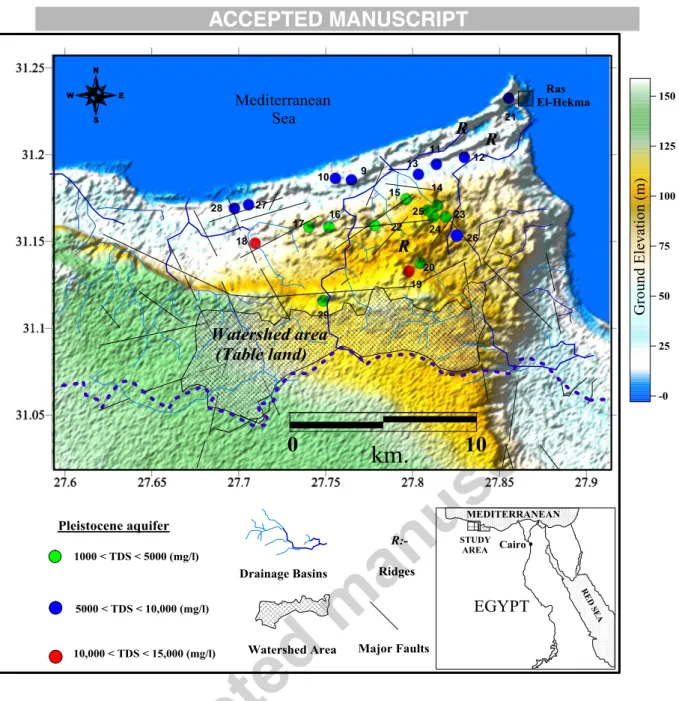
The need of freshwater in coastal areas is rapidly increasing due to population growth and human development. Seawater intrusion problem is a major concern in many countries around the world, including Oman, Mexico, and Tunisia (Bolster et al., 2007; Trabelsi et al., 2007). In Egypt, seawater intrusion has spread north, across the Nile Delta (Sherif et al., 2001), along the northwestern coast (Eissa et al., 2015a, Eissa et al., 2015b), and along the Gulf of Aqaba coast in the eastern Sinai Peninsula (Eissa et al., 2013). In the Ras El Hekma area, groundwater recharge is limited, and mainly comes from annual precipitation events (100 mm/year), meaning the layer of freshwater floating over the seawater is insufficient to sustain the daily pumping requirements. Ras El Hekma (Figure 1) forms a headland triangular cape that extends into the Mediterranean Sea, with a total area of about 140 km2. Rainfall and groundwater are the main sources of potable water and are obtained through cisterns, drilled wells, and hand dug wells. The main fresh groundwater source is the oolitic limestone aquifer (friable, moderate to hard, vigeous limestone), due to the elongated coastal ridges and local depressions that act as barriers for groundwater and serve as favorable sites for freshwater entrapment (Hammad, 1966).
The main goal of this research is to assess the effects of pumping withdrawal rates on the lateral extension of seawater intrusion, as well as to quantify aquifer vulnerability under various stress situations. In this research a simple flow model generated for Ras El Hekma, combines groundwater flow equations with the observed geochemical characteristics of the groundwater, in order to aid groundwater management in coastal aquifers and provide global salt and freshwater balances for the study site. A simple analytical model has been used to evaluate the seawater intrusion zone along the coast using different pumping scenarios.
Many analytical and numerical solutions, intended for single and layered homogeneous aquifers, were presented by Henry (1959), Bear and Dagan (1964), Hantush (1968), Mulem and Bear (1974), Collins and Gelhar (1971), Glover (1959), and Herzberg (1901). Analytical and numerical approaches are simple methods used to address both local and regional management issues in cases of data scarcity, where there are few known or well defined parameters (Beebe et al., 2011). Analytical models are considerably less computationally intensive and require less data and fewer input parameters (Werner et al., 2011; Strack, 1976). Furthermore, analytical models can be used for single or multiple wells (Cheng et al., 2000; Bear et al., 1999; Park, 2004), and may be able to account for areal recharge (Werner and Simmons, 2009) as well as for assessing pumping optimization parameters (Mantoglou, 2003; Parker et al., 2009).
Figure 1.Location map of the Ras El Hekma area, Northwestern coast, Egypt.
A simplified analytical model was adopted by Felisa et al., 2013 to assess groundwater pumping and examine the impact of seawater intrusion on the vegetation capture zone with excellent representation and computational efficiency. Lu et al., 2016 and Zhou (2011), used analytical solutions for seawater-freshwater interface characterizations, to determine the lateral seawater intrusion zone, and to estimate the volume of seawater in coastal aquifers.
The analytical model is applied in an unconfined porous oolitic limestone aquifer, found in Ras El Hekma. The model uses the theories of Strack (1976) and Mantoglou (2003), where wells that are fully penetrating the unconfined aquifer are considered. In Ras El Hekma, most of well screen sections are mostly
tapping the full saturated thickness of the oolitic limestone aquifer. The equations, represented by Montoglou (2003), provide an ideal solution to define the seawater intrusion using a potentially continuous and smooth function (the flow potential; ɸ), across the model boundary, and has been used with the Herzberg assumption (Herzberg, 1901) to define the lateral and vertical boundary between the fresh and saline water zones (Strack, 1976; Cheng and Quazar, 1999). Subsequently, the conservative volume of fresh and saline water has been estimated using an integral method demonstrated by Press et al. (1988). The conservative volumes of fresh and saline water have been used in the mass balance equation to inversely calibrate the model output. The volume of freshwater available in the study area, under the ambiguous recharge amount and the inland movement of the seawater interface, has to be quantified under different pumping scenarios.
Water chemistry data were used to investigate factors deteriorate the groundwater quality in Ras El Hekma Area. Furthermore, the authors provide the consequent equations and simple approach aimed to manage the seawater intrusion interface using a new methodology applicable to different environments and hydrogeological model systems.
2. Background
The investigated area falls within the north-western coastal region of Egypt, between longitudes 27○ 39
`
and 27○39
`
East and latitudes 31○ 03`
and 31○ 11`
North (Figure 1). It is surrounded by the Mediterranean Sea from thenorth and an elevated limestone tableland plateau from the south, where many drainage basins (wadis) are dissecting the plateau and gently slope towards the Mediterranean Sea. The study area is characterized by a semi-arid climate that is hot and dry in summer, with a mean annual precipitation of about 100 mm/year.
2.1. Geological, Geomorphological and Hydrogeological Characteristics
The surface exposure of Ras El Hekma is built up of sedimentary rocks (Figure 2a and 2b), mainly limestone of Quaternary to Tertiary period (CONOCO, 1986). The main topographic features are the tableland plateau, the pediment plain, and the coastal plain. The tableland plateau located in the south, is forming the main watershed at a maximum ground elevation of about 200 m above sea level (Hammad, 1966; Yousif and Bubenzer, 2013). The tableland plateau is dissecting by many basins draining from the south to the north direction toward the Mediterranean (Figure 1). The main water divide shown in the Figure 1, separates the drainages draining toward
Ras El Hekma area (Soth-North direction) than the other drainages draining East-West direction toward the Mediterranean and West-East direction to Fuka basin (Yousif et al., 2013; Yousif and Bubenzer 2013). The plateau is primarily composed of fractured limestone rocks from the Neogen age, which are dissected by a number of dendritic arteries draining north to the Mediterranean (Hammad, 1972). The pediment plain is located at the north between the elevated plateau and the coastal plain. The coastal plain consists of an irregular succession of alternating low hills sloping from the south to the north (FAO, 1970; Amin, 1961) with three main raised ridges running parallel to the coast involving flat depressions in between.
Figure 2.
a) Geological map of Ras El Hekma area (CONCO, 1986) b) Conceptual geological cross section from North to South in Ras El Hekma Area (Hammad, 1968).
The ridges extend in a NE-SW direction, and are composed of oolitic limestone of marine origin that has been formed along the transgression shore lines of the Mediterranean (Zeuner, 1959; Butzer, 1960; El Shazly 1964; Hammad, 1966). The foreshore ridges, formed mainly of oolitic limestone, extended 7 km further to the southwest with ground surface elevation ranging from 40 to 60 meters above sea level (Figure 1). The central ridge extends 6 km to the west and is formed mainly of oolitic limestone that slopes toward the north and has a maximum elevation of 50 meters above sea level (Hammad, 1972). The southern depression extends in between the tableland plateau and the central ridges with a maximum ground elevation of 20 meters above sea level, whereas, the northern depression, is described as ancient calcareous sand dune accumulations formed along the old littoral region, possibly during the Sicilian times (El Shazly, 1964).
In the study area, groundwater occurs in two different aquifer systems that are either porous or fractured media. The Pleistocene aquifer is formed mainly of porous friable oolitic limestone, while the Miocene aquifer possesses Marmarica fractured limestone (Gemail, 2002). These aquifers are recharged mainly from local precipitation and runoff water from the surrounding elevated areas, which act as watersheds (Hammad, 1986). The porous, unconfined Pleistocene aquifer is the main focus of this study. According to the field measurements,
the hydraulic water levels recorded in March 2013, ranged from 1.3 m (site 29) above sea level at the inland, to
0.5 m (site 12) above sea level close to the coast (Figure 2). Groundwater flows from inland toward the sea. The
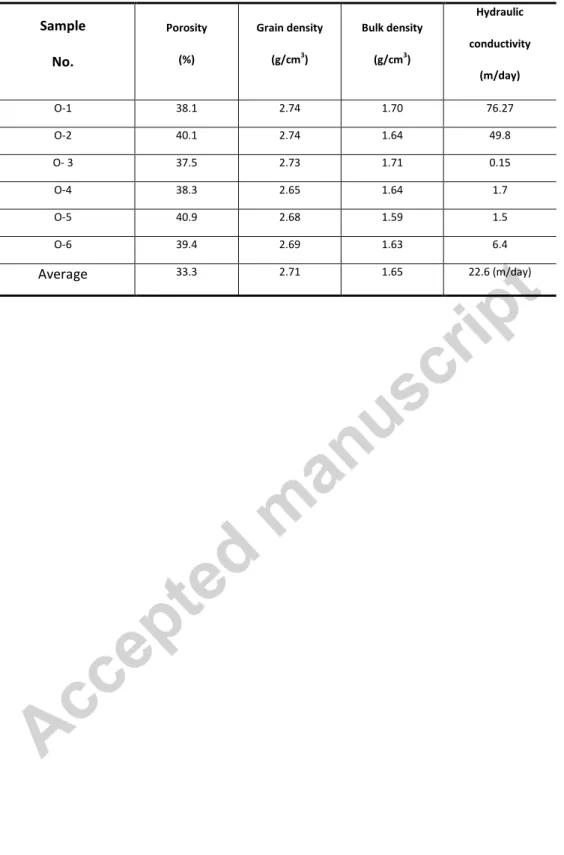
transmissivity (T) for the oolitic Pleistocene aquifer ranges from 120 to 180 m2/day (Morad et al., 2014). The petro-physical laboratory measurements for seven rock specimens (Table 1) show a wide range of hydraulic conductivities, ranging from 0.15 to 76.5 m/day. The oolitic limestone aquifer forms the main water bearing formation, with a thickness ranging between 20 to 56 m (Gemail, 2002; Hammad, 1986).
Rain and runoff water flow toward successive local depressions between the limestone ridges forming a type of ephemeral lake. The groundwater in the Ras El Hekma area occurs as a freshwater lens floating over deep saline groundwater and sloping gently in the north direction toward the Mediterranean (Soliman, 2005; Hammad; 1966).
3. Methods:
3.1. Laboratory and Field Work:
Groundwater samples were collected in March 2013. Representative groundwater samples were collected from different well sites along the Pleistocene aquifer. The groundwater salinity, temperature, and pH were measured in-situ, and chemical analyses for the major ions (Ca2+, Mg2+, Na+, K+, Cl-, SO42-) were carried out at the
Egyptian Desert Research Center, Water Central Laboratory, using the chromatography (IC – Dionex DX-120) (Table 1). Electrical conductivity (EC) was measured with a AD 410 Adwa model conductivity meter. The pH
was measured with a AD 11Adwa model pH meter. Carbonate and bicarbonate (HCO3
-, CO3
2-), were determined by titration using sulfuric acid (Rainwater and Thatcher, 1960, Fishman and Friedman, 1985). For quality assurance the analytical precision for major ions measurements, obtained from ionic balance error (IBE), was computed in terms of milli-equivalent per liter. The IBE percent is computed by Σ(cations – anions)/Σ(cations + anions), where; the observed IBE value for each sample was within a limit of ±5 % (Domenico and Schwartz 1990). A set of standard solutions was measured for every 10 samples and if the standard was not verified, then the standards were measured again until verification was met and the samples were re-analyzed. The permeability for six rock samples, collected from the oolitic limestone aquifer outcrops at the elevated ridges, were determined using the falling head permeability method (Head, 1982; Table 1) at the petro-physical laboratory in the Egyptian Petroleum Research Institute (EPRI).
Ground surface elevations were surveyed for six wells located in the main watershed of Ras El Hekma area (sites 12, 14, 23,25, 26 and 29), using a LEICA TCRA1103 PLUS ROBOTIC 3 global positioning system (GPS)
with a laser reflector total station. These ground-surface elevations were used with depth to water measurements to draw water level contours, to determine groundwater flow direction in the Ras El Hekma area and to calibrate the flow model.
3.2. Theoretical Framework and Governing Equations
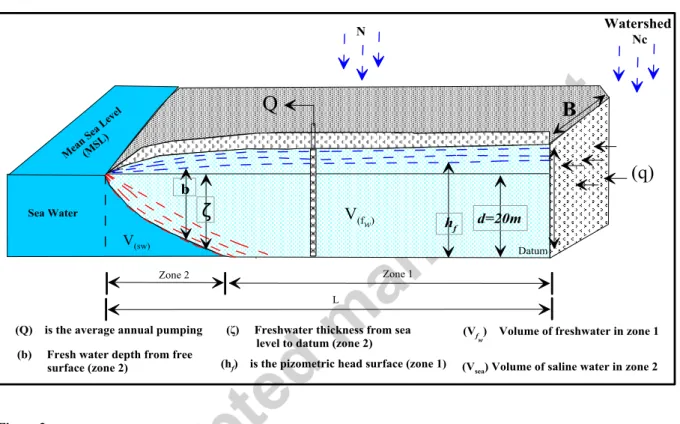
As shown in (Figure 3), the analytical solution of Strack (1976) for solving two dimensional interfaces was used to predict the extent of seawater intrusion in the coastal unconfined aquifer. Groundwater flows towards the sea, assuming steady state flow and neglecting the vertical flow rate under the Dupuit-Forchheimer assumption (Dupuit, 1863, Forchheimer, 1901, Naji et al., 1998; Mantoglous, 2003; Wenner at al., 2012; Lu et al., 2012; Felisa et al., 2013). This article assumes the hydraulic conductivity (k) is independent of the x, y and z components, which is the case for flow through a single aquifer in an isotropic and homogeneous medium. There were no accurate records available regarding the total number and the regional distribution of groundwater wells as well as the exact daily groundwater withdrawals in Ras El Hekma area. Therefore, a uniform global
distributions of pumping rates (Q) applied over the entire aquifer region has been assumed. hf is the pizometric
head surface of freshwater, whereas hf1, hf2, ….. and hfn representing the successive declining freshwater
surface in zone 2 is denoted by “b”. The freshwater depth from the sea level to the interface is represented by ζ. The Vfw and Vsw are the volume of freshwater and seawater, respectively.
Groundwater flow in porous media is described and well defined by Darcy’s law, where water velocity is a function of hydraulic conductivity and the hydraulic head gradient. Combining Darcy’s law, the partial differential equation, and the continuity equation, results in the following equation:
( ) ( ) ( ) + Nc + N – Q = 0 (Equation 1)
Figure 3.Model Parameters and aquifer dimensional.
where, k is the hydraulic conductivity, hf is the freshwater depth above datum, ξ is the freshwater thickness from
sea level to the datum in zone 2, d is the thickness from sea level to the datum in zone 1, N is the infiltration recharge from annual precipitation and Nc is the incoming subsurface recharge from the from the southern portion of the study area, Q is the pumping flow rate, and b is the total freshwater thickness (Figure 3). In coastal aquifers, changing hydraulic heads in z direction could be considered negligible (Strack, 1976), so;
( ) ( ) + Nc + N – Q = 0 Zone 1 (Equation 2) ( ) ( ) Zone 2 (Equation 3)
3.2.1 The Potential Flow (ɸ) Equation
In the homogenous and isotropic aquifers of constant thickness, the potential flow ɸ (x, y) is continuous and a smooth function across the boundary between zone 1 and zone 2 indicated in Figure 3 (Strack, 1976; Mantoglous, 2003). ( ) ( ) (Equation 4) Zone # 1 = [hf 2 - (1+δ) d] hf = √ ( ) δ ( ( ) ) d2 (Equation 5)
In cases the density of seawater equals 1.025 m3/kg and the density of freshwater equals 1.000 m3/kg
≈ 0.025. ζ = d b = hf z = 0 Zone # 2 ( ) [(hf -d)2] hf = √ ( ) ( ( ) ) (Equation 6) b = hf – d + ζ z = d – ζ ζ = √ ( )
3.2.2 Vertical Seawater Intrusion Assessment
The model assumes a sharp interface between the freshwater and seawater wedge. The sharp interface approach, based on the Ghyben-Herzberg approximation (Herzberg, 1901), is more suitable for modeling responses of freshwater zones in aquifers where saltwater can move in and out simply (Essaid, 1999).
3.2.3 Delineation of Lateral Seawater-Freshwater Interface
The lateral seawater intrusion from the coast is a function of aquifer thickness and the freshwater-seawater
relative densities ( ). At the boundary separating zone 1 from zone 2, where, hf = (1+ )d, ζ = d (Mantoglous,
2003).
( ) ( ( ))d2 (Equation 7)
The seawater interface could be determined analytically using aforementioned equations, allowing the volume of freshwater (V(fw)) to be defined by the double integral method defined by Press et al., 1988. The
freshwater lens floating over the deep saline layer extends in zone # 1 and zone #2. In zone # 1 the thicknesses of freshwater equal hf while in zone # 2 the thickness of freshwater equal b (Figure 3). Surfer program (2015) of Golden Software Inc. was used in order to estimate the upper and lower surfaces of fresh and saline water, and consequently estimate the integrated volume of freshwater lens V(fw).
V(fw) = ∬ ( )
(Equation 8)
In Surfer, volume grids can be computed by integration over x (the columns) and over y (the rows) to get the final volume of freshwater lens using the known values of hf and b for each grid. Where, xmin, ymin and ymin, ymax
refer to the model boundary corner coordinates.
3.2.5 Conservative Mass Balance Equation
In order to estimate how solutes enter the aquifer through seawater intrusion, at different groundwater withdrawal rates, the exaggerated volume of saline and freshwater should be determined first according to the previous section. Hereafter, the conservative mass balance for a specific ion(s) could be determined through determining the volume of the intruded saline water wedge into the aquifer and the volume of the freshwater lens floating over the deep saline water in 3D, as follows:
Cs (Model) =
( ) ( ) ( ) ( )
( ) ( ) (Ergil, 2001) (Equation 9)
Where, V(fw) is the conservative volume of freshwater (m3), C(fw) is the concentration of specific ion(s) in
freshwater (mg/l), V(sw) is the volume of seawater (mg/l) and C(sw) is the concentration of specific ion(s) in the
seawater (mg/l). The Cs (Field) could be determined from the global average concentration of specific ion(s) in
groundwater collected at specific times.
3.2.6 Consequent Equations and Running Model
First, equations 1,2 and 3 have been used to run the model using the available head and hydrogeological parameters data in a steady state condition. These equations can be solved using a numerical MODFLOW or the iteration option available in the Excel spread sheet solvers (Olsthoorn, 1985; Ousey, 1986; Mahmud, 1996;
Olsthoorn, 1998; Karahan and Ayvaz, 2005), assuming homogenous and isotropic porous media in an unconfined aquifer. Equation 4 has been used to estimate the equivalent potential flow ( ) the equivalent hydraulic head in steady state condition and well know values of k, N and Q. Then, equations 5, 6 and 7 were used to determine the interface which separating Zone 1 and Zone 2. Consequently, the spatial distribution values of b, z and ζ could be well determined and the volumes of freshwater lens using equation 8. The model has been calibrated in steady state using the measured and calculated groundwater levels. Additionally, equations 9 was used to estimate the modeled (Cs) concentrations of major ions to be correlated with the filed
groundwater chemistry and used for model calibration. To investigate the vulnerability of seawater intrusion along the coast, diverse groundwater pumping scenarios have been simulated, using different values of pumping withdrawals (Q).
4. Results and discussion
4.1. Groundwater chemistry
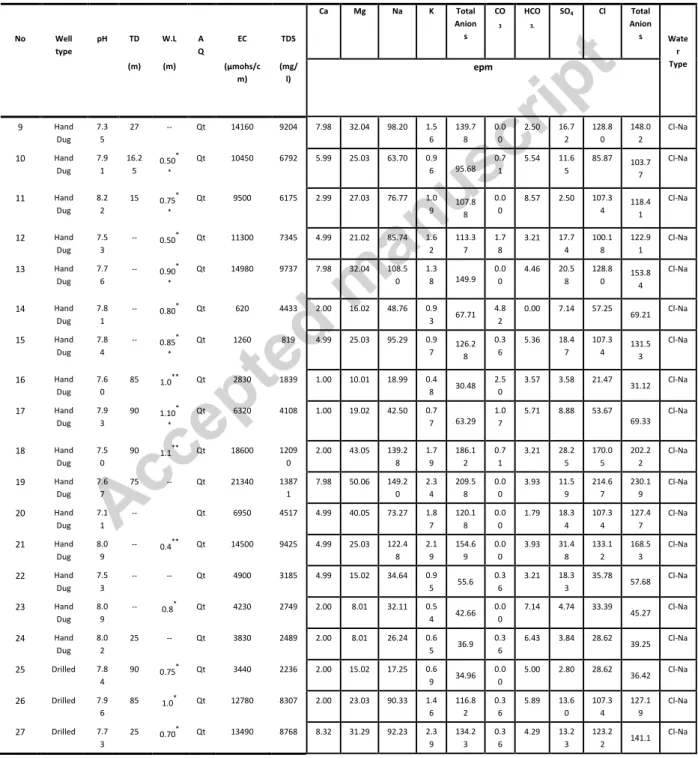
The chemical characteristics of the groundwater are listed in Table 2. The groundwater in the oolitic Pleistocene aquifer in the Ras El Hekma area had an electrical conductivity ranging from 2830 μS/cm (site 16) to 21340 μ S/cm (site 19). The groundwater with the highest salinity is located close to the coast. On the other hand, groundwater of low salinity occurs at the boundary between the Miocene and Pleistocene aquifers and close to the watersheds table land plateau, which act as the main sources of subsurface groundwater recharge in the area (Figure 2). The groundwater salinity depends mainly on; the distance from the shoreline, the topography, structure, and the groundwater flow direction from the recharge area towards the sea. It is clear, that low groundwater salinities are indicated in groundwater sites located in between the table land plateau and the southern elevated ridges. Such ridges act as natural barriers for groundwater and surface water entrapments,
which enhancing subsurface groundwater recharge. Additionally, well sites 14-17, 20, 22-26 are intersected by major
faults, oriented west-east and northeast-southwest, which facilitate the hydraulic connection between groundwater and recharge comes from the annual precipitation. The abnormal high groundwater salinity recorded inland at well sites 18 and 19 close to the watershed are mainly attributed to the upwelling of the
underneath Miocene saline groundwater due to over pumping. The cumulative probability curves for the normal distribution major ions in Figure 4a, reveal that, chloride shows a direct relationship with sodium, magnesium and sulfate, and high major ions concentrations distinguish coastal groundwater. Additionally, processes controlling water chemistry were assessed using the Gibbs diagram (Gibbs, 1970), where, groundwater was
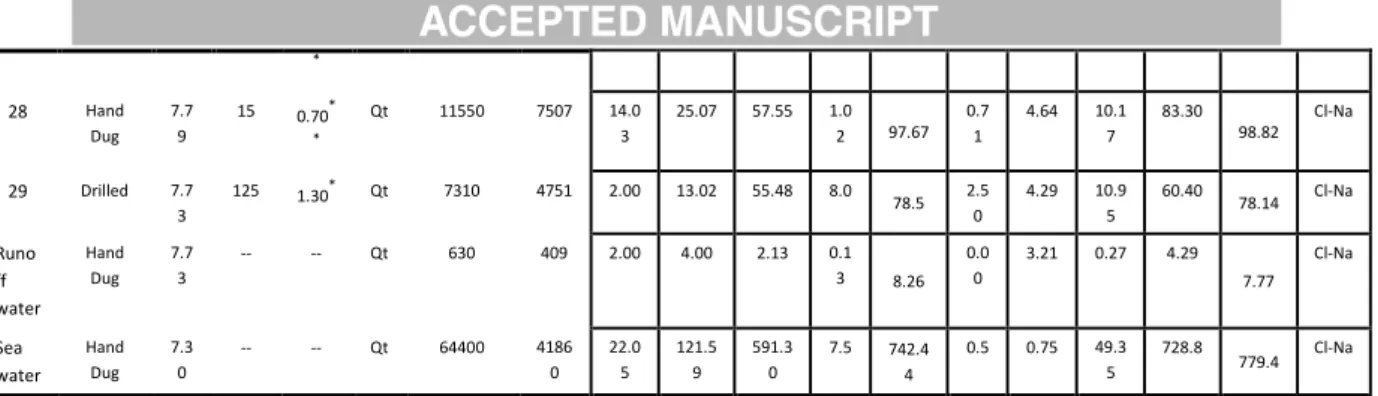
plotted in between the two end members; rain water, represents the main recharge source for groundwater and seawater represents the source for groundwater salinization (Figure 4b). Inference that can be made from this plot includes that groundwater has been affected largely by seawater mixing and partially by the water-rock interaction. Groundwater samples that fall close to the rain water samples are located at the upstream of different wadis dissecting the tableland plateau. All of the groundwater samples in the study area fall under the subdivision of alkaline metals that exceed the alkaline earths, and strong anions that exceeds weak acid anions (Chadha, 1999). All groundwater samples have a Cl-Na water type, due to mixing with seawater, and/or leaching of the limestone rock matrix of marine origin.
4.2. Groundwater Flow Model
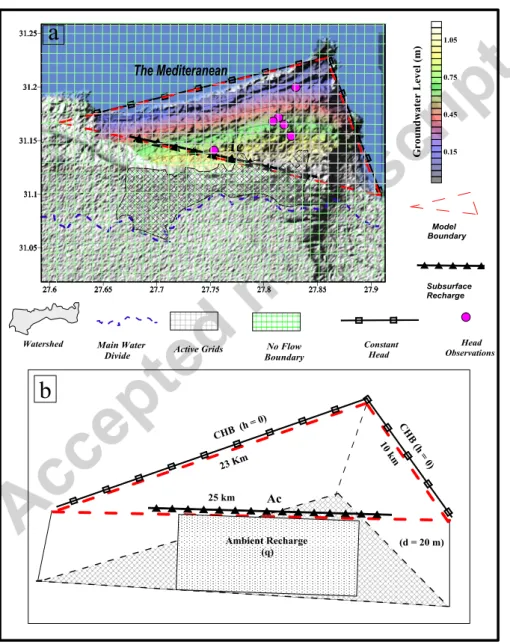
The Ras El Hekma headland has the exact shape of a triangular-based prism, where the right-angle apex located north towards the sea and a wide base located south towards the inland. The analytical solutions, and the previously mentioned equations, were applied to the aquifer whose geometry resembles the oolitic friable limestone aquifer at the Ras El Hekma area. The prism has the same geometric dimensional sides as the study area (10 km, 22.5 km, and 25 km) and the depth of the prism (20 m) has the same scale of average aquifer bed thickness (Figure 5a, b). In arid and semi-arid regions the groundwater recharge is uncertain and considered one of the most difficult fluxes to define (Wheater et al., 2010). The water budget analyses for the Northwestern coastal zone in Egypt showed the average groundwater recharge reaches about 15.5% of the total annual precipitation (Sewidan, 1980). However, the estimated mean annual groundwater recharge in the Northwestern coastal, based on long-term records of meteorological data (1934-1993) showed the recharge value for the Pleistocene aquifer is 9.5% from the total annual precipitation (Gad, 2009). Here in this research an arbitrary value of 10% has been used to simulate the recharge amount from annual the precipration. The main recharge sources for the Pleistocene aquifer in Ras El Hekma comes from the southern watershed mountains regions located outside the model boundary and the in-situ annual precipitation. The watershed table land plateau located at the highest elevation of the aquifer, receives an annual rainfall amount of 100 mm/year (Nc) (Morad et al.,
2014) distributed over the watershed area (A) of about 45 km2. Thus, the total annual recharge volume is Vc =
(Nc x A) = 45 x 106 m3/year, assuming ten percent of the total annual precipitation reaches the groundwater table. Therefore, the lateral recharge per width (B = 20 km) of the southern recharge boundary received by the
Figure 4.
a) Cumulative probability distribution curves of different major ions in groundwater using seawater and rain water as two end members . b) Mechanism controlling groundwater salinity after (Gibbs 1970).
aquifer is represented by q = Vc/B = 0.6164 m2/day. This recharge is mainly distributed over the southern base of the prism across line Ac, based on the groundwater flow level map. The additional surface recharge is also assumed to be 10 % of the total annual in-situ precipitation (N = 100 mm/year) uniformly distributed over the surficial aquifer layer. The aquifer is assumed to be homogenous, with a hydraulic conductivity (k) of 22.6 m/day, according to the mean average laboratory petro-physical measurements for six rock samples representing
the aquifer matrix (Table 1 and 3). Total pumping was initially assumed to be 250 m3/day according to collected
average daily pumping data during the field trip conducted in March 2013. Pumping rates were distributed over the entire region of the aquifer, with different pumping scenarios exceeding 12 times of the initial pumping rate.
Figure 5.a) Boundary and initial conditions for the flow model of Ras El Hekma Area b) Model Parameters, boundaries and aquifer dimensional.
4.2.1. Boundary Conditions
The model was set up to simulate the seawater intrusion in coastal aquifers for both groundwater flow and solute transport processes simultaneously, requiring boundary conditions for these two processes. The base of the model was assumed to be a no-flow boundary, represented by the consolidated marly limestone bedrock at the base of the aquifers (Soliman, 2005). For the flow model, a constant head boundary was set to sea level at the coast (groundwater head = zero), representing the mean seawater level at the shoreline of the Mediterranean Sea. The oolitic aquifer is primarily recharged by in-situ precipitation and from subsurface inflow originating from the watershed table land plateau along the southern boundary of the groundwater flow model area (Hammad, 1972). The southern boundary was simulated using the previously estimated amount of the ambient subsurface recharge comes from the table land plateau.
4.2.2. Initial Conditions and Pumping Simulation
The model parameters, including aquifer hydraulic characteristics (Table 1), pumping data, boundary conditions, sources and sinks, were used as model inputs. Field measurements of the groundwater hydraulic head, from March 2013, were used to generate the initial groundwater flow in steady state conditions. The steady state flow model was used as initial conditions for transient simulations using different amount of pumping stresses. Models were generated using fuzzy and global distributions of total pumping and recharge rates in the entire region. At the southern boundary, subsurface lateral groundwater recharge can be calculated using known values of k, N and Q to solve for ɸ (Equation 4). The flow potential (ɸ) values were interpolated over the entire modeled region, and the equivalent hf values were found for each model scenario. The induced model pumping
data, ranging from 250 m3/day to twelve times this amount, was used as inputs to estimate the lateral distance of
seawater intrusion inside the aquifer (x(toe) in meter) under different pumping rates. Infiltration recharge was
assumed to be ten percent of the total annual recharge coming from the precipitation allocated to the study area.
4.2.3. Model Calibration
The model has been calibrated until the measured head observations from the field had a general agreement with the head flow in steady state. The calibrated steady state model was used as the initial condition, followed by
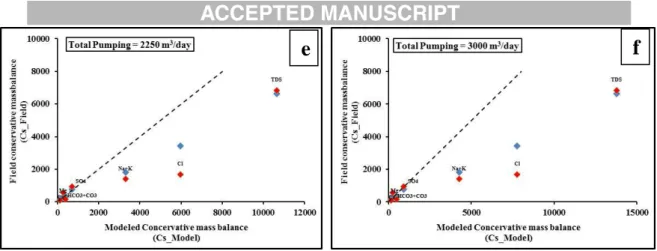
different model simulation scenarios using pumping rates ranged from 250 to 3000 m3/day. In order to enhance the flow model simulations, the groundwater salinity besides the historical water level records were previously used for calibrating the solute transport flow model in coastal aquifers (Eissa et al., 2016 and Eragil 2001). The conservative ratios of saline to freshwater have been used in the mass balance equation (Equation 9) to inversely calibrate the model output results using water level observations and historical records of groundwater salinity and major ion concentrations (Table 4 and Figure 6a to 6f). The major ion constituents (Ca2+, Mg2+, Na+, K+, CO32-, HCO3-, SO42-, and Cl-), and the salinity of the Mediterranean and rain water samples collected during the
fieldwork in March 2013 are indicated in Table 2. The salinity and major ion concentrations in the sea water (C(sw)) and the rainwater (C(fw)), as well as the estimated volume of freshwater (V(fw)) and seawater (V(sw)) from
the model, were used in the mass balance equation to estimate the modeled values (Cs (model)) for salinity and
different major ions for each pumping scenario. The Cs (Field) could be determined from the global average
concentration of specific ion (s) in the groundwater samples collected in March 2013 and August 2011.
a
b
Figure 6. Model calibration using water level and the historical records of groundwater salinity and major ion concentrations.
4.2.4. Seawater Intrusion and Pumping Scenarios
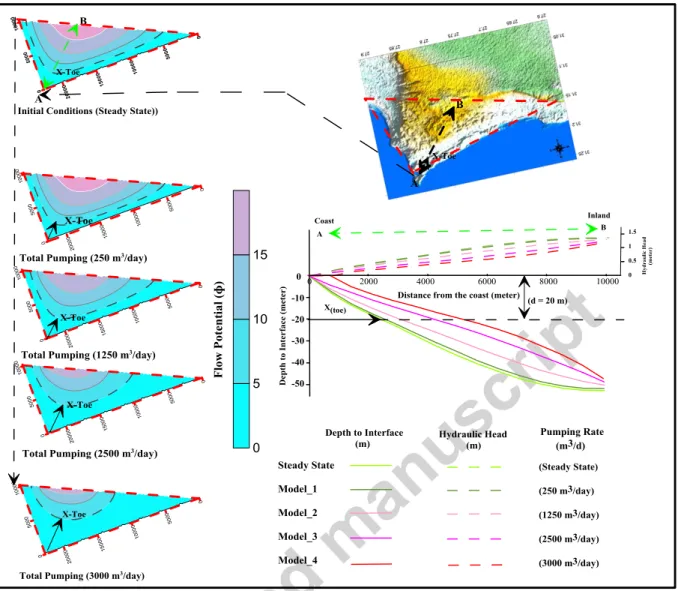
The vertical cross-section of the oolitic unconfined Pleistocene aquifer in the Ras El Hekma area possesses two distinct zones (Figure 3a and 3b). Equation 7 was used to determine the separating boundary between zone 1 and 2 and estimates the extension of x(toe) under different pumping stresses according to the interpolated ɸ(toe) value.
The ɸ(toe) value is a function of aquifer thickness and the relative density of freshwater and seawater ( ), and was
estimated to be 5.13. The contour line ɸ(toe), separates the boundary zone 1 from zone 2 and determines the
lateral distance of seawater intrusion from the coast (x(toe)). Figure 7, shows the progressive extension of the
lateral seawater intrusion (x(toe)) under increasing global pumping abstraction rates. The x(toe) has been estimated
to be at 2700 meters from the coastal line at total groundwater pumping rates of 250 m3/day, and this distance
increased to up to 5500 meters when pumping rate is increased to 12 times this rate (3000 m3/day). The induced
pumping model iterates until the seawater and freshwater dynamic interface reaches equilibrium and there is no further movement upon iterations. The hydraulic head falls down as a result of increasing the groundwater withdrawals and consequently allows increased seawater intrusion inland (Figure 7).
f
e
Figure 7. a) The interpolation of the flow potential (ɸ) values across the model domain in steady state condition. The contour maps show changes of spatial distribution ɸ upon increase the global groundwater pumping rates. Dashed contour line indicates the seawater-freshwater interface (ɸ (toe) = 5.13) separating zone 1 and zone 2. b) The distance from the tip of triangle to the dashed line is the x(toe) value. Dashed lines indicate the piezometric surface (hf) above sea level upon increase withdraw rates. Colored solid lines indicate the vertical boundary between freshwater and saline water.
4.2.5. Groundwater Withdrawal Management
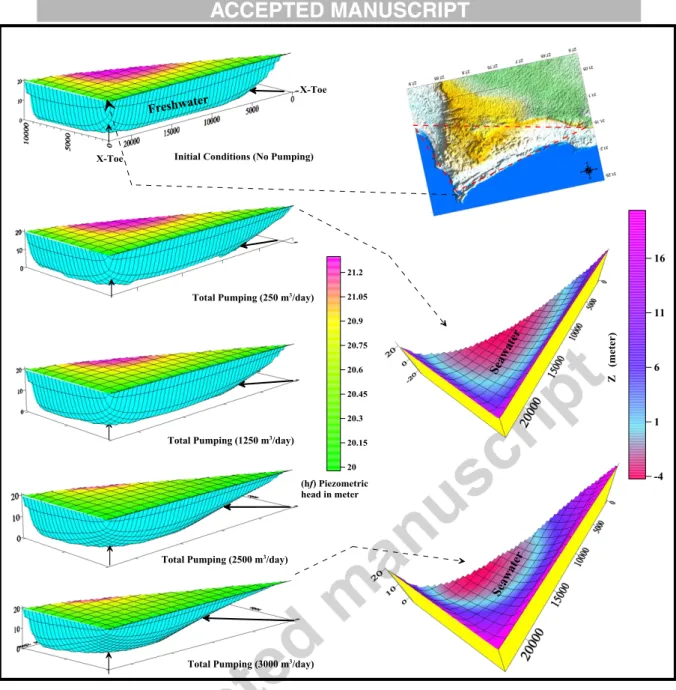
To better manage groundwater pumping, the thickness of the fresh groundwater layer floating over the deep saline layer has to be well determined over the modeled domain using different pumping scenarios. The lateral and vertical boundaries, between fresh and saline water, were precisely determined in the previous section. Equation (8) was used to estimate the outlines of the lower and upper surface for fresh and saline water, assuming a sharp interface approximation in the homogeneous porous media. The lower elevation of the freshwater lens in zone 1 is the elevation of the baseline of the oolitic aquifer, while the upper elevation equals
h(f). In zone 2 the lower elevation of freshwater is the interface boundary between freshwater and saline water,
which equals (h(f) - b) where, b = h(f) – d + ζ and the lower elevation of saline water is the baseline of the bottom
of the aquifer (Figure 3). The estimated model output for the upper and lower surface elevations were interpolated using the kriging method and converted into volume grid by means of Equation 8 with the aid of Surfer V.12 (2015; Golden Software Inc.). The estimated volume grid is multiplied by the average porosity (0.333%) of the oolitic limestone aquifer (Table 1) to evaluate the accurate volume of saturated freshwater and saltwater in zone 1 and zone 2 using different pumping scenarios. The modeled results show groundwater levels change as a result of groundwater extraction, and result in increased lateral movement of saline water inland. This indicates that the aquifer cannot sustain these large pumping rates under limited lateral groundwater recharge and scarce precipitation (Figure 8). The results of the model simulation indicate that, there will be nominal changes in the groundwater levels (Figures 7b) and the increase in the seawater intrusion will mostly be significant under increased pumping rates. It should be noted that the total volume of the groundwater in the aquifer changes, from one scenario to the another, based on the pumping withdrawal rates, assuming constant saturated thickness of the aquifer (d = 20 m).
The model results clearly show that increased groundwater salinity along the coastal strip of the Ras El Hekma area is mainly due to seawater intrusion. Observed groundwater well sites with relatively high groundwater salinities and high major ion concentrations are located in the coastal strip of zone 2. The model (Cs)
groundwater salinity and major ion values at these sites for the initial condition and pumping rate of 250 m3/day
adequately match the field observations for salinity as well as the historical records for the major ions present (Figure 6). The modeled salinity and the major ions do not well match the field observations for groundwater
pumping rates ranging between 1250 and 3000 m3/day. This indicates the actual pumping for groundwater from
the oolitic unconfined aquifer ranges between 250 m3/day and 1250 m3/day. In addition, groundwater located inland, located close to the watershed area in zone 1 (sites: 14, 16, 17, 20, 22-25 exclusive and 30), show low groundwater
salinity and a high level of agreement with the modeled results. However, a few of the groundwater well sites 18,
19 and 29 are located in zone 1, have high salinity, and show poor agreement with the calculated model salinity.
This discrepancy is mainly attributed to vertical upwelling of unknown deep saline water, possibly groundwater from the Miocene aquifer, caused by over pumping that is not accounted for in the model simulations. The calibrated model results show that seawater invades the Ras El Hekma coastal line by about 1700 to 5000 meters (x(toe)) at the northeastern side of the Ras El Hekma area, which is more vulnerable to the seawater intrusion
Figure 8. Model results showing inland regression of seawater with increasing pumping stresses (Initial condition, 250, 1250, 2500 and 3000 m3/day). The pumping and surface recharge comes from precipitation distributed uniformly over the entire region.
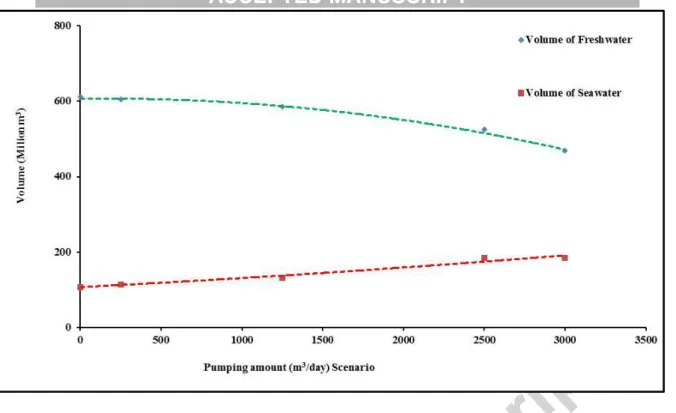
source. The total volume of fresh groundwater and seawater is estimated and indicated in Table 4, Figures 9 and 10. For groundwater management, the global groundwater salinity was estimated under different pumping scenarios using the specific ambient groundwater recharge rate. The modeled groundwater salinity increases
from 6100 ppm to 8000 ppm when pumping rates are increased from 250 to 1250 m3/day. The calculated global
groundwater salinity has violently increased from 8000 ppm to 14000 ppm upon increasing the pumping rate from 1250 to 3000 m3/day. (Figure 10).
Figure 9. Model of estimated freshwater (V(fw)) and seawater (V(sw)) volumes in the o-olitic unconfined aquifer under different
pumping scenarios.
Figure 10. Global aquifer salinity estimates under different daily pumping stresses (Initial condition, 250, 1250, 2500 and 3000 m3/day).
The groundwater in the oolitic aquifer in Ras El Hekma area has a clear Cl-Na water type indicating the final stages of groundwater evolution and possible seawater mixing. The hydraulic head distribution measured in the field and the geochemical constituents of the groundwater samples were used to determine the main recharge source of the study area, and to determine the coastal zone that is most severely impacted by seawater intrusion. Geochemical data was used to evaluate the relative degree of seawater mixing based on the concentration of four major ionic constituents (Na+, Mg+2, Cl- and SO4-2) in groundwater. It was found that there were three
groundwater types present; the low saline zone, the relatively saline groundwater that is greatly affected by seawater lateral intrusion, and the high groundwater salinity zone caused by upwelling of unknown deep saline water and/or direct dissolutions of evaporite salts.
The coastal aquifer in Ras El Hekma represents a typical example of a seawater intrusion problem in an arid environment. In this paper, this problem is investigated using an analytical model using steady state flow as initial conditions. The model assumed a global distribution of pumping rate, where the groundwater recharge came from the annual precipitation, and it was run under different pumping scenarios. The formulas presented by Strack (1976) and Mantoglou (2003) were used and all equations were solved analytically to determine the flow potential (ɸ), as a continuous and smooth function across the model boundary in zones 1 and 2. The model shows increased lateral seawater intrusion (x(toe)) under increasing pumping abstraction rates. The measured
x(toe) distance from the tip of triangle was estimated by 1700 meters at a pumping rate of 250 m3/day, and up to
5500 meters at a rate of 3000 m3/day. The modeled (Cs) groundwater salinity and major ion concentrations at
these sites adequately matched the field observations under initial conditions and a pumping rate of 250 m3/day
(Figure 9). However, the modeled salinity and major ions showed poor agreement with field observations for
groundwater pumping rates ranging between 1250 and 3000 m3/day. This indicates the actual pumping for
groundwater from the oolitic unconfined aquifer ranges between 250 m3/day and 1250 m3/day. The total volume
of the groundwater in the aquifer changes from one scenario to the other, based on the pumping withdrawal rates when a constant saturated thickness of the aquifer (d = 20 m) is assumed.
The computational model was adopted to evaluate the changes in the volume of fresh and saline water under different pumping rates. The freshwater and saline water volume ratios, as well as groundwater ionic constituents, have been used in the conservative mass balance equation to better estimate the extent of the salinization zone caused by seawater intrusion along the coastal line.
The model was used to determine: 1) the volume of fresh and saline water under different pumping rates; 2) the lateral (x(toe)). and vertical boundary between the fresh and saline water zones; 3) The average
global groundwater salinity of the aquifer under different annual pumping rates; and 4) whether the model can be extended to estimate the ambient and subsurface recharge coming from the mountainous recharge area. The latter was explored specifically for systems possessing well defined aquifer parameters, including records of historical salinity data, and under a variety of pumping regimes. The simplified computational methodology allowed for both excellent representation of natural hydrogeological systems, and increased the computational efficiency for groundwater modeling. Moreover, the current approach can assist in deciding appropriate management strategies and for strategy optimization in order to avoid coastal aquifer salinization.
6. Acknowledgements
This study was supported by the Campus France of the French Institute in Cairo, Egypt. The Authors gratefully acknowledge the Science & Technology Development Fund (STDF) in Egypt for supportive funding. Authors would like to thanks the Editors of the journal as well as the reviewers who have generously given up valuable time to review the manuscript.
7. References
Amin, M.S., 1961. Subsurface features and oil prospects of western Desert, Egypt, 3rd Arab Petrol. Conf., Alexandria, 8p.
Bear, J., Dagan G., 1964. Some exact solution of interface problem by means of hydographic method, J. geophysics. Res.64, 1563-1572.
Bear, J.A., Cheng, H.D., Sorek, S. Quuzar, D., Herrera, I., 1999. Saltwater intrusion into coastal aquifers: concepts, methods, and practices. Kluwer Academic Publishers, Dordrecht, the Netherlands.
Beebe, C., Ferguson, G., Kennedy, G., 2011. Analytical modeling of saltwater intrusion: tests from Nova Scotia and the eastern United States, geohydro, Nova Scotia, Canada, 1–7.
Bolster, D.T., Tartakovsky, D.M., Dentz M., 2007. Analytical models of contaminant transport in coastal aquifers, Adv. Water Resources 30 (9), 1962–1972.
Chadha, D.K., 1999. A proposed new diagram for geochemical classification of natural waters and interpretation of chemical data. Hydrogeol Journal 7, 431–439.
Cheng, A., Ouazar, D. 1999. Analytical Solutions. Conceptual and mathematical modeling, in Seawater intrusion in coastal aquifers: concepts, methods and practices, edited by J. Bear et al., pp.163-191.
Cheng, A., Halhal, D., Naji, A., Ouazar D., 2000. Pumping optimization in saltwater-intruded coastal aquifer. Water Resources Research 36 (8), 2155-2165.
Collins, M.A., Gelhar, L.W. 1971. Seawater intrusion in layered aquifers, Water Resources Research 7 (4), 971-979.
CONOCO 1986. Geological map of Egypt, scale 1:500,000 GPC, sheets No. NH35NE (Alexandria).
Domenico, P. A., & Schwartz, F. W. (1990). Physical and chemical hydrogeology (p. 824). New York: Wiley.
Dupuit. J., 1863. E´tude the´orique et pratique sur le mouvement des eaux dans les canaux de´couverts et a` travers les terrains perme´ables. 2nd ed. Paris, France: Dunod.
Eissa, M.A. Thomas, J.M., Pohll, G., Hershey, R.L., Dahab, K.A., Dawoud, M. I., El Shiekh, A., Gomaa, M.A., 2013. Groundwater resource sustainability in the Wadi Watir delta, Gulf of Aqaba, Sinai, Egypt. Journal of Hydrology 21 (8), 1833–1851.
Eissa, M.A., Parker, B., Shouakar-Stash, O., Hosni, M.H., EL Shiekh, A., 2015a. Electrical resistivity tomography, geochemistry and isotope tracers for salt water intrusion characterization along the Northwestern coast, Egypt. Geological Society of America Abstracts with Programs 47 (7), 486. Eissa, M.A., Shouakar-Stash O., Parker B., De Dreuzy J., 2015b. Managing saltwater intrusion in a
poorly-constrained arid aquifer, utilizing isotope and geochemistry, Northwestern coast, Egypt. Geological Society of America Abstracts with Programs. 47 (7), 324.
Ergil, M., 2001. Estimation of Saltwater Intrusion through a Salt Balance Equation and its Economic Impact with Suggested Rehabilitation Scenarios: A Case Study. First International Conference on Saltwater Intrusion and Coastal Aquifers Monitoring, Modeling, and Management, Essaouira, Morocco, April 23-25, 2001.
FAO., 1970. Pre–investment Survey of the North-western Coastal Region; Comprehensive account of the project. Technical report 49. ESE, SF / United Arab Republic.
Felisa, G., Ciriello G., Di Federico, G., 2013. Saltwater Intrusion in Coastal Aquifers: A Primary Case Study along the Adriatic Coast Investigated within a Probabilistic Framework. Water 5, 1830-1847.
Fishman, M.J., Friedman, L.C., 1985. Methods for determination of inorganic substances in water and fluvial sediments, U.S. Geological Survei Book 5,Chapter A1.Open File Report 84:85-495 Denver Colorado U.S.A. for hydrogen isotope analysis. Analytical Chemistry 63, 910–912.
Forchheimer, P., 1901. Wasserbewegung durch Boden. Zeitschrift des Vereines Deutsher Ingenieure 45, 1782– 1788.
Gad, M. M., 2009. A numerical approach for estimating the monthly groundwater recharge from rainfall, Wadi El Khour basin, northwestern coastal zone, Egypt. Egyptian Journal of Aquatic Research, 35(3),265-280.
Gemail, K. H., 2002. Geophysical studies on the eastern side of Matrouh area, northwestern strip of Egypt: Ph.D. dissertation, Zagazig University.
Gibbs, R.J., 1970. Mechanisms controlling world water chemistry. Science 170, 795–840.
Glover, R.E., 1959. The pattern of freshwater flow in a coastal aquifer. Journal of Geophysical Research 64, 457-459.
Hammad, F.A., 1966. The geology of water supplies in Ras El Hekma area. M.Sc. Thesis, Fac. Sci., Cairo University
Hammad, F.A., 1972. The geology of soils and water resources in the area between Ras El Hekma and Ras El Rum (Western Mediterranean Littoral Zone, Egypt). Ph.D. Dissertation, Fac. Sci., Cairo University. Hammad, F.A., Taha, A.A., Shata, A.A., 1986. The study of landforms in the area between Ras El Hekma and
Ras Alm El-Rum (Northwestern Mediterranean littoral zone, Egypt). Bull Fac Sci, Mansoura Univ.13 (1), 189–210.
Hantush, M.S., 1968. Unsteady movement of freshwater in thick unconfined saline 305 aquifers. Bull. Internat. Assoc. Sci. Hydrology 13, 40-60.
Head, K. H., 1982, Manual of soil laboratory testing, Vol 2, Pentech Press, ISBN 0-7273-1305-3.
Henry, H., 1959. Salt Intrusion into Fresh-Water Aquifers. Jorunal of Geophysical Research 64 (11), 1911-1919. Herzberg, B., 1901, Die WasserversQrgung einiger Nordseebader, J. Gasbeleuchtung und Wasserversorgung. 44,
815-819, 842-844.
Karahan, H., Ayvaz, T.M., 2005. Transient groundwater modeling using spreadsheets. Advances in Engineering Software 36, 374–384.
Lu, C., Chen, Y., Luo, J., 2012. Boundary condition effects on maximum groundwater withdrawal in coastal aquifers. Ground Water, 50, 386–393.
Lu, C., Xin, P., Kong, J., Li, L., Luo, J., 2016. Analytical solutions of seawater intrusion in sloping confined and
unconfined coastal aquifers. Water Resources Research 52(9), 6989-7004.
Mahmud, M., 1996. Spreadsheet solution to Laplace’s equation: Seepage and flow net. Jurnal Teknologi, bil. 25, Deisember 1996 im. 53-67.
Mantoglou, A., 2003. Pumping management of coastal aquifers using analytical models of saltwater intrusion. Water Resources Research, Water Resources Research 39 (12), 1335.
Morad, N. A.; Masoud M. H.; Abdel Moghith S. M (2014). Hydrologic factor controlling groundwater salinity in northwestern coastal zone, Egypt. Journal of Earth Syst. Sci 123 (7), 1567-1578.
Mualem, Y., Bear, J., 1974. The shape of the interface in steady flow in a stratified aquifer. Water Resources Research 10 (6), 1207-1215.
Naji, A., Cheng, A.H., Ouazar, D., 1998. Analytical stochastic solutions of saltwater/freshwater interface in coastal aquifers. Stoch. Hydrol. Hydraul. 12, 413–430.
Olsthoorn, T.N., 1985. The power of the electronic worksheet: modeling without special programs,Ground Water 23(3), 381-390.
Olsthoorn, T.N., 1998. Groundwater modelling: calibration and the use of spreadsheets, Delft University Press, 114p.
Ousey, J.R., 1986. Modeling steady-state groundwater flow using microcomputer spreadsheets, Journal Geological Education 34, 305-311.
Park,C. H., 2004. Saltwater intrusion in coastal aquifers. Thesis , The Georgia Institute of Technology.
Parker, N., Cui, L., Shi, L., 2009. Analytical design curves to maximize pumping or minimize injection in coastal aquifers. Ground Water, 47 (6), 797-805.
Press W.H., Flannery, B.P., Teukolsky, S.A., Vetterling, W.T., 1988. Numerical Recipes in C, Cambridge University Press.
Rainwater, F. H., Thatcher, L.L., 1960. Methods for collection and analysis of water samples. U.S. Geological Survey Water Supply, Paper 1454 USGS Washington DC.
Sherif, M.M., 1999. The Nile Delta Aquifer in Egypt, Chapter 17 in Seawater Intrusion in Coastal Aquifers, concepts methods and practices, edited by: Bear, J., Cheng, A., Sorek, S., Ouazar, D., and Herrera, A., Theory and Application of Transport in Porous Media, Kluwer academic publishers, the Netherlands, 14, 559–590, 1999a.
Sherif, M.M., 2001. Simulation of seawater intrusions in the Nile Delta aquifer, first international conference on saltwater intrusion and coastal aquifers monitoring, modelling and management, Essaouira, Morocco, 2001.
Soliman, M.M.M., 2005. Environmental and Geophysical Assessment of the Ground and Subsurface Water Resources of Ras El-Hekma Area, Northwestern Coast of Egypt. Ph.D., Geophysic, Faculty of Science, Ein Shams University, Cairo.
Strack, O.D.L., 1976. A single-potential solution for regional interface problems in coastal aquifers. Water Resources Research 12, 1165–1174.
Trabelsi, R., Zairi, M., Ben Dhia, H., 2007. Groundwater Salinization of the Sfax Superficial Aquifer, Tunisia. Hydrogeology Journal 15 (7), 1341-1355.
Werner, A.D., Simmons, C.T., 2009. Impact of sea-level rise on sea water intrusion in coastal aquifers. Ground Water 47 (2): 197-204.
Yousif, M., Bubenzer, O., 2013. An integrated approach for groundwater assessment at the Northwestern Coast of Egypt (Ras El Hekma area): case study. Environ Earth Sci 69 (7), 2227–2246.
Yousif, M., El Abd E. and A. Baraka 2013. Assessment of water resources in some drainage basins, northwestern coast, Egypt. Applied Water Sci (3), 439–452.
Zhou Y., Li W., 2011. A review of regional groundwater flow modeling. Geoscience Frontiers, 2 (2) 205-214. Zhou, X., 2011. A method for estimating the freshwater - saltwater interface with hydraulic heads in coastal
Table 1. Hydraulic and petro-physical characteristics for rock samples collected from the Oolitic Pleistocene aquifer Sample No. Porosity (%) Grain density (g/cm3) Bulk density (g/cm3) Hydraulic conductivity (m/day) O-1 38.1 2.74 1.70 76.27 O-2 40.1 2.74 1.64 49.8 O- 3 37.5 2.73 1.71 0.15 O-4 38.3 2.65 1.64 1.7 O-5 40.9 2.68 1.59 1.5 O-6 39.4 2.69 1.63 6.4 Average 33.3 2.71 1.65 22.6 (m/day)
Table 2. Chemical (meq/L) data for groundwater samples collected in March 2013. No Well type pH TD (m) W.L (m) A Q EC (µmohs/c m) TDS (mg/ l) Ca Mg Na K Total Anion s CO 3 HCO 3. SO4 Cl Total Anion s Wate r Type epm 9 Hand Dug 7.3 5 27 -- Qt 14160 9204 7.98 32.04 98.20 1.5 6 139.7 8 0.0 0 2.50 16.7 2 128.8 0 148.0 2 Cl-Na 10 Hand Dug 7.9 1 16.2 5 0.50* * Qt 10450 6792 5.99 25.03 63.70 0.9 6 95.68 0.7 1 5.54 11.6 5 85.87 103.7 7 Cl-Na 11 Hand Dug 8.2 2 15 0.75* * Qt 9500 6175 2.99 27.03 76.77 1.0 9 107.88 0.0 0 8.57 2.50 107.3 4 118.41 Cl-Na 12 Hand Dug 7.5 3 -- 0.50* Qt 11300 7345 4.99 21.02 85.74 1.6 2 113.3 7 1.7 8 3.21 17.7 4 100.1 8 122.9 1 Cl-Na 13 Hand Dug 7.7 6 -- 0.90* * Qt 14980 9737 7.98 32.04 108.5 0 1.3 8 149.9 0.0 0 4.46 20.5 8 128.8 0 153.84 Cl-Na 14 Hand Dug 7.8 1 -- 0.80* Qt 620 4433 2.00 16.02 48.76 0.9 3 67.71 4.8 2 0.00 7.14 57.25 69.21 Cl-Na 15 Hand Dug 7.8 4 -- 0.85* * Qt 1260 819 4.99 25.03 95.29 0.9 7 126.28 0.3 6 5.36 18.4 7 107.3 4 131.53 Cl-Na 16 Hand Dug 7.6 0 85 1.0** Qt 2830 1839 1.00 10.01 18.99 0.4 8 30.48 2.5 0 3.57 3.58 21.47 31.12 Cl-Na 17 Hand Dug 7.9 3 90 1.10* * Qt 6320 4108 1.00 19.02 42.50 0.7 7 63.29 1.0 7 5.71 8.88 53.67 69.33 Cl-Na 18 Hand Dug 7.5 0 90 1.1** Qt 18600 1209 0 2.00 43.05 139.2 8 1.7 9 186.1 2 0.7 1 3.21 28.2 5 170.0 5 202.2 2 Cl-Na 19 Hand Dug 7.6 7 75 -- Qt 21340 1387 1 7.98 50.06 149.2 0 2.3 4 209.5 8 0.0 0 3.93 11.5 9 214.6 7 230.1 9 Cl-Na 20 Hand Dug 7.1 1 -- Qt 6950 4517 4.99 40.05 73.27 1.8 7 120.1 8 0.0 0 1.79 18.3 4 107.3 4 127.4 7 Cl-Na 21 Hand Dug 8.0 9 -- 0.4** Qt 14500 9425 4.99 25.03 122.4 8 2.1 9 154.6 9 0.0 0 3.93 31.4 8 133.1 2 168.5 3 Cl-Na 22 Hand Dug 7.5 3 -- -- Qt 4900 3185 4.99 15.02 34.64 0.9 5 55.6 0.3 6 3.21 18.3 3 35.78 57.68 Cl-Na 23 Hand Dug 8.0 9 -- 0.8* Qt 4230 2749 2.00 8.01 32.11 0.5 4 42.66 0.0 0 7.14 4.74 33.39 45.27 Cl-Na 24 Hand Dug 8.0 2 25 -- Qt 3830 2489 2.00 8.01 26.24 0.6 5 36.9 0.3 6 6.43 3.84 28.62 39.25 Cl-Na 25 Drilled 7.8 4 90 0.75* Qt 3440 2236 2.00 15.02 17.25 0.6 9 34.96 0.0 0 5.00 2.80 28.62 36.42 Cl-Na 26 Drilled 7.9 6 85 1.0* Qt 12780 8307 2.00 23.03 90.33 1.4 6 116.8 2 0.3 6 5.89 13.6 0 107.3 4 127.1 9 Cl-Na 27 Drilled 7.7 3 25 0.70* Qt 13490 8768 8.32 31.29 92.23 2.3 9 134.2 3 0.3 6 4.29 13.2 3 123.2 2 141.1 Cl-Na
* 28 Hand Dug 7.7 9 15 0.70* * Qt 11550 7507 14.0 3 25.07 57.55 1.0 2 97.67 0.7 1 4.64 10.1 7 83.30 98.82 Cl-Na 29 Drilled 7.7 3 125 1.30* Qt 7310 4751 2.00 13.02 55.48 8.0 78.5 2.5 0 4.29 10.9 5 60.40 78.14 Cl-Na Runo ff water Hand Dug 7.7 3 -- -- Qt 630 409 2.00 4.00 2.13 0.1 3 8.26 0.0 0 3.21 0.27 4.29 7.77 Cl-Na Sea water Hand Dug 7.3 0 -- -- Qt 64400 4186 0 22.0 5 121.5 9 591.3 0 7.5 742.4 4 0.5 0.75 49.3 5 728.8 779.4 Cl-Na TD- Total Depth (meter); W.L-Water Level Above Sea Level (meter); * Water level measured by global positioning system (error = 10 cm); water level estimated using STRM 90.; AQ- Aquifer Type; Qt-Quaternary aquifer; EC- Electrical Conductivity; TDS- Total Dissolved Solid; epm-equivalents per million; -- No data;
Table 3. Model input data and hydraulic parameters for the Pleistocene aquifer.
Parameter Value
Average Hydraulic Conductivity 22.6 m/day Average Porosity 30 % Aquifer Thicknesses 20 meters Annual precipitation 100 mm/year
Infiltration 10 % of total precipitation Total Pumping 250 m3/day x (1, 5, 10 and 12 times)
Density (Fresh/Saline) water 1.025
Table 4. Groundwater chemistry and estimated conservative ions (Cs) for the Pleistocene groundwater in different times.
Salinity and Major Ion Constrains
Salinity and major ion Concentrations in fresh (Rain)
and seawater
Average of major ions dissolved in groundwater for different time period
(Cs Field)
Water salinity and conservative ion concentrations for different model scenario (Cs Model) Avg. Conc. in Seawater (Sw) (mg/L) Avg. Conc. in Rain Water (Fw) (mg/L) (Cs_Field_2013) (mg/L) (Cs_Field_2011) (mg/L) (Initial Condition) (mg/L) (Pump = (250 m3/day) (mg/L) (Pump = 5x250 m3/day) (mg/L) (Pump = 10x250) m3/day) (mg/L) (Pump = 12x250 m3/day) (mg/L) TDS 39748 317 6615 6846 6221 6748 7551 10638 13773 Cl 22780 6 3443 1683 3416 3720 4184 5967 7778 SO4 2670 8 767 941 407 442 496 705 916 HCO3 156 305 267 544 283 281 278 266 254 CO3 10 12 15 19 12 12 12 11 11
Na 12000 71 1756 1347 1857 2016 2260 3193 4142
K 400 6 52 42 65 70 78 109 140
Ca 400 25 143 77 81 86 94 123 153
Mg 1410 20 313 160 228 247 275 384 494