HAL Id: halshs-01242968
https://halshs.archives-ouvertes.fr/halshs-01242968
Preprint submitted on 14 Dec 2015HAL is a multi-disciplinary open access
archive for the deposit and dissemination of sci-entific research documents, whether they are pub-lished or not. The documents may come from teaching and research institutions in France or abroad, or from public or private research centers.
L’archive ouverte pluridisciplinaire HAL, est destinée au dépôt et à la diffusion de documents scientifiques de niveau recherche, publiés ou non, émanant des établissements d’enseignement et de recherche français ou étrangers, des laboratoires publics ou privés.
Eric Nazindigouba Kere, Somlanaré Romuald Kinda, Rasmané Ouedraogo
To cite this version:
Eric Nazindigouba Kere, Somlanaré Romuald Kinda, Rasmané Ouedraogo. Do Natural Disasters Hurt Tax Resource Mobilization?. 2015. �halshs-01242968�
C E N T R E D'E T U D E S E T D E R E C H E R C H E S S U R L E D E V E L O P P E M E N T I N T E R N A T I O N A L
SÉRIE ÉTUDES ET DOCUMENTS
Do Natural Disasters Hurt Tax Resource Mobilization?
Eric N. KERE
S. Romuald KINDA
Rasmané OUEDRAOGO
Études et Documents n° 35
December 2005
To cite this document:
Kere E. N., Kinda S. R., Ouedraogo R., (2015) “ Do Natural Disasters Hurt Tax Resource Mobilization ? ”,
Études et Documents, n° 35, CERDI. http://cerdi.org/production/show/id/1771/type_production_id/1
CERDI
65 BD. F. MITTERRAND
63000 CLERMONT FERRAND – FRANCE TEL.+33473177400
FAX +33473177428
The authors
Kere Eric N.
PhD in Economics, Postdoctoral research fellow
CERDI – Clermont Université, Université d’Auvergne, UMR CNRS 6587, 63009 Clermont- Ferrand, France.
Email : [email protected]
Kinda S. Romuald Assistant Professor
Université Ouaga 2,UFR-SEG 03 BP: 7210 Ouagadougou 03, Burkina Faso. Email: [email protected].
Ouedraogo Rasmané PhD Student in Economics
CERDI – Clermont Université, Université d’Auvergne, UMR CNRS 6587, 63009 Clermont- Ferrand, France.
Email: [email protected]
Corresponding author: Rasmané Ouedraogo
This work was supported by the LABEX IDGM+ (ANR-10-LABX-14-01) within the program “Investissements d’Avenir” operated by the French National Research Agency (ANR).
Études et Documents are available online at: http://www.cerdi.org/ed
Director of Publication: Vianney Dequiedt Editor: Catherine Araujo Bonjean
Publisher: Mariannick Cornec ISSN: 2114 - 7957
Disclaimer:
Études et Documents is a working papers series. Working Papers are not refereed, they constitute research in
progress. Responsibility for the contents and opinions expressed in the working papers rests solely with the authors. Comments and suggestions are welcome and should be addressed to the authors.
Abstract
According to several reports, natural disasters and climate change will intensify and dampen development if appropriate measures are not implemented. Our paper contributes to this literature and analyzes the impact of natural disasters on domestic resource mobilization in developing countries. Using propensity score matching estimators over the period of 1980-2012 for 120 developing countries, our results conclude that government revenues decrease in the aftermath of natural disasters. Moreover natural disasters that occur in border countries have a negative impact on government revenues of neighbor countries. However, the adverse effects of natural disasters are dampened in countries with high level of resilience capacity and stronger governance.
Keywords
Natural disasters ; Tax revenue ; Resilience capacity ; Corruption.
JEL Codes
1. Introduction
Over the last decade, many developing countries have made important progress in human development. According to UNDP (2013) and UNDP (2014), the number of people affected by extreme poverty decreased from 1.9 billion to 836 million between 1990 and 2015. In developing countries, the percentage of undernourished people has dropped from 23.3 per cent to 12.9. Over the period of 2000-2015, life expectancy, and education levels have risen while child mortality rates have declined. Despite such successes, progress has been unequal across countries and regions, and millions of people have been left behind, particularly in developing countries. According to the UNDP Report (2015) on Millennium Development Goals (MDG), more than 800 million people are affected by hunger and continue to live in extreme poverty. In addition, the report shows that climate change can undermine observed progress. In recent years, several developing countries have been negatively affected by frequent and intense natural disasters that have destroyed hundreds of thousands of lives1. For instance, the WHO2 report concludes that more than 9,000 people have died from Ebola in the three most affected West African countries: Guinea, Sierra Leone and Liberia. For years, several authors have explored the macroeconomic and development impact of natural disasters. Some works have explored the impact of natural disasters on economic growth (Raddatz 2009, Noy and Vu 2010, Cavallo 2011) and trade (Yang 2008, da Silva and Cernat 2012) whereas other have focused on human development and poverty (Evans et al. 2009, Hallegatte and Dumas 2009). However, the literature on the impact of natural disasters on government revenue is scarce. To our knowledge, only one study by Noy and Nualsri (2011) investigates the impact of natural disasters on revenue. Using GMM techniques for 45 countries over the period of 1990-2005, they find that natural disasters increase government revenues in developing countries, while revenues drop in developed countries after natural disasters. Moreover, the authors show that the impact of natural disasters on tax revenues depends on the macroeconomic dynamics that occur following the disaster shocks as well as on the structure of revenue sources (income taxes, consumption taxes, and custom dues). However, these results may be biased estimates. First, empirical evidences show that developed countries are less adversely affected by natural disasters and have higher levels of tax revenues than developing countries. In such case, the GMM estimators will tend to overestimate the
1
Liberia, Guinea and Sierra Leone are infected by the Ebola virus. Haiti experienced a severe earthquake in 2010 and floods in 2011 and 2014. Ethiopia was affected by famine in 2012, whereas Pakistan, Indonesia, Myanmar and India have been affected by floods in previous years.
2
See Ebola Situation Report-11 February 2015. Available at http://apps.who.int/ebola/en/ebola-situation-report/situation-reports/ebola-situation-report-11-february-2015
impact of natural disasters because the control group includes countries (mostly developed ones) that have a higher average level of domestic resources than those of the treated group (mainly developing countries). Second, one of the limitations in dynamic panel GMM techniques is that the lagged values of the endogenous variables are sometimes poor instruments for the variables in first differences. Therefore, the use of lagged values of the explanatory variables as instruments is misleading. Finally, Noy and Nualsri (2011)’s sample size is small and encompasses primarily emerging countries, and the authors do not estimate the effects of natural disasters on the different sources of tax revenues.
Our paper provides new evidence on the relationship between natural disasters and domestic resource mobilization for 120 developing countries over the period of 1980-2012. Our paper is innovative for three reasons. First, it uses the propensity score matching (PSM) method to evaluate the tax effects of natural disasters. The PSM is a useful way to account for potential selection bias where the treatment and control groups have substantial overlap. Second, we take into account the spillover effects of natural disasters. Natural disasters may not only affect domestic tax revenue but also neighboring countries, in terms of factors such as destruction of physical and human capital, displacement of people, and trade diversion. Finally, the paper attempts to address policy recommendations by analyzing the resilience and governance capacity of various countries to dampen the impact of natural disasters.
Our results are clear and compelling. First, we establish that natural disasters have negative effects on government revenues and on a broad mix of tax revenues (trade transaction tax revenue, general goods and services tax revenue, property tax revenue, and social contributions). Furthermore, we find that natural disasters that occur in border countries have negative effects in neighbor countries. Finally, our findings clearly indicate that the negative tax effects of natural hazards are dampened in countries with a high capacity of resilience and stronger governance.
The rest of the paper is organized as follows. Section 2 contains a discussion of how natural disasters can affect tax resource mobilization. Section 3 explores the data, describes the different types of natural disasters used and presents some stylized facts. In Section 4, we discuss the methodology, while Section 4 presents our main results. Extensions to conditional factors on quality of governance and resilience capacity estimations are presented in Section 5. Finally, Section 6 provides concluding remarks and policy recommendations.
2. How can natural disasters affect domestic tax mobilization?
There are several channels through which natural disasters may affect domestic resource mobilization. First, government revenues can be affected because of the negative effect of natural disasters on economic activity and growth, including falls in imports and exports leading to direct and indirect reductions in tax revenues. Second, according to the neoclassical growth model, natural disasters can deplete of capital stock. After a natural disaster, the economy can converge towards its old long run, steady-state equilibrium through faster capital accumulation. In other words, by destroying capital stock, natural disasters alter the production frontier and lower per capita output. Later, increased investment tends to replenish the capital stock and return it to its previous level. Therefore, in the short term, natural disasters reduce economic level and growth, and domestic resource mobilization, while over the long term, they may have no effects.
However, this conclusion may be an oversimplification because it doesn’t take into account other channels through which natural disasters may impact a given country’s production function and resource mobilization. Indeed, several driving forces can be highlighted. First, business and commerce in the geographical area of a natural disaster can be disrupted and shut down. This may hamper GDP growth. Second, damage of economic infrastructure can induce either a reduction in the capital stock available for economic production or in a disruption of infrastructure services, such as power outages and road closures. Public and private enterprises may experience disaster-related losses and therefore reducing government potential revenue. On the other hand reconstruction efforts through investment-oriented activities can increase economic activity levels and resource mobilization. Post-investment activities are opportunities for necessary but neglected repairs and for the upgrading of facilities. Third, the impact of natural shocks on resource mobilization may depend on the structure of the economy and on taxation. In some countries, government revenues are sensitive to natural disasters because they are dependent upon taxation of the agricultural sector or on import taxes.
3. Data and stylized facts
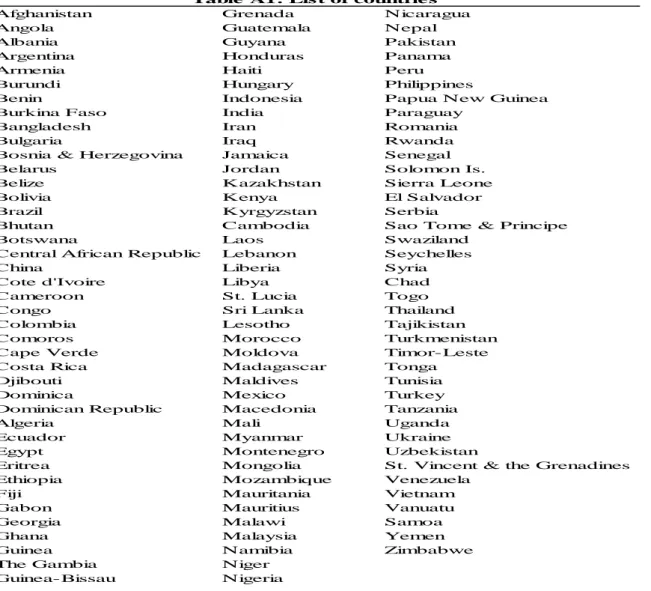
This paper uses data for 120 developing countries from 1980 to 2012. These data are from several sources (see Appendix, Table A2 for details and descriptive statistics). Data on natural disasters and
government revenues (including different components) are from the EMDAT disaster database3 (Centre for Research on the Epidemiology of Disasters (CRED), 2014) and the International Monetary Fund (IMF) datasets, respectively.
According to the CRED, a natural disaster is defined as a natural situation or event which overwhelms local capacity necessitating a request for external assistance. Specifically, at least one of the four criteria must be fulfilled: (1) 10 or more people reported killed; (2) 100 people reported affected; (3) declaration of a state of emergency; or (4) call for international assistance. In this paper, we focus on the occurrence of natural disasters in developing countries. The EMDAT disaster database includes data on hydro-meteorological disasters (floods, wave surges, storms, droughts, landslides and avalanches), geophysical disasters (earthquakes, tsunamis and volcanic eruptions) and biological disasters (epidemics and insect infestations). Data on government revenues encompass total government revenues (excluding grants), total tax revenues (excluding social contributions), trade transaction tax revenues and goods and services tax revenues.
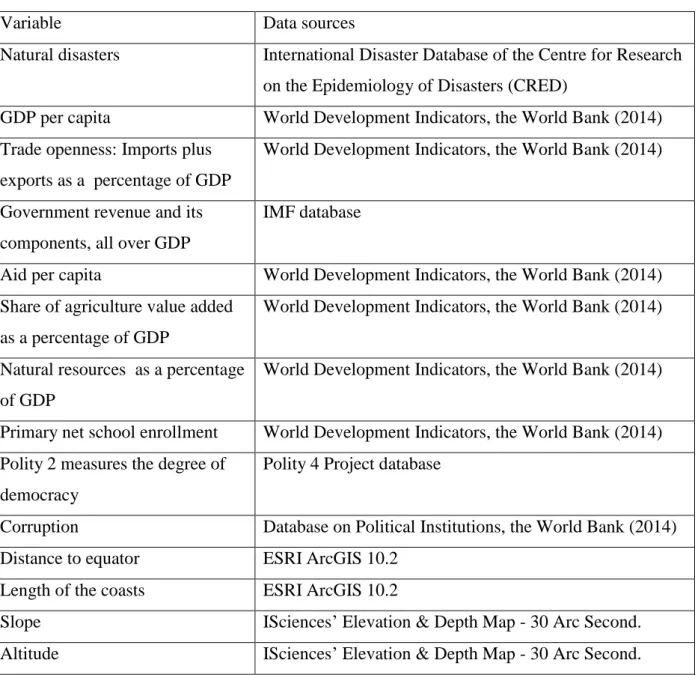
GDP per capita, trade openness (defined as the sum of exports and imports as a share of GDP), natural resources over GDP, the share of value added agriculture as a percentage of GDP, foreign aid per capita and primary net school enrolment come from the World Development Indicators (World Bank 2014). Different data on the geographic location of the different countries are used to take into account exposure to natural disasters. The ESRI ArcGIS 10.2 provides distance from the equator and the length of the coasts. The slope and altitude measurements are from the ISciences' Elevation & Depth Map - 30 Arc Second. Finally, the level of democracy (measured by “polity2”) is provided by the Polity4 Project database.
3
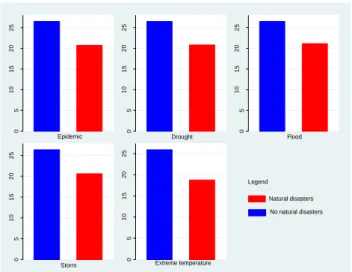
Figure 1: Relationship between government revenues and natural disasters
Source: Author’s calculations using data from CRED (2014) and International Monetary Fund
Figure 1 shows the relationship between government revenues and natural disasters. It sheds light on the fact that government revenues drop when countries face natural disasters. Countries affected by natural hazards are often faced with a fraction of their former tax revenues coming in and with deteriorated sovereign creditworthiness; as such they are often left with little recourse.
4. Methodology
Assessing the macroeconomic consequences of natural disasters remains a central issue. Previous studies have often used methods such as before-after statistical analysis (Albala-Bertrand 1993), cross-country OLS (Yamamura 2013), the general linear regression model (Hochrainer 2009), panel VAR and GMM framework (Raddatz 2007, Noy 2009, Loayza et al 2009), cumulative impulse response functions (Raddatz 2009). However, as highlighted by Cavallo et al (2011), these methods are likely to be severely biased if the countries affected and not affected do not have the same average income level. For example, if the countries affected by natural disasters have on average a lower level of domestic resources than the control group, traditional models tend to overestimate the impact of natural disasters.
Econometric investigations should therefore find ways to bypass the fundamental problem of finding an acceptable counterfactual group to estimate an unbiased effect of the natural disasters we are studying. Cavallo et al (2011) are the precursors of using matching methods to estimate the effects of natural disasters on GDP growth. In their paper, they employ the synthetic control group that allows them to construct an appropriate counterfactual, i.e., to estimate what would have happened to the
0 5 10 15 20 25 0 5 10 15 20 25 0 5 10 15 20 25 0 5 10 15 20 25 0 5 10 15 20 25 Green Green Legend Epidemic Drought Flood
Storm Extreme temperature
Natural disasters No natural disasters
path of GDP of the affected country in the absence of the natural disaster and to assess the disaster’s impact by comparing the counterfactual to the actual path observed. This method is reliable for country comparative case studies and focuses on a particular event and not recurrent events, which is what we are interested in here. In this paper, we use the propensity score matching (PSM), a method that allows us not only to construct control groups, thus reducing the selection bias. This method is also suited for recurrent events such as natural disasters.
Similarly to Cavallo et al (2011), we consider that the timing of a natural disaster is an exogenous event. Thus, experiencing natural disasters is taken as the treatment status. The propensity score is defined as the probability of experiencing natural disasters conditional on observed covariates, and is typically estimated from regression models, such as a logistic or probit regression of the treatment, conditional on the covariates (see for review Rosenbaum and Rubin 1983; Dehejia and Wahba 2002; Heckman et al. 1998). In other words, PSM involves a statistical comparison of country groups based on two steps. First, the probability of observing natural disasters in a given country at year t is estimated conditional on observable economic conditions and country characteristics.
The set of variables included are: GDP per capita, trade openness, natural resources over GDP, the share of agriculture value added as a percentage of GDP, foreign aid per capita, primary net school enrollment and Polity2. Then, we extract predicted probabilities of experiencing natural disaster in for each country. Second, these probabilities, or propensity scores, are used to match countries that have experienced natural disasters with countries that have not and thereby to construct a statistical control group. This approach ensures similarity of initial macroeconomic conditions and country characteristics in the comparison, or control group. The control group provides a proxy for the counterfactual, that is, for government revenue if a country that has experienced a natural disaster had not experienced one. The effect of the natural disaster is then calculated as the mean difference in the government revenue across these two groups. An important feature of the propensity score estimation is that the estimated propensity scores are determined independently from the outcome measure of interest. In this sense, this procedure enables us to remove systematic imbalances or differences between the treated and control cases prior to assessing any differences in any specific outcomes.
As highlighted above, natural disaster countries are called the treatment group whereas the remainder of the sample constitutes the control group. When estimating the effect of natural disasters on tax revenues, the average treatment effect of natural disasters on the treated group (ATT) would be of interest and expressed by:
𝐴𝑇𝑇 = 𝐸[∆𝑅𝑒𝑣𝑖1|𝑁𝐷𝑖 = 1] − 𝐸[∆𝑅𝑒𝑣𝑖0|𝑁𝐷𝑖 = 1] (1)
With ND a dummy variable identifying countries experiencing natural disaster in any given year, ∆𝑅𝑒𝑣𝑖0|𝑁𝐷𝑖 = 1 the change in government revenue that would have been observed if a country experiencing natural disaster had not experienced such a disaster, and ∆𝑅𝑒𝑣𝑖1|𝑁𝐷𝑖 = 1 is the change in government revenues observed in the same country. However, given the fact that the initial macroeconomic conditions of countries affected by natural disasters can be different than those of non-affected countries, it is not plausible to assume that government revenues would be the same in the absence of natural disasters. Therefore, a sizeable selection bias would be present. The propensity score matching method allows us to overcome this selection bias on observables problem. The key assumption to eliminate selection bias from equation (1) through matching methods is conditional independence, which requires that, conditional on some control variables X, the effect be independent of the natural disaster dummy, i.e. 𝐸[∆𝑅𝑒𝑣𝑖0|𝑁𝐷𝑖 = 1, 𝑋𝑖] − 𝐸[∆𝑅𝑒𝑣𝑖0|𝑁𝐷𝑖 = 0, 𝑋𝑖] would be zero. Under this assumption, equation (1) can be rewritten as:
𝐴𝑇𝑇 = 𝐸[∆𝑅𝑒𝑣𝑖1|𝑁𝐷𝑖 = 1, 𝑋𝑖] − 𝐸[∆𝑅𝑒𝑣𝑖0|𝑁𝐷𝑖 = 0, 𝑋𝑖] (2)
Rosenbaum and Rubin (1983) propose that one match the treated units and control units on their propensity scores, which can be estimated by simple probit or logit models. A further assumption needed to apply PSM is the common support assumption ((𝑝(𝑋𝑖) < 1), which requires the existence
of some comparable control units for each treated unit. When PSM is used, the ATT can now be estimated as:
𝐴𝑇𝑇 = 𝐸[∆𝑅𝑒𝑣𝑖1|𝑁𝐷𝑖 = 1, 𝑝( 𝑋𝑖)] − 𝐸[∆𝑅𝑒𝑣𝑖0|𝑁𝐷𝑖 = 0, 𝑝(𝑋𝑖)] (3)
The strategy then consists in computing the difference in government revenue for observations with similar propensity scores (the probability of experiencing a natural disaster).
Several matching methods exist: Nearest neighbor, one-one or many-one matching, Radius matching, Kernel matching and Local Linear regression. In this paper, we will estimate the first four methods. The most straightforward matching estimator is Nearest-Neighbor (NN) matching. In the NN method, the country from the comparison group is chosen as a matching partner for a treated country that is closest in terms of propensity score. Therefore, all treated countries find a match. However, it is obvious that some of these matches are fairly poor because for some treated countries the nearest neighbor may have a very different propensity score, and, nevertheless, it would contribute to the estimation of the treatment effect independently of this difference. The Radius matching and Kernel matching methods offer a solution to this problem. With Radius matching, each treated observation is
matched only with the control observations whose propensity score falls into a predefined “neighborhood of the propensity score of the treated observation. The Radius matching imposes a tolerance level on the maximum propensity score distance (caliper). If the dimension of the neighborhood (i.e., the radius) is set to be very small. it is possible that some treated units are not matched because the neighborhood does not contain control units. Therefore, the smaller the size of the neighborhood, the better the quality of the matches. In this paper, we set three radius calipers: 0.01; 0.05 and 0.10. With Kernel matching, all treated are matched with a weighted average of all controls with weights that are inversely proportional to the distance between the propensity scores of treated and controls (Smith and Todd, 2005). Local linear matching, a non-parametric matching estimator, is similar to Kernel matching and uses weighted averages of all individuals in the control group to construct the counterfactual outcome. The difference between Kernel matching and local linear matching is that the latter includes a linear term in the propensity score of a treated observation, in addition to the intercept. This is an advantage whenever comparison group observations are distributed asymmetrically around the treated observation.
5. Results
5.1. Effect of natural disasters on government revenue
Table 1 shows the effects of natural disasters on government revenue by using the propensity score matching method. We observe that natural disasters hurt government revenues and the magnitude of the effect is a function of the type of the disaster.
Epidemic. Developing countries have experienced the worst epidemics in recent years including the
worldwide 2009 flu pandemic, the 2008-2009 Zimbabwean cholera outbreak, the 2010 Haiti cholera outbreak, the 2011 Congo measles and the Ebola virus disease that is ravaging Western African countries today. Such epidemics create fear among citizens and foreign investors who leave the country, reduce the workforce, slowdown the economic activities, drop jobs and therefore the potentially affect government revenues. Our results conclude that epidemics reduce government revenues by 5.22 percent of GDP. This finding is robust to various propensity score matching methods.
Drought. As suggested by the CRED (2014), the primary cause of any drought is a deficiency of
rainfall. However, drought is not solely a physical phenomenon because its impacts can be exacerbated by human activities and water supply demands. Drought can be devastating: famines occur, water supplies dry up, crops fail to grow, animals die and malnutrition and ill health become
widespread. Africa, the Middle East, Asia and southern Europe are the regions most often affected by droughts. The most recent drought was the 2011 East Africa drought that affected the entire East African region. This drought caused a severe food crisis across Somalia, Djibouti, Ethiopia and Kenya that threatened the livelihood of millions of people. Beyond this type of humanitarian crisis, droughts cause a loss of revenue to the government due to tax exemption of basic products consumed by the population and due to the reduction of production capacity. Table 1 highlights that government revenues drop by 5.17 percent of GDP after a country experiences drought. This robust finding is highly significant at 1 percent in all columns.
Flood. Flooding is becoming an increasingly common occurrence in all developing countries,
resulting in huge economic losses and even loss of life. Proper drainage is often lacking, resulting in frequent flooding and road closures. In countries prone to flooding, such as Pakistan (July 2010, August-September 2011, September 2014), the Philippines (December 2010-January 2011, September 2014) and India (August 2008, July 2009), floods often cause extensive damage and displace thousands of families. Following flooding, one of the most urgent needs for affected families is food, drinking water and blankets to stay warm. Governments must sometimes provide basic needs to affected people (such as water, food and shelter?). They could also help them financially through tax exemption and rescheduling their tax payments, which along with the destruction of sustenance farming and the decline of tourism, results in a fall in government revenues. Results reported in Table 1 confirm our expectations: government revenues decrease by 5.02 percent of GDP in the aftermath of a flood disaster.
Storm. Storm disasters strike mainly coastal countries and have been increasing in recent years.
They are caused by an abnormal rise in sea level generated by tropical cyclones or other intense storms. The rise in sea level actually comes from the warming of the surface water of the ocean, which then expands. Countries like Bangladesh and Myanmar were struck by cyclones in November 2007 and May 2008, respectively4. Storms cause severe damage to agriculture, forestry, electricity and infrastructure networks, transport, communication and therefore a great loss of revenue to affected countries. We find that government revenues drop by 5.63 percent of GDP in the aftermath of a storm disaster (see Table 1). This result is robust and strongly significant at the 1 percent level.
4
Cyclone Sidr struck Bangladesh in November 2007, killing over 3,000 people, injuring over 50,000, damaging or destroying over 1.5 million homes, and affecting the livelihoods of over 7 million people (UN 2007). Cyclone Nargis struck Myanmar’s Irrawaddy Delta in May 2008, creating the worst natural disaster in the country’s recorded history. It killed over 80,000 people and affected the livelihoods of over 7 million (UN 2009).
Extreme temperatures. Extreme temperatures may be cold or hot. While Sub-Saharan Africa and
Latin America suffer from extreme hot temperatures, Eastern Europe is sometimes affected by heavy snowfall and extreme negative temperatures. Heat waves are most deadly in mid-latitudinal regions, where they concentrate extremes of temperature and humidity over a period of a few days in the warmer months. The oppressive air mass in an urban environment can result in many deaths, especially among the very young, the elderly and the infirm. Extremely cold spells cause hypothermia and aggravate circulatory and respiratory diseases. Apart from these consequences, extreme temperature prevents agricultural practices or destroys agricultural products and reduces working hours and therefore potential revenue. Results reported in Table 1 show that extreme temperatures cause a fall in government revenue of 6.67 percent of GDP.
Overall, we find that, in general, natural disasters hurt government revenue. This effect is strongly significant at the 1 percent level and robust to various propensity score matching methods. Furthermore, the impact of natural disasters varies greatly depending on the type of the disaster. Government revenue drops from 5.02 percent of GDP for flood disasters to 6.67 percent of GDP for extreme temperature disasters. After drawing up the effect of natural disasters on government revenues, we now turn to the different components of government revenues.
Kernel Local linear
k=1 k=2 k=3 r=0.01 r=0.05 r=0.1 regression
Epidemic ATT -5.218*** -5.218*** -5.218*** -5.218*** -5.218*** -5.218*** -5.218*** -5.218*** (0.675) (0.688) (0.643) (0.664) (0.668) (0.675) (0.651) (0.653) Critical level of hidden bias 1.4 1.6 1.8 2.1 2.1 2.3 2.1 2.1
Number of treadted Obs. 237 237 237 237 237 237 237 237
Number of control obs. 818 818 818 818 818 818 818 818
Total obs. 1055 1055 1055 1055 1055 1055 1055 1055
Drought ATT -5.217*** -5.217*** -5.217*** -5.217*** -5.217*** -5.217*** -5.217*** -5.217*** (0.646) (0.657) (0.691) (0.667) (0.692) (0.669) (0.635) (0.652) Critical level of hidden bias 1.2 1.4 1.6 2 2.1 2.3 2.1 2.1
Number of treadted Obs. 236 236 236 236 236 236 236 236
Number of control obs. 819 819 819 819 819 819 819 819
Total obs. 1055 1055 1055 1055 1055 1055 1055 1055
Flood ATT -5.022*** -5.022*** -5.022*** -5.022*** -5.022*** -5.022*** -5.022*** -5.022*** (0.698) (0.685) (0.708) (0.628) (0.707) (0.64) (0.647) (0.664) Critical level of hidden bias 1.2 1.5 1.6 2 2.1 2.2 2.1 2
Number of treadted Obs. 241 241 241 241 241 241 241 241
Number of control obs. 814 814 814 814 814 814 814 814
Total obs. 1055 1055 1055 1055 1055 1055 1055 1055
Storm ATT -5.636*** -5.636*** -5.636*** -5.636*** -5.636*** -5.636*** -5.636*** -5.636*** (0.636) (0.664) (0.66) (0.65) (0.657) (0.697) (0.682) (0.66) Critical level of hidden bias 1.2 1.4 1.6 2.1 2.5 2.9 2.4 2.5
Number of treadted Obs. 198 198 198 198 198 198 198 198
Number of control obs. 857 857 857 857 857 857 857 857
Total obs. 1055 1055 1055 1055 1055 1055 1055 1055
Extreme temperature ATT -6.67*** -6.67*** -6.67*** -6.67*** -6.67*** -6.67*** -6.67*** -6.67*** (0.983) (0.957) (0.956) (0.993) (0.957) (0.955) (0.941) (0.983) Critical level of hidden bias 1.2 1.2 1.2 1.5 1.7 2.5 1.9 1.8
Number of treadted Obs. 57 57 57 57 57 57 57 57
Number of control obs. 998 998 998 998 998 998 998 998
Total obs. 1055 1055 1055 1055 1055 1055 1055 1055
Nearest-Neighbor matching Radius matching
Table 1: Effects of natural disasters on government revenue
Note: Bootstrapped standard errors are reported in parentheses. They are based on 500 replications of the data, ***p<0.01, significant at 1 percent; **p<0.05, significant at 5 percent; *p<0.10, significant at 10 percent.
To test the robustness of our results to the existence of a potentially hidden bias we perform the Rosenbaum bounds (rbounds) test. For instance, when countries that are generally affected by natural disasters also have a low level of government revenues we can overestimate the impact of natural disasters resulting in negative selection bias. This statistical effect is only meaningful if the impact is significantly different from zero. The results show that the critical level of the hidden bias varies across the type of PSM used. The critical level value ranges varies from 1.1 to 2. Therefore, the unobserved variable would have to increase the odds ratio of the realization of a natural disaster by 10 – 200% before it biased our estimates.
5.2.
Effect of natural disasters on the various components of government
revenue
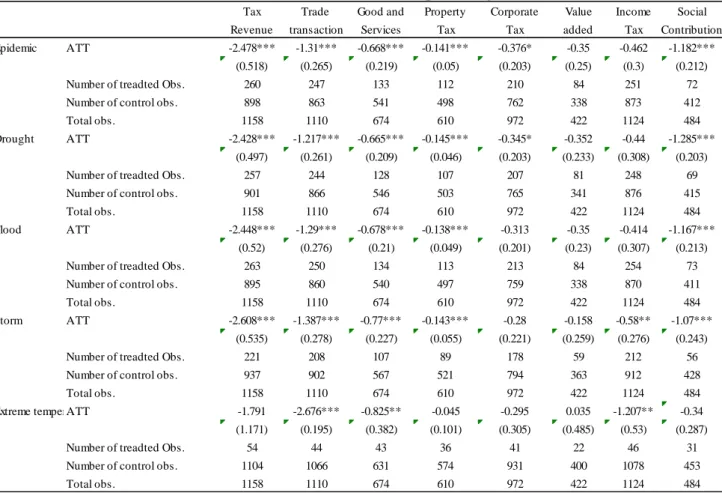
Total government revenues encompass social contributions (e.g. contributions for pensions, healthcare and social security), taxes other than social contributions (e.g. taxes on consumption, income, wealth, property and capital) and grants and other revenues. In this section, we analyze the consequences of natural disasters on each type of revenue source, which can tell us what type of revenue source is most affected by a given natural disaster. All results are presented in Table 2 below. We used the NN matching method but our results are robust to alternative methods of matching.
5.2.1. Total tax revenue
By studying on total tax revenue, we consider the real capacity of the government to increase revenues through taxation. We observe that with the exception of extreme temperature disasters, our selected natural disasters negatively affect tax revenues, and this effect is strongly significant at 1 percent and robust to various propensity score matching estimators. Tax revenues drop by 2.42 percent of GDP for drought disasters to 2.6 percent of GDP in the aftermath of a storm disaster. While we find in Table 1 that extreme temperature disasters have the most harmful effects on government revenues, it is surprising that they have no effect on total tax revenue.
5.2.2. Trade transaction tax
Taxes on international trade include import duties, export duties, export profits or import monopolies, exchange profits and exchange taxes. Natural disasters may affect international trade tax revenues through their impacts on the flows of international trade. Gassebner, Keck and The (2006)
argue that the impact of a disaster on international trade can be transmitted either directly or indirectly. Direct impacts on exports can occur due to human losses and injuries (to company staff and manpower) and the destruction and damage of physical capital and equipment in the export sector. Damage to public infrastructure, such as roads, bridges, railways and telecommunication systems, can cause disruption to the export supply chain. In the case of imports, while similar direct channels can have an adverse effect, most of the impact of a disaster is likely to be transmitted indirectly through a reduction in aggregate economic activity (GDP). Any major reconstruction or rebuilding of damaged infrastructure in the affected countries will likely increase imports, since the required materials, technology or skills may need to come from abroad. Using a gravity model on over 170 countries for the years 1962-2004, Da Silva and Cernat (2012) show that exports decrease and imports increase after a natural disaster. Da Silva and Cernat (2012) also find that exports of affected small developing countries decline by 22% after a natural disaster and that the effects tend to last for about 3 years. Such sharp decline in trade may result in a fall of international trade tax revenues. Our results shed light on trade transaction tax revenues in the aftermath of any type of natural disaster (See Table 2). This effect is strongly significant at the 1 percent level and robust to the different estimators used. As we can observe, extreme temperature disasters create the most harmful effects, contrary to the drought disasters which have relatively lower impacts.
5.2.3. Goods and services
Taxes on goods and services include general sales and turnover or value added taxes, selective excises on goods, selective taxes on services, taxes on the use of goods or property, taxes on extraction and production of minerals and profits on fiscal monopolies. There is no doubt that natural disasters impact both goods and services either in quantum units or in terms of quality and therefore taxes levied from these goods and services. We find that natural disasters negatively impact tax revenue on general goods and services.
5.2.4. Property tax
After loss of life, infrastructure destruction is by far the most obvious type of damage that comes to mind when we think about natural disasters. In many cases property is one of the worst casualties of a natural disaster. Damage is done very quickly and with little warning, and people can be left homeless or in situations where destruction is so bad that rebuilding is impossible. In developing countries, property tax is extracted as an annual tax on urban land and buildings. If buildings are destroyed by natural disasters, it is politically difficult for governments to request property tax
Tax Trade Good and Property Corporate Value Income Social Revenue transaction Services Tax Tax added Tax Contribution Epidemic ATT -2.478*** -1.31*** -0.668*** -0.141*** -0.376* -0.35 -0.462 -1.182***
(0.518) (0.265) (0.219) (0.05) (0.203) (0.25) (0.3) (0.212)
Number of treadted Obs. 260 247 133 112 210 84 251 72
Number of control obs. 898 863 541 498 762 338 873 412
Total obs. 1158 1110 674 610 972 422 1124 484
Drought ATT -2.428*** -1.217*** -0.665*** -0.145*** -0.345* -0.352 -0.44 -1.285*** (0.497) (0.261) (0.209) (0.046) (0.203) (0.233) (0.308) (0.203)
Number of treadted Obs. 257 244 128 107 207 81 248 69
Number of control obs. 901 866 546 503 765 341 876 415
Total obs. 1158 1110 674 610 972 422 1124 484
Flood ATT -2.448*** -1.29*** -0.678*** -0.138*** -0.313 -0.35 -0.414 -1.167*** (0.52) (0.276) (0.21) (0.049) (0.201) (0.23) (0.307) (0.213)
Number of treadted Obs. 263 250 134 113 213 84 254 73
Number of control obs. 895 860 540 497 759 338 870 411
Total obs. 1158 1110 674 610 972 422 1124 484
Storm ATT -2.608*** -1.387*** -0.77*** -0.143*** -0.28 -0.158 -0.58** -1.07*** (0.535) (0.278) (0.227) (0.055) (0.221) (0.259) (0.276) (0.243)
Number of treadted Obs. 221 208 107 89 178 59 212 56
Number of control obs. 937 902 567 521 794 363 912 428
Total obs. 1158 1110 674 610 972 422 1124 484
Extreme temperatureATT -1.791 -2.676*** -0.825** -0.045 -0.295 0.035 -1.207** -0.34 (1.171) (0.195) (0.382) (0.101) (0.305) (0.485) (0.53) (0.287)
Number of treadted Obs. 54 44 43 36 41 22 46 31
Number of control obs. 1104 1066 631 574 931 400 1078 453
Total obs. 1158 1110 674 610 972 422 1124 484
**p<0.05, significant at 5 percent; *p<0.10, significant at 10 percent.
Table 2: Effects of natural disasters on diffrerent component of government revenue
payments from property owners. Therefore, governments have to decide either to provide property tax exemption or to reschedule tax payments for affected people. Our results show that property tax revenues fall by 0.14 percent of GDP in the aftermath of a natural disaster, except in the case of extreme temperature disasters.
5.2.5. Corporate tax
One of the biggest problems for areas affected by natural disasters is business disruption. With road, communication infrastructure, and building damage common after sizable disasters, it is not uncommon for local businesses to be shut down for some time until the aftershocks settle. Furthermore, natural disasters frequently have serious negative effects on a company’s available capital, since they must now spend money to restore assets rather than to advance business operations. Such situations may lead companies into difficult financial circumstances. It is well-documented that firms facing financial constraints exhibit lower cash effective tax payments (Edwards, Schwab and Shevlin, 2013; Chen and Lai, 2012). Indeed, financially-constrained firms engage in tax avoidance more aggressively than financially unconstrained firms. Corporate tax revenues are thus likely to decrease due to natural disasters if they negatively impact business in the affected areas. Our results confirm this expectation for epidemic and drought disasters. We find that corporate tax revenues drop by 0.37 percent after epidemic disasters and by 0.34 percent over GDP after drought disasters. However, the effect is not significantly different from zero for flood, storm and extreme temperature disasters.
5.2.6. Value added tax
Value added tax (VAT) is an indirect tax on the domestic consumption of goods and services, except those that are zero-rated (such as food and essential drugs) or are otherwise exempt (such as exports). VAT is levied at each stage in the chain of production and distribution from raw materials to the final sale based on the value (price) added at each stage. Natural disasters that affect production and consumption may also impact value added tax revenues. It is noteworthy that governments often do not hesitate to exempt value added tax after natural disasters5, which can lower value added tax revenues. However, this effect can be dampened by the increase in purchase and consumption necessary to rebuild damage caused by natural disasters. Our results highlight that natural disasters
5 For instance the decree adopted by the government of Fiji in May 2012 to exempt VAT for people and companies
have no effect on value added tax revenues. Indeed, the impact is not different from zero for the different estimators used and for all types of disasters.
5.2.7. Income tax
From a macroeconomic point of view, a natural disaster can hit a certain area and cause incomes to decrease. Many individuals, as well as urban and regional economies, suffer immediate losses in wealth from physical catastrophes such as floods and storms. Furthermore, a main characteristic of developing countries is the large size of the informal business sector and the lack of insurance. After a natural disaster, people who work in informal sectors are less likely to be insured, which tends to prevent them from returning to work. One consequence of an unforeseen destructive shock is that people working in an informal sector or in small businesses are thought to experience a marked decline in their income and therefore in the tax levied through income. However, disaster areas potentially benefit from recovery efforts if there is a transfer of funds from outside the area that more than compensates for the losses (for instance, remittances from migrant workers). Our results show that the evidence is not clear cut. Indeed, we observe that storm and extreme temperature disasters reduce income tax revenue by 0.58 and 1.20 percent of GDP, respectively while epidemic, drought and flood disasters have no impact on income tax revenues. The effects associated to these three types of disasters are not different from zero in all columns.
5.2.8. Social contributions
Social contributions include social security contributions by employees, employers, and self-employed individuals, and other contributions whose source cannot be determined. They also include actual or imputed contributions to social insurance schemes operated by governments. If many employees lose their jobs or companies are forced to lay off a large number of workers after a natural disaster, there is no doubt that social contributions may also decrease. Our results are consistent with this expectation. With the exception of extreme temperature disasters, the other selected natural disasters have negative effects on social contributions, which fall from 1.07 percent of GDP for storm disasters to 1.28 percent of GDP for drought disasters.
This section shows that the effects of natural disasters on tax revenues depend on the type of revenue source. While epidemic and drought disasters negatively impact all sources of revenue except value added tax and income tax, extreme temperature disasters have no effect on total tax revenues, property tax revenues, corporate tax revenues, value added tax revenues or social contributions. As for flood and storm disasters, they do not affect corporate tax and value added tax revenues.
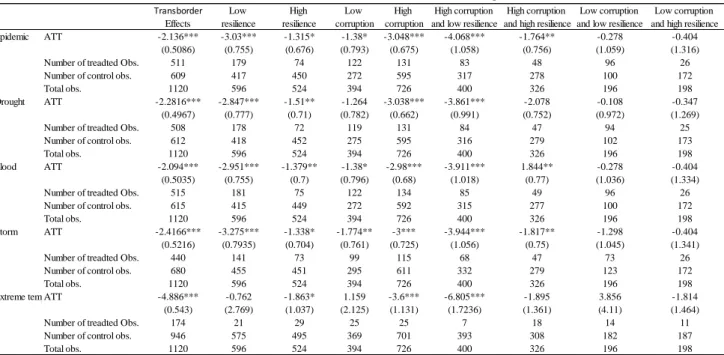
5.3. Transborder effects of natural disasters
Heretofore, we have assessed the effects of natural disasters on government tax revenues. However, millions of people are displaced by climate-related disasters each year. While most of the displacement caused by these events is internal, these disasters can also cause people to cross national borders. There are many factors that force people to cross borders: severe socio-economic deprivation, lack of food, water, heath care, livelihood and so on. For instance, during the 1968-1972 drought disaster that caused around 1 million deaths in Burkina Faso, Chad, Mali, Mauritania and Niger, many people moved to Côte d’Ivoire to look for a better life. Beyond population movements, some natural disasters are transnational, such as the 2014 India-Pakistan floods that caused nearly 277 deaths in India and 280 in Pakistan. Furthermore, the Ebola virus spread fear across the Western African countries and has resulted in a loss of foreign investors and a decline of expected economic growth6 in the region. Given the strong trade, markets, financial and community integration between bordering countries, a natural disaster that affects one country can also have impact on bordering countries. Thus, we are challenged to question whether natural disasters that occur in a given country impact tax revenue in its border countries. Therefore, we construct a dummy variable that takes the value of one if there is a natural disaster in a bordering country and zero otherwise. We then use propensity score matching estimators to estimate the effects of natural disasters on the tax revenues of bordering countries. Our results are reported in Table 3. We observe that natural disasters in a given bordering country have negative effects on the tax revenues of bordering countries. This harmful effect is strongly significant at the 1 percent level and robust to various estimators. This finding puts forward the necessity for bordering countries to coordinate action in order to cope with natural disasters.
6
http://www.worldbank.org/en/news/press-release/2014/10/08/ebola-new-world-bank-group-study-forecasts-billions-in-economic-loss-if-epidemic-lasts-longer-spreads-in-west-africa
6. Role of resilience capacity, quality of governance and transborder
effects
In the previous section, we show that natural disasters in general have negative effects on government revenues. However, this effect may depend on the countries’ characteristics of and even on affected neighboring countries. In this section, we assess the role of resilience capacity, the quality of governance and transborder effects.
6.1. The role of resilience capacity
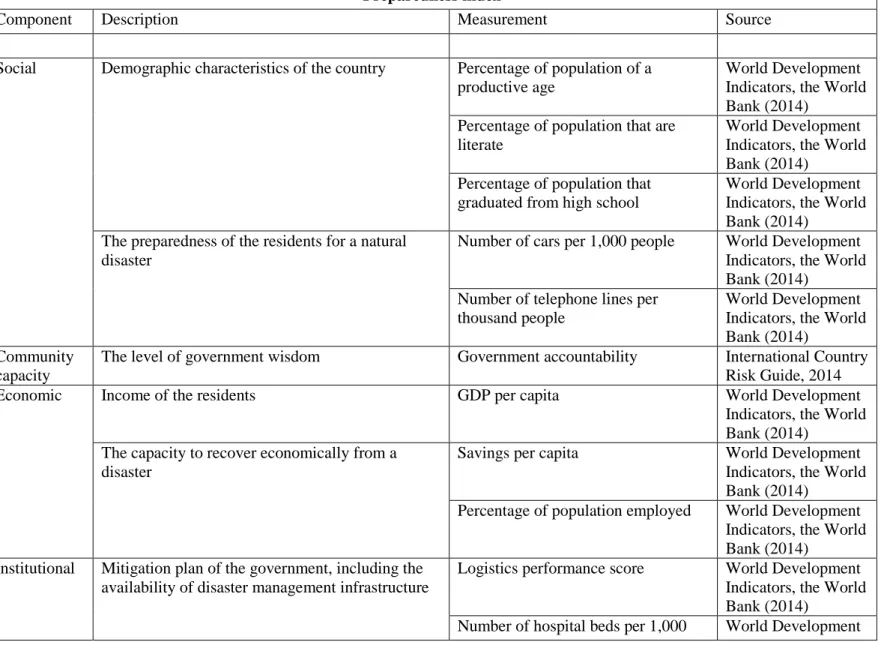
A high level of resilience capacity may help countries to cope with a disaster with minimum impact on government revenues. The United Nations International Strategy for Disaster Reduction (UNISDR) defines resilience as “the ability of a system, community or society exposed to hazards to resist, absorb, accommodate to and recover from the effects of a hazard in a timely and efficient manner, including through the preservation and restoration of its essential basic structures and functions”. To assess the role of resilience capacity, we follow Kusumastuti et al (2014) and construct an index of resilience for each country included in our study. Kusumastuti et al (2014) measure resilience as the ratio of a community’s preparedness to its vulnerability. Preparedness refers to the capacity to handle disaster, while vulnerability is defined as the potential for loss. More specifically, preparedness incorporates five major components: social dimension (demographic
Transborder Low High Low High High corruption High corruption Low corruption Low corruption Effects resilience resilience corruption corruption and low resilience and high resilience and low resilience and high resilience Epidemic ATT -2.136*** -3.03*** -1.315* -1.38* -3.048*** -4.068*** -1.764** -0.278 -0.404
(0.5086) (0.755) (0.676) (0.793) (0.675) (1.058) (0.756) (1.059) (1.316)
Number of treadted Obs. 511 179 74 122 131 83 48 96 26
Number of control obs. 609 417 450 272 595 317 278 100 172
Total obs. 1120 596 524 394 726 400 326 196 198
Drought ATT -2.2816*** -2.847*** -1.51** -1.264 -3.038*** -3.861*** -2.078 -0.108 -0.347 (0.4967) (0.777) (0.71) (0.782) (0.662) (0.991) (0.752) (0.972) (1.269)
Number of treadted Obs. 508 178 72 119 131 84 47 94 25
Number of control obs. 612 418 452 275 595 316 279 102 173
Total obs. 1120 596 524 394 726 400 326 196 198
Flood ATT -2.094*** -2.951*** -1.379** -1.38* -2.98*** -3.911*** 1.844** -0.278 -0.404 (0.5035) (0.755) (0.7) (0.796) (0.68) (1.018) (0.77) (1.036) (1.334)
Number of treadted Obs. 515 181 75 122 134 85 49 96 26
Number of control obs. 615 415 449 272 592 315 277 100 172
Total obs. 1120 596 524 394 726 400 326 196 198
Storm ATT -2.4166*** -3.275*** -1.338* -1.774** -3*** -3.944*** -1.817** -1.298 -0.404 (0.5216) (0.7935) (0.704) (0.761) (0.725) (1.056) (0.75) (1.045) (1.341)
Number of treadted Obs. 440 141 73 99 115 68 47 73 26
Number of control obs. 680 455 451 295 611 332 279 123 172
Total obs. 1120 596 524 394 726 400 326 196 198
Extreme temperatureATT -4.886*** -0.762 -1.863* 1.159 -3.6*** -6.805*** -1.895 3.856 -1.814 (0.543) (2.769) (1.037) (2.125) (1.131) (1.7236) (1.361) (4.11) (1.464)
Number of treadted Obs. 174 21 29 25 25 7 18 14 11
Number of control obs. 946 575 495 369 701 393 308 182 187
Total obs. 1120 596 524 394 726 400 326 196 198
Table 3: Natural disaster and Tax revenue : Transborder, resilience and corruption effects
Note: Bootstrapped standard errors are reported in parentheses. They are based on 500 replications of the data; ***p<0.01, significant at 1 percent; **p<0.05, significant at 5 percent; *p<0.10, significant at 10 percent.
characteristics of the country and the preparedness of the country to respond to a natural disaster), community capacity (government accountability), economic capacity (income per capita and the capability to recover economically from a disaster), institutional capacity (mitigation plan) and infrastructure capacity (the availability of electricity, clean water, sanitation, transportation networks and transportation access in the country). As for vulnerability, it consists of social vulnerability (related to demographic characteristics), community capacity (vulnerability related to wealth generating), infrastructure (vulnerability related to building) and hazard (variety of natural disasters in the country, frequency of natural disasters in the country, the severity of impact caused by the largest-scale of disaster that has occurred in the country). To perform a resilience index, an equally weighted index is constructed7. Each of the variables used to measure the different components of preparedness and vulnerability is standardized to lie between zero and one. The values for the different components are then combined with an equal weighting to calculate the country index of preparedness and vulnerability. The resilience score is calculated as the ratio of preparedness score to vulnerability score. If the value is lower than one, this indicates that the country is not resilient to natural disaster as its capacity to overcome the disaster is lower than its vulnerability. If the value is equal to 1, it means that the country has just enough capacity to overcome its vulnerability. If the value is more than one, it implies that the area is resilient towards natural disaster as it has the capacity to overcome its vulnerability.
We distinguish two groups of countries: one for countries with a resilience score equal to or above 1 referred to as “high resilience capacity” countries and another for countries with a resilience score below 1. We estimate the effects of natural disasters for each group. Results are reported in Table 3. We observe that the effects of natural disasters on tax revenues are more harmful in countries with a low resilience capacity score. Indeed, tax revenues drop by 2.85 percent of GDP for drought disasters to 3.27 percent of GDP for storm disasters in countries with low resilience capacity, that is, twice as high as the decline of tax revenues after natural disasters in countries with high resilience capacity (1.31 percent to 1.86 percent of GDP).
6.2. The role of quality of governance
Studies including Anbarci, Escaleras and Register (2005), Kahn (2005), Gassebner, Keck and The (2006) highlight that governance is a key driver in determining the magnitude of the effect caused by natural disasters. Countries that are well-governed are better at coping with disasters. Kahn (2005) argues that the one possible reason that bad quality of institutions suffer from natural disasters is
7 See the Appendix for more detail.
corruption. Government corruption can raise death counts due to lack of enforcement of building codes, infrastructure quality and zoning. We therefore assess the role of corruption in the effects of natural disasters on tax revenues. We use data extracted from the Database of Political Institutions (World Bank, 2014). To assess the role of corruption, we divide our sample into two sub-samples pre-determined by the median score. More specifically, high-score countries are those which have scores above the median, while low-score countries have scores below the median. We estimate propensity score matching in each group of countries. Results are reported in Table 3. As one can observe, the most corrupted countries experience the most adverse effects of natural disasters. Indeed, tax revenues fall in the most corrupt countries by 2.98 to 3.6 percent of GDP, contrary to countries with a low level of corruption where the adverse effects are around 1.38 to 1.77 percent of GDP.
In regarding to previous findings on resilience and corruption, we wanted to know what would occur if we combined the two types of country characteristics. We distinguish 4 groups: countries with high corruption and low resilience capacity, countries with high corruption and high resilience capacity, countries with low corruption and low resilience capacity and countries with low corruption and high resilience capacity. We have therefore two mixed cases and two extreme cases, i.e., one of high corruption and low resilience (very unfavorable circumstances) and one of low corruption and high resilience capacity (more favorable circumstances). We then use the nearest-neighbor matching estimator to estimate the effects of natural disasters on tax revenues for each group of countries. Results reported in Table 3 show that natural disasters have adverse effects on tax revenues in countries with a high level of corruption and low level of resilience capacity, contrary to countries with a low level of corruption and a high level of resilience capacity where the effects are not different from zero. Therefore, countries that have higher resilience capacity and are well governed are best able to cope with natural disasters. As for mixed cases, we observe that natural disasters do not affect tax revenues in countries with a low level of corruption and low level of resilience capacity, while they have harmful effects in countries with a high level of corruption and a high level of resilience capacity. These findings highlight the importance of fighting against corruption and of building resilience frameworks in order to cope with the damage of natural disasters.
7. Robustness checks: Propensity score weighting with clustered
data
Traditional methods of matching do not take into account the structure of panel data. For example, using the nearest neighbor matching method, a country treated in 1980 can have an untreated country
in 2012 as a control country. Although their propensity scores are identical, the structure of economies in 1980 and 2012 are very different. In addition, the global economic environment has fundamentally changed between these two periods. Therefore, these countries are not comparable. The control variables allow us to reduce such discrepancies, however, there may still be estimation bias. The nonparametric clustered estimator proposed by Li et al. (2012) allows us to calculate an ATT year, then aggregates the ATT for the average effect:
𝐴𝑇𝑇𝑐𝑙 =∑ 𝑝𝑇𝑡 𝑡 𝐴𝑇𝑇̂𝑡∑ 𝑝𝑡 𝑡𝐴𝑇𝑇̂𝑡 ∑ 𝑝𝑇𝑡 𝑡
with 𝑝𝑡 = ∑ 𝑝𝑖 𝑖𝑡 and 𝑝𝑖𝑡 the probability of a country i at time t to be affected by a natural disaster.
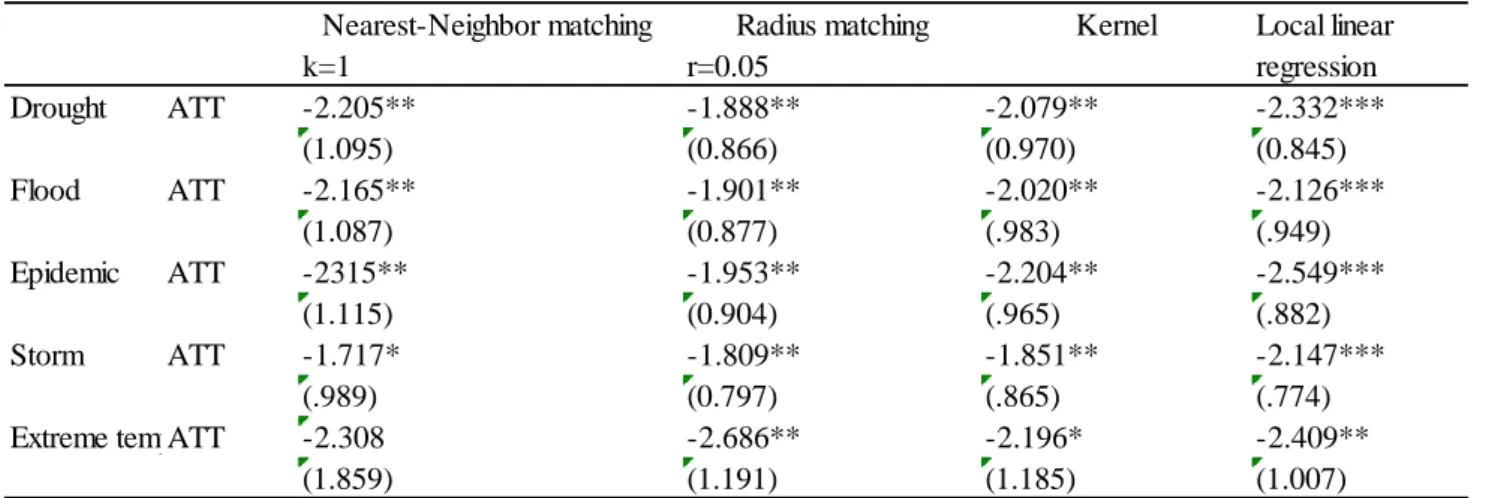
Our results, presented in Table 4, show that the negative effect of natural disasters on income is robust to the inclusion of the time dimension in the PSM analysis even if the effects are less significant than in the traditional PSM. Applying this model to other estimates in this paper, we obtain results similar to those shown. Our results are therefore robust. Results for all estimates are available upon request.
Nearest-Neighbor matching Radius matching Kernel Local linear
k=1 r=0.05 regression Drought ATT -2.205** -1.888** -2.079** -2.332*** (1.095) (0.866) (0.970) (0.845) Flood ATT -2.165** -1.901** -2.020** -2.126*** (1.087) (0.877) (.983) (.949) Epidemic ATT -2315** -1.953** -2.204** -2.549*** (1.115) (0.904) (.965) (.882) Storm ATT -1.717* -1.809** -1.851** -2.147*** (.989) (0.797) (.865) (.774)
Extreme temperatureATT -2.308 -2.686** -2.196* -2.409**
(1.859) (1.191) (1.185) (1.007)
***p<0.01, significant at 1 percent; **p<0.05, significant at 5 percent; *p<0.10, significant at 10 percent.
Table 4: Effects of natural disasters on government revenue
8. Conclusion
In this paper, we investigate the effects of natural disasters on domestic resources mobilization. Natural disasters are increasing in developing countries and the resulting damage is growing more and more harmful. Natural disasters kill people, destroy economies and production capacity, reduce international trade, pose a threat to business and commerce and reduce the tax base. This study, to our knowledge, the first of its kind in natural disaster studies, takes a different approach from previous works and uses propensity score matching estimators to tackle the selection bias issue. Our research covers 120 developing countries over the period of 1980-2012 and estimates the effects of five types of natural disasters (epidemic, drought, flood, storm and extreme temperature) on government revenue and its components. We find that, in general, natural disasters have negative effects on domestic revenue, but these effects depend on the type of levied revenue sources. Furthermore, we find that natural disasters in a given country have harmful effects on the tax revenues of the bordering countries. However, our results show that these adverse effects are dampened in countries with a high capacity of resilience or in well-governed countries. Moreover, we find that countries with combined strong governance and high resilience capacity are able to cope with the effects of natural disasters on tax revenues, while countries with combined weak governance and a low level of resilience capacity lose out on large tax revenues after natural disasters.
Thus, our findings call for the adoption of resilience capacity frameworks and for the need to adopt appropriate policies conducive to the effective promotion of good governance. With the implementation of the post-2015 international development agenda, which tends to call for more efforts in tax collection, governments should adopt policies in order to address the harmful effects of natural disasters. The fight against corruption and the implementation of resilience frameworks both at national and international levels should be high priorities for developing countries.
References
Albala-Bertrand, J. M. (1993). Political Economy of Large Natural Disasters With Special Reference to Developing Countries. Oxford, Clarendon Press.
Anbarci, N., Escaleras, M. and Register, C. A. (2005). Earthquake Fatalities: The Interaction of Nature and Political Economy, Journal of Public Economics 89(9-10), 1907-1933.
Bluedorn, J.C. (2005). Hurricanes: Intertemporal Trade and Capital Shocks. Oxford Economics Working Paper No. 2005-241.
Cavallo, E., S. Galiani, I. Noy and J. Pantano (2011). Catastrophic Natural Disasters and Economic Growth. IDB Working Paper Series No. IDB-WP-183
Chen, C. and S. Lai (2012). Financial constraint and tax aggressiveness. University of Auckland and Chinese University of Hong Kong.
CRED (2014). EM-DAT: International Disaster Database. Brussels, Belgium, Centre for Research on the Epidemiology of Disasters, Université Catholique de Louvain.
Crowards, T. (2000). Comparative vulnerability to natural disasters in the Caribbean. Charleston, South Carolina, Caribbean Development Bank.
Cuaresma, J.C., J. Hlouskova, and M. Obersteiner. (2008). Natural disasters as Creative Destruction? Evidence from Developing Countries. Economic Inquiry 46(2), 214-226.
Da Silva, J. A. and L. Cernat (2012). Coping with loss: the impact of natural disasters on developing countries’ trade flows. European Commission issue 1-2012, ISSN 2034-9815
Dehejia, R., Wahba, S. (2002). Propensity score-matching methods for non experimental causal studies. Reviews of Economics and Statistics, Vol 84, 151–161.
Edwards, A., C. M. Schwab, and Shevlin, T. J. (2013). Financial Constraints and the Incentive for Tax Planning. 2013 American Taxation Association Midyear Meeting: New Faculty/ Doctoral Student Session. Available at SSRN: http://ssrn.com/abstract=2216875
Evans, R. W., H. Yingyao, and Z.Zhao (2009). The Fertility Effect of Catastrophe: U.S. Hurricane Births. Journal of Population Economics, 23(1), 1-36.
Gassebner, M., A. Keck and R. The (2006). The impact of disasters on international trade. Staff Working Paper ERSD-2006-04, World Trade Organization.
Hallegatte, S. and P. Dumas. (2009). Can Natural Disasters have Positive Consequences? Investigating the Role of Embodied Technical Change. Ecological Economics 68(3), 777-786.
Heckman, J., Ichimura, H. and Todd, E., (1998). Matching as an econometric evaluation estimator.
Reviews of Economics Studies, Vol. 65, 261–294.
Heger, M., A. Julca, and O. Paddison (2008). Analyzing the Impact of Natural Hazards in Small Economies: The Caribbean Case. UNU/WIDER Research Paper2008/25.
Hochrainer, S. (2009). Assessing the Macroeconomic Impacts of Natural Disasters – Are there Any? World Bank Policy Research Working Paper 4968. Washington, DC, United States: The World Bank.
Kahn, M. (2005). The Death Toll From Natural Disasters: The Role of Income, Geography, and Institutions. Review of Economics and Statistics 87, 271-284.
Li, F., Landrum, M., and Zaslavsky, A. (2013). Propensity score weighting with multilevel data. Statistics in Medicine, 32(19), 3373–3387.
Loayza, N., E. Olaberría, J. Rigolini, and L. Christiansen. (2009). Natural Disasters and Growth-Going Beyond the Averages. World Bank Policy Research Working Paper 4980. Washington, DC, United States: The World Bank.
Mechler, R. (2009). Disasters and Economic Welfare: Can National Savings Help Explain Postdisaster Changes in Consumption? World Bank Policy Research Working Paper 4988. Washington, DC, United States: The World Bank
Neumayer, E. and T. Plümper T. (2007). The Gendered Nature of Natural Disasters: the Impact of Catastrophic Events on the Gender Gap in Life Expectancy, 1981–2002. Annals of the Association of
American Geographers 97(3), 551–566.
Noy, I. (2009). The Macroeconomic Consequences of Disasters. Journal of Development Economics 88(2): 221-231.
NOY, I. and A. NUALSRI (2011). Fiscal storms: public spending and revenues in the aftermath of natural disasters. Environment and Development Economics, 16, 113-128.
Noy, I. and T.B. Vu (2010). The Economics of Natural Disasters in a Developing Country: The Case of Vietnam. Journal of Asian Economics, Vol 21, 345-354
Okuyama, Y. (2009). Impact estimation of higher order effects. Background paper for EDRR report. GFDRR, Washington, DC.
Raddatz C. (2009). The Wrath of God: Macroeconomic Costs of Natural Disasters. Policy Research Working Paper 5039, the World Bank.
Rodriguez-Oreggia, E., A. de la Fuente, and R. de la Torre (2009). The Impact of Natural Disasters on Human Development and Poverty at the Municipal Level in Mexico. The United Nations Development Programme.
Rosenbaum, P., and Rubin, D. (1983). The central role of the propensity score in observational studies for causal effects. Biometrika, Vol. 70, 41–55.
Skidmore, M. and Toya, H. (2002). Do Natural Disasters Promote Long-Run Growth? Economic
Inquiry 40(4), 664-687
United Nations (2007). Emergency Report, Sit Rep #14. SIDR Cyclone Bangladesh 2007.
http://reliefweb.int/sites/reliefweb.int/files/resources/BC5BCB7756CBE588852573B1005EC73A-Full_Report.pdf
United Nations (2009). Post-Nargis Joint Assessment.
http://yangon.sites.unicnetwork.org/files/2013/05/post-nargis_joint_assessment_all_pages.pdf UNDP. 2013. Human Development Report 2013: The Rise of the South: Human Progress in a Diverse World. New York.
UNDP. 2014. Sustaining Human Progress: Reducing Vulnerabilities and Building Resilience. New York.
Yamamura, E (2013). Impact of natural disasters on income inequality: Analysis using panel data during the period 1965 to 2004. MPRA Paper No. 45623.
Yang, D. (2008). Coping With Disaster: The Impact of Hurricanes on International Financial Flows. B.E. Journal of Economic Analysis and Policy 8(1),13.
Appendices
Afghanistan Grenada Nicaragua
Angola Guatemala Nepal
Albania Guyana Pakistan
Argentina Honduras Panama
Armenia Haiti Peru
Burundi Hungary Philippines
Benin Indonesia Papua New Guinea
Burkina Faso India Paraguay
Bangladesh Iran Romania
Bulgaria Iraq Rwanda
Bosnia & Herzegovina Jamaica Senegal
Belarus Jordan Solomon Is.
Belize Kazakhstan Sierra Leone
Bolivia Kenya El Salvador
Brazil Kyrgyzstan Serbia
Bhutan Cambodia Sao Tome & Principe
Botswana Laos Swaziland
Central African Republic Lebanon Seychelles
China Liberia Syria
Cote d'Ivoire Libya Chad
Cameroon St. Lucia Togo
Congo Sri Lanka Thailand
Colombia Lesotho Tajikistan
Comoros Morocco Turkmenistan
Cape Verde Moldova Timor-Leste
Costa Rica Madagascar Tonga
Djibouti Maldives Tunisia
Dominica Mexico Turkey
Dominican Republic Macedonia Tanzania
Algeria Mali Uganda
Ecuador Myanmar Ukraine
Egypt Montenegro Uzbekistan
Eritrea Mongolia St. Vincent & the Grenadines
Ethiopia Mozambique Venezuela
Fiji Mauritania Vietnam
Gabon Mauritius Vanuatu
Georgia Malawi Samoa
Ghana Malaysia Yemen
Guinea Namibia Zimbabwe
The Gambia Niger
Guinea-Bissau Nigeria
Table A2: Data sources
Variable Data sources
Natural disasters International Disaster Database of the Centre for Research
on the Epidemiology of Disasters (CRED)
GDP per capita World Development Indicators, the World Bank (2014)
Trade openness: Imports plus exports as a percentage of GDP
World Development Indicators, the World Bank (2014)
Government revenue and its components, all over GDP
IMF database
Aid per capita World Development Indicators, the World Bank (2014)
Share of agriculture value added as a percentage of GDP
World Development Indicators, the World Bank (2014)
Natural resources as a percentage of GDP
World Development Indicators, the World Bank (2014)
Primary net school enrollment World Development Indicators, the World Bank (2014)
Polity 2 measures the degree of democracy
Polity 4 Project database
Corruption Database on Political Institutions, the World Bank (2014)
Distance to equator ESRI ArcGIS 10.2
Length of the coasts ESRI ArcGIS 10.2
Slope ISciences’ Elevation & Depth Map - 30 Arc Second.