This project is funded by the European Union under the 7th Research Framework Programme (theme SSH) Grant agreement nr 290752. The views expressed in this press release do not necessarily reflect the views of the European Commission.
Working Paper n°33
Clientelism and Redistribution in South Africa: Evidence on
Perceptions and Attitudes from a Field Survey
UCT-SALDRU
Cosimo Paulucci de Calboli
1
Introduction
In attempting to shed light on the potential limits to redistribution in high-inequality young democracies, clientelistic practices may be at the forefront of research into the matter. Central to the question is whether politicians allocate public goods equitably and programmatically in order to maximise social welfare or whether goods are allocated in an opportunistic manner so as to alter electoral outcomes to favour politicians themselves (Gallego&Wantchekon, 2012:1). This study makes use of a survey conducted in two low-income areas – the townships of Khayelitsha and Delft – in Cape Town, South Africa. The survey yields information into the as yet unexplored perceptions on and attitudes towards the concept in South Africa. The work conducted in collecting the data and administering the survey is itself one of the contributions of the overall study. This paper attempts to illustrate one of the possible areas of research that can be furthered with the use of the data that has been collected. We find evidence of a relationship between attitudes towards clientelism (and clientelistic practices) and redistributive preferences. We suggest promising avenues for further investigation into the exact nature of this relationship.
Background
South Africa ranks amongst the most unequal countries in the world as a product of its history. The policies enacted during apartheid resulted in the majority of the population being marginalised both politically and economically. Despite the transition to democracy, problems such as poverty and unemployment remain widespread. Indeed, following the end of apartheid, the country has seen an increase in aggregate measures of inequality such as the Gini coefficient (Leibbrandt et al., 2011:2). As such, issues surrounding the redistribution of income ostensibly remain issues of concern for policy makers. Nonetheless, while redistribution has increased somewhat since 1993, the levels of redistribution are only marginally higher than in Latin American countries and well below levels in European countries (Leibbrandt et al., 2011:6). To date, much of the government’s policy aimed at bringing about redistribution in South Africa has centred on a large social grant system – including the child support grant and state pensions. A large portion of the population depends on this system in order to support themselves (Pellicer et al., 2014). The focus of this study, however, is not on redistribution itself, but on potential limits to redistribution in South Africa. Given the country’s extreme levels of inequality, it is surprising to observe that the demand for redistribution in South Africa is average when compared to other countries and is, in fact, below many non-OECD countries. Based on the answers of the respondents in the survey used as the dataset for this study, it appears as though greater concern exists for the provision of jobs by the government than for redistribution through policies enacted.
The South African Political Landscape
Some background relating to the South African political landscape is useful at this point. To begin with, South Africa is characterised by a dominant party system. Since winning the country’s first democratic elections in 1994, the African National Congress (ANC) has remained in power – winning subsequent elections in 1999, 2004, 2009 and 2014. This dominance is arguably due to the sustained significance of identity politics, which is defined along racial lines (Southern, 2011:281). However, support for the primary opposition party – the Democratic Alliance (DA) – has increased significantly since 1994. This is particularly the case in the Western Cape, where the party won the majority in the 2009 provincial elections, forming a coalition government in the process (Southern, 2011:291). The purpose of this study is to study whether clientelistic practices in South Africa present a possible hindrance to redistributive preferences in South Africa. Thus, a brief review of some of the literature relating to clientelism is apposite.
Clientelism
The literature dealing with clientelism highlights the problems associated with this phenomenon. It occurs and succeeds in many political contexts – ranging across the political spectrum from democracies to autocracies (Hicken, 2011:290). Clientelism’s consequences include a diversion of
2
scarce resources that could otherwise have been used to further economic development. Moreover, it disincentivises the upliftment of constituents and encourages clientelistic patrons to keep their constituents dependent. It is also seen as a challenge to democracy and indicates suboptimal political patterns. The ability of citizens to hold elected officials accountable – both individually and collectively – is weakened in the face of clientelism and through fear and narrow self-interest corrupt officials are kept in power. Finally, it also breeds high levels of corruption and damages public trust in democratic institutions (Hicken, 2011:290).
Nonetheless, the concept remains without a generally accepted definition, although certain elements appear to be common to most definitions. Of particular relevance to this study – an indeed an element common to every definition of the term – is the notion of contingency (Hicken, 2011:290-291). The element of contingency that forms part of all definitions means that the benefits received by individuals from politicians are contingent on the individuals’ support for the politician. In other words, the politician provides benefits to voters as long as the voters vote for that politician. Importantly, what distinguishes clientelism from other types of exchange is that benefits are exchanged for political support, generally in the form of voting.
The other elements that form part of a general concept of clientelism include the notions that clientelism involves dyadic relationships, that it is hierarchical and that it is an iterative phenomenon (Hicken, 2011:290). The first of these elements constituted the primary focus of early academic discourse surrounding clientelism and emphasised the relationship between the patron and the client. More recently, this focus has turned towards brokers and networks, rather than direct, face-to-face interactions (Hicken, 2011:291). The second of these elements – hierarchy – is generally included in the sociology literature dealing with clientelism. Intuitively, it is widely held that the patron will rank hierarchically above the client and wields considerably more influence through access to resources, to which they then provide to the client. Conversely, it has also been argued that clientelistic relationships between the patron and the client is more akin to a principal-agent relationship with the client as the principal (Hicken, 2011:292). Finally, iteration is used to distinguish clientelism from other forms of interaction between politicians and voters – as is the case with contingency differentiating clientelistic practices from other forms of exchange. Essentially, clientelism is an on-going relationship with both sides anticipating future interactions with one another (Hicken, 2011:292-293). The variables collected through the survey allow for an analysis of preferences and attitudes towards clientelism and how these may relate to redistribution in South Africa. Prior to analysing some of the data gathered by the survey, it is also helpful to gain a greater understanding on some of the background and history of the areas where the survey was conducted – Khayelitsha and Delft.
Data
Khayelitsha is an expansive township situated around 35 kilometres southeast of the city of Cape Town. Based on data from the national census in 2011, the population is around 391 749 people in 118 809 households, with an average household size of 3.30 individuals. In 2011, just under 75% of households had a monthly income of between zero and R3200 (about 300 USD), inclusive. This figure includes the 18.8% of households that report a monthly income of zero. Around 99% of the population forms part of the African race group. The township is made up of both informal housing – small dwellings constructed from materials such as wood or corrugated iron – and formal brick housing. Around 45% of households live in formal dwellings (Statistics South Africa, 2013b).
Originating during the 1980s apartheid era, the settlement is populated to a large degree by migrants primarily from the Eastern Cape – a rural province that neighbours the Western Cape. Due to its formation as a result of apartheid planning, Khayelitsha remains both racial and marginalised in nature and character (Du Toit &Neves, 2007; Nleya& Thompson, 2009). It is important to note that Cape Town’s economy has not succeeded in fully integrating the large, impoverished and low-skilled population that migrated to the Western Cape from the Eastern Cape in search of employment. Part of this can be attributed to the failure of the South African manufacturing sector (Du Toit &Neves, 2007). However, an in-depth discussion of the broader factors affecting conditions in Khayelitsha is not within the ambit of this study. It suffices to note that for years, institutional practices and market forces tended to reinforce the spatial divisions
3
that were created as a result of apartheid. These spatial divisions have exacerbated the gap between Cape Town’s more affluent areas and the townships partly because of the reduced access the residents of Khayelitsha and other townships have to economic and social opportunities (Turok, 2001:2371).
The second township forming part of the survey is Delft. Delft – like Khayelitsha and many other townships in Cape Town – was formed during apartheid. The government’s policies imposed strict residential segregation, with the result being the necessity to find spaces to accommodate the expanding coloured and African populations. Delft was among the townships constructed during the 1970s and 1980s to accommodate the coloured population (Turok, 2001:2351). The township is located next to Cape Town International Airport and is comprised of six sub-areas. According to the 2011 national census data, Delft’s population was recorded as 152 030 people living in 39 576 households, with the average household size being 3.84 individuals per household.
A comparison of the census data between the two townships indicates that Delft is somewhat economically better off than Khayelitsha, yet remains a low income area. The percentage of households earning R3200 a month or less is 69%. However, 20% of households in Delft earn no monthly household income (Statistics South Africa, 2013a). While Delft is also made up of both informal and formal housing, the proportion of residents living in formal housing is much higher than in Khayelitsha – being at 83%. Delft also differs from Khayelitsha in terms of the racial makeup of its population. While originally designated as a coloured township, today it is a mixed-race township, although the majority of the population – 52% – is coloured, with 46% being classified as African. The census data also indicates somewhat better access to infrastructure and public service delivery – such as access to piped water, electricity and refuse removal – than in Khayelitsha (Statistics South Africa, 2013a).
The data used in this study was collected from both of the townships discussed above. In Khayelitsha, where almost the entire population are members of the African population group as mentioned, the entire sample is African. In Delft, on the other hand, the sample consists almost entirely – more than 99% - of coloured individuals, despite the township being mixed-race. The sampling in Delft was limited to coloured individuals by design. The initial survey occurred in July and October 2013, while interviews were conducted in March and April 2014. In total, there are 1644 individuals in the dataset from both townships. The number of individuals interviewed in Khayelitsha was 1,210, while there are 434 individuals surveyed from Delft.The data was captured on mobile devices and directly transmitted to theserver after the completion of the interview together with the GPS location. Thisallowed for an immediate check of the accuracy of the interview location andfor the monitoring of data quality. Data quality was monitored throughout thesurvey by the survey company and the investigators who had access to the data in real time. Collection of the data was a major endeavour and required extensive fieldwork, along with professional translators for the survey respondents.We believe this newly available dataset can contribute to fill the gap in knowledge about the perceptions on politics and clientelism in the South African townships.We now turn to describe some of the variables contained in the dataset.
A number of the variables in the dataset are dummy variables because they are responses to a simple “yes or no” question. These dummy variables include the survey questions that attempt to elicit preferences for redistribution as well as perceptions of inequality amongst respondents. Three of these kinds of variables of interest in particular include the perception of an inequality problem in South Africa, the support for a Basic Income Grant (BIG) and attitudes towards the level of taxation of the rich. The first of these is the answer to the question “Do you think the gap between rich and poor is a serious problem in South Africa?” where a value of 1 indicates a yes and a value of 0 indicates a no. Related to this question is a question on the inevitability of the gap between rich and poor in South Africa, where a response that the large gap is inevitable takes on a value of 1 and an answer that the gap could be smaller takes on a value of 0. The Basic Income Grant question explains the proposed grant to the survey respondent before asking whether or not they would support such a grant. Briefly, the BIG would be a grant to all South Africans and would differ from existing grants because all South Africans would be entitled to it. The variable is analogous to the previous one. Finally, for the question on the level of taxation,
4
respondents could answer whether they believed wealthy households or individuals should pay less, more or the same amount of tax.
Other dummy variables include the answers to the questions on whether respondents believe it is acceptable for voters to accept gifts from politicians, as well as whether they think that a voter who has received a gift from a politician subsequently has a moral obligation to vote for that politician. In relation to the perceptions of government and politics, respondents are asked which political party they identify the most strongly with, what proportion of government officials they believe are corrupt, whether respondents believe that government wastes money or uses money carefully, how often they think they can trust the national government to do what is right and what the role of government as opposed to individual responsibility. The questions relating to gifts provided by politicians are, intuitively, dummy variables. This is also the case for the question on whether government wastes money or not – with “careful” taking on a value of 0 and “wasteful” taking on a value of 1. On the other hand, the perceived proportion of corrupt government officials, the frequency with which government can be trusted to do what is right and the perceptions of government versus individual responsibility are all categorical variables. We now turn to examining some of the summary statistics related to the variables discussed.
Summary Statistics
This section outlines the summary statistics of some of the variables relevant to clientelism obtained from the survey. Table 1 contains a summary of the responses to the some of the variables discussed in the previous section. As can be seen, a large majority of survey respondents – 91.75% – perceive the gap between the rich and the poor in South Africa to be a serious problem. This is consistent across both townships surveyed, with just over 90% of the sample from both of the respective townships responding that the inequality in South Africa is indeed a problem. Support for the BIG is more mixed, although the majority – 61.15% of the pooled sample – favours its institution. Interestingly, when considering the two townships individually, support for the BIG in the Delft sub-sample is much higher, with just under 75% of survey respondents in Delft indicating their support, while only around 57% of respondents in Khayelitsha were in favour of the BIG.
In terms of variables relating directly to clientelism or clientelistic practices, overall it appears as though a relatively small majority – 54.37% of the total sample – do not see the receipt of gifts from a politician as being acceptable. These responses again differ by township, however. In Khayelitsha, there is an almost equal split between positive and negative answers to the question – with 51.43% being not seeing the receipt of gifts as acceptable. In Delft on the other hand, 60.82% of respondents viewed receivinggifts from politicians as not acceptable. The survey responses also indicate that there does not appear to be a general moral imperative to vote following the receipt of a gift from a politician, with just under 90% of respondents indicating “No”. Once again, there is slight variation between the two townships, with 85.51% and 91.10% of respondents indicating “No” in Delft and Khayelitsha respectively. One caveat is important to note, however. Due to clientelism’s illegal nature, intuitively, there is a tendency among survey respondents to under-report its prevalence as well as their true preferences with regards to clientelism or clientelistic practices (Gallego&Wantchekon, 2012:2). This makes measuring clientelism with accuracy difficult, and a certain degree of measurement error is to be expected (Gallego&Wantchekon, 2012:11).
5
Table 1: Clientelism Dummy Variables – Pooled Sample
Yes No Total
Inequality Problem? 1,480
(91.75%) 133 (8.25%) 1,613 Support Basic Income Grant? 954
(61.15%) 606 (38.85%) 1,560 Gifts Accept? 605 (45.63%) 721 (54.37%) 1,326 Gifts Oblige? 167 (10.36%) 1,445 (89.64%) 1,612 Government Wasteful? 1,074 (72.23%) 413 (27.77%) 1,487 Table 1A: Clientelism Dummy Variables – Khayelitsha Sample
Yes No Total
Inequality Problem? 1,092
(91.53%) 101 (8.47%) 1,193 Support Basic Income Grant? 664
(56.75%) 506 (43.25%) 1,170 Gifts Accept? 442 (48.57%) 468 (51.43%) 910 Gifts Oblige? 106 (8.90%) 1,085 (91.10%) 1,191 Government Wasteful? 687 (63.91%) 388 (36.09%) 1,075 Table 1B: Clientelism Dummy Variables – Delft Sample
Yes No Total
Inequality Problem? 388
(92.38%) 32 (7.62%) 420 Support Basic Income Grant? 290
(74.36%) 100 (25.64%) 390 Gifts Accept? 163 (39.18%) 253 (60.82%) 416 Gifts Oblige? 61 (14.49%) 360 (85.51%) 421 Government Wasteful? 387 (93.93%) 25 (6.07%) 412
Finally, when participants were asked whether they believed government is wasteful or careful with money, the responses differed once again across townships, with around 30% more respondents in Delft compared to those in Khayelitsha seeing government as wasteful.
Table 2 shows the breakdown of political party most strongly identified with both according to township and as a pooling of the two samples. The three most popular parties are the ANC, the DA and the Economic Freedom Fighters (EFF), although a not insignificant portion of respondents indicated that they did not identify strongly with any of the parties. Also clear from Table 2 is the broad support that the ANC enjoys in Khayelitsha, while the DA is the political party most identified with in Delft. Given the aforementioned survey design and racial makeup of the townships, the table supports Southern’s (2011:297) observations that politics in South Africa remains defined according to racial identity. In order to simplify the analysis, individuals indicating support for parties other than the ANC, the DA or the EFF were collated in order to form one category designated as “Other”. Individuals not indicating identification with any party
6
were also kept for the purpose of the analysis given that they form a not insignificant portion of the sample. As such, the variable is a categorical variable with four categories.
Table 2: Political Party Affiliation Political Party Most
Identified With Delft Khayelitsha Total
ANC 18 (4.99%) 900 (79.44%) 918 (61.45%) DA 265 (73.41%) 60 (5.30%) 325 (21.75%) EFF 1 (0.28%) 54 (4.77%) 55 (3.68%) Other 8 (2.22%) 29 (2.56%) 37 (2.48%) None 69 (19.11%) 90 (7.94%) 159 (10.64%) Total 361 1,133 1,494
The final variable of interest asked respondents whether wealthy households should be taxed more, less or the same. Table 3 illustrates that overall the majority of respondents in both townships believe the current level of taxation for the rich is adequate. However, in Delft, 37% of individuals surveyed believed that the rich could be taxed more as opposed to just below 18% of individuals in Khayelitsha.
Table 3: Perception of Level of Taxation for Wealthy Individuals Level of Taxation for
Wealthy Individuals Delft Khayelitsha Total
Less 33 (8.57%) 249 (24.25%) 282 (19.97%) Same 208 (54.03%) 596 (58.03%) 804 (56.94%) More 144 (37.04%) 182 (17.72%) 326 (23.09%) Total 385 1,027 1,412
Empirical Analysis
The tables in this section present the results of probit models using both clientelism variables and redistribution variables as dependent variables. Also included are various perceptions about government that survey respondents were asked about. All four tables include models run for the two townships individually as well as the pooled sample. The independent variables controlled for are the same in Tables 4 and 5. The first table – Table 4 – shows the results of a probit model of “Inequality Problem” on these control variables as well the two clientelism variables.
7
Table 4: Perceptions on Gap between Rich and Poor (1) Inequality Problem (2) Inequality Problem (3) Inequality Problem
Delft Khayelitsha Pooled Sample
Is Accepting Gifts Acceptable? 0.000 -0.028* -0.020
(0.007) (0.016) (0.014)
Moral Duty to Vote after Receiving
Gift? 0.011 (0.008) 0.019 (0.021) 0.024 (0.016)
Government Wasteful? 0.066*
(0.040) 0.013 (0.016) 0.027* (0.016) Perceived Circumstances in 5 Years?
Better Base Category
Same 0.009 -0.054 -0.031
(0.008) (0.035) (0.027)
Worse 0.011 0.038** 0.032**
(0.007) (0.016) (0.013)
Frequency of Trust in Government:
Never Base Category
Sometimes -0.001 0.021 0.013 (0.007) (0.021) (0.016) Mostly 0.013 0.058*** 0.054*** (0.008) (0.012) (0.010) Always – 0.030 0.030* (0.018) (0.016)
Government vs. Individual Responsibility:
1 (Government) Base Category
2 – -0.964*** -0.940*** (0.025) (0.031) 3 -0.996*** -0.972*** -0.967*** (0.004) (0.009) (0.007) 4 -0.996*** -0.969*** -0.968*** (0.004) (0.007) (0.007) 5 -0.933*** -0.915*** -0.895*** (0.100) (0.038) (0.030) 6 -0.994*** -0.968*** -0.964*** (0.012) (0.012) (0.014) 7 -0.999*** -0.972*** -0.977*** (0.002) (0.006) (0.005) 8 -0.999*** -0.982*** -0.980*** (0.002) (0.005) (0.004) 9 -0.997*** -0.974*** -0.972*** (0.003) (0.006) (0.006) 10 (Individual) – -0.965*** -0.960*** (0.007) (0.008)
Income Gap Could be Smaller? -0.000
8 Political Affiliation:
ANC Base Category
DA -0.128*** 0.021 0.000 (0.047) (0.021) (0.022) EFF – 0.049*** 0.044*** (0.013) (0.014) Other -0.994*** 0.003 (0.006) (0.041) None -0.986*** -0.007 0.007 (0.020) (0.032) (0.025)
Better off than Parents? -0.006
(0.007) 0.038* (0.020) 0.021 (0.016) Age 0.000 0.002* 0.001** (0.000) (0.001) (0.001) Female 0.015 -0.015 -0.010 (0.013) (0.018) (0.015) Education in Years 0.003* 0.001 0.003 (0.002) (0.004) (0.003) Marital Status:
Married Base Category
Never Married -0.010 -0.008 -0.008 (0.016) (0.021) (0.018) Partnered 0.002 0.043** 0.040*** (0.014) (0.017) (0.015) Separated/Divorced -0.040 0.011 -0.020 (0.034) (0.034) (0.033) Widow/Widower -0.015 -0.014 -0.021 (0.028) (0.050) (0.040) Earns Salary 0.016 0.001 0.008 (0.010) (0.017) (0.014) Grant Recipient -0.009 -0.019 -0.016 (0.010) (0.019) (0.016) Lives in Khayelitsha -0.003 (0.021) Observations 246 658 938 Pseudo R2 0.341 0.141 0.112
Marginal effects. Standard errors are contained in parentheses. * p<0.10, ** p<0.05, *** p<0.010
It does not appear that the clientelism variables significantly affect the perception of inequality in South Africa being problematic. Thus a potential factor underlying the preference for redistribution – that inequality is perceived as a problem – does not depend on the perception of or attitude towards clientelistic practices. Nonetheless, as noted previously, the demand for redistribution through policy implementation is surprisingly low in South Africa. Interestingly, political affiliation appears to play a significant role in perceptions on inequality. In particular, identifying with the EFF in both Khayelitsha and the pooled sample will mean that a respondent is almost 5% more likely to perceive inequality as a problem in South Africa, when using the ANC as a base category. This may be as a result of the EFF’s mobilisation in favour of land redistribution and other policies it advocates (Pellicer et al., forthcoming). The exact causality of this relationship is not known, since an individual may perceive inequality as a problem as a result of their support for the EFF, or may identify with the EFF because of its proposed policies in a
9
response to the existing perception. This effect was not possible to estimate for Delft due to only one observation of support for the EFF in the Delft sub-sample.
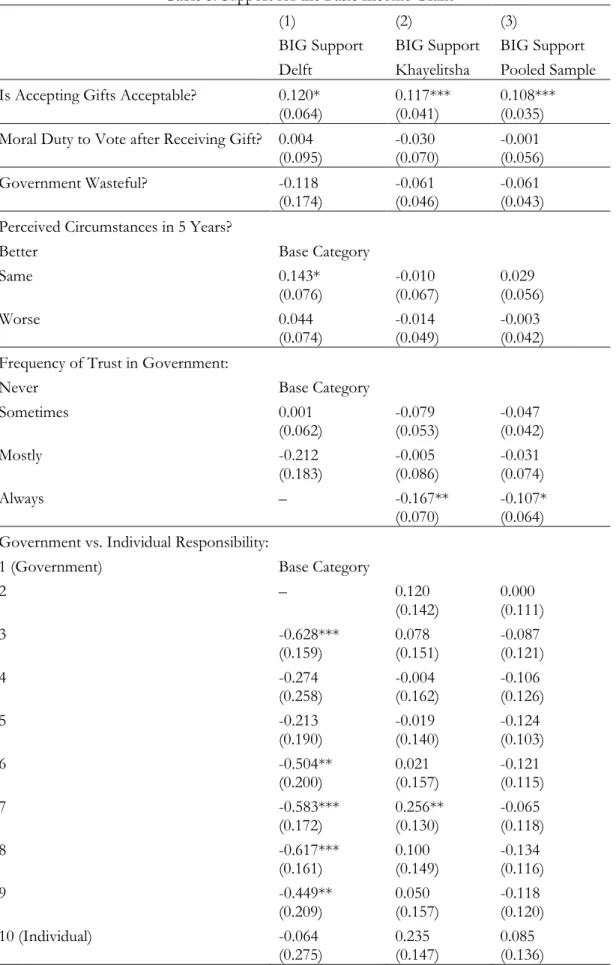
Table 5: Support for the Basic Income Grant (1) BIG Support (2) BIG Support (3) BIG Support Delft Khayelitsha Pooled Sample Is Accepting Gifts Acceptable? 0.120* 0.117*** 0.108***
(0.064) (0.041) (0.035)
Moral Duty to Vote after Receiving Gift? 0.004 -0.030 -0.001
(0.095) (0.070) (0.056)
Government Wasteful? -0.118 -0.061 -0.061
(0.174) (0.046) (0.043)
Perceived Circumstances in 5 Years?
Better Base Category
Same 0.143* -0.010 0.029
(0.076) (0.067) (0.056)
Worse 0.044 -0.014 -0.003
(0.074) (0.049) (0.042)
Frequency of Trust in Government:
Never Base Category
Sometimes 0.001 -0.079 -0.047 (0.062) (0.053) (0.042) Mostly -0.212 -0.005 -0.031 (0.183) (0.086) (0.074) Always – -0.167** -0.107* (0.070) (0.064) Government vs. Individual Responsibility:
1 (Government) Base Category
2 – 0.120 0.000 (0.142) (0.111) 3 -0.628*** 0.078 -0.087 (0.159) (0.151) (0.121) 4 -0.274 -0.004 -0.106 (0.258) (0.162) (0.126) 5 -0.213 -0.019 -0.124 (0.190) (0.140) (0.103) 6 -0.504** 0.021 -0.121 (0.200) (0.157) (0.115) 7 -0.583*** 0.256** -0.065 (0.172) (0.130) (0.118) 8 -0.617*** 0.100 -0.134 (0.161) (0.149) (0.116) 9 -0.449** 0.050 -0.118 (0.209) (0.157) (0.120) 10 (Individual) -0.064 0.235 0.085 (0.275) (0.147) (0.136)
10 Income Gap Could be Smaller? -0.034
(0.063) 0.043 (0.041) 0.032 (0.035) Political Affiliation:
ANC Base Category
DA -0.086 -0.045 -0.007 (0.141) (0.078) (0.060) EFF – 0.242*** 0.220*** (0.082) (0.072) Other -0.167 0.046 0.035 (0.304) (0.151) (0.119) None -0.325 -0.045 -0.070 (0.216) (0.080) (0.066)
Better off than Parents? 0.012 -0.115** -0.078**
(0.068) (0.046) (0.038) Age -0.003 0.000 -0.000 (0.003) (0.002) (0.002) Female 0.117* -0.057 -0.014 (0.069) (0.047) (0.039) Education in Years 0.009 -0.007 -0.000 (0.015) (0.009) (0.008) Marital Status:
Married Base Category
Never Married -0.031 0.027 0.031 (0.081) (0.054) (0.045) Partnered -0.040 -0.049 -0.036 (0.133) (0.099) (0.079) Separated/Divorced 0.050 0.001 0.016 (0.090) (0.093) (0.071) Widow/Widower 0.105 -0.054 0.020 (0.101) (0.099) (0.082) Earns Salary -0.053 -0.004 -0.005 (0.073) (0.046) (0.038) Grant Recipient -0.097 0.041 0.014 (0.081) (0.048) (0.040) Lives in Khayelitsha -0.273*** (0.052) Observations 231 664 910 Pseudo R2 0.139 0.058 0.064
Marginal effects. Standard errors are contained in parentheses. * p<0.10, ** p<0.05, *** p<0.010
Table 5 shows a probit model of support for the BIG on the same set of control variables as used in Table 4. The acceptance of gift receipt from a politician has a significant and positive effect on the support for the introduction of the BIG, with individuals accepting the practice being around 11% more likely to support the introduction of the BIG, all else equal. The reason underlying this may be that individuals prepared to receive a gift from a politician may simply have a preference for receiving a grant for no reason. Support for the grant also tends be lower in Khayelitsha than in Delft, with a Khayelitsha resident comparable to a Delft resident being 27% less likely to support the BIG. Finally, political affiliation with the EFF once again has a very significant positive effect on support for the BIG, when using the ANC as a base category.
11
Again, this may be the result of the policies proposed by the EFF or the type of individual willing to lend support to the party.
Table 6 shows the determinants of the perception that gift acceptance from a politician is acceptable. Interestingly, the redistribution variables other than the level of taxation for wealthy individuals are all revealed to be significant. The results suggest that the perceived adequate level of taxation for the wealthy does not impact on clientelism, and perceptions on clientelistic practices also do not affect such a measure for redistributive preferences. What is interesting is the large and significant effect that moral obligation to vote following the receipt of a gift has on the acceptability of gift receipt. The effect is much stronger in Delft than in Khayelitsha both in size and statistical significance. Presumably, a subset of individuals feeling a moral obligation to vote following the receipt of a gift may also view the practice of accepting gifts as acceptable. However, the correlation between the two variables, while positive, at 0.03 is small. Political affiliation also has an effect. Intuitively, not identifying with a political party – compared to the ANC as a base category – has a negative effect on the probability that an individual is observed to perceive the receipt of gifts as acceptable, possibly due to the individual being less politicised and therefore unwilling to engage in clientelistic practices or view them as acceptable. BIG support has a positive effect on gift acceptance, supporting the finding in the previous table that a relationship exists between the two variables. The exact causal pathway between them, however, remains unknown. Finally, residents in Khayelitsha are more likely to deem the practice as acceptable than residents in Delft.
Table 6: Determinants of Gift Acceptance (1) Gifts Acceptable (2) Gifts Acceptable (3) Gifts Acceptable
Delft Khayelitsha Pooled Sample
Moral Duty to Vote after Receiving Gift? 0.311*** 0.120* 0.166***
(0.110) (0.069) (0.056)
Inequality Problem? -0.142 -0.132* -0.117*
(0.129) (0.069) (0.061)
Supports BIG 0.158** 0.124*** 0.126***
(0.074) (0.042) (0.036)
Rich People Should be Taxed:
Less Base Category
Same 0.087 0.004 0.026 (0.116) (0.052) (0.047) More -0.028 0.072 0.012 (0.128) (0.066) (0.057) Government Wasteful? -0.148 -0.068 -0.075* (0.159) (0.047) (0.044)
Perceived Circumstances in 5 Years?
Better Base Category
Same -0.017 0.027 0.025
(0.121) (0.065) (0.058)
Worse 0.034 -0.000 0.015
(0.099) (0.051) (0.045)
Frequency of Trust in Government:
Never Base Category
Sometimes 0.011 0.056 0.049
12
Mostly 0.104 0.104 0.086
(0.149) (0.086) (0.074)
Always 0.568*** 0.078 0.079
(0.169) (0.073) (0.067)
Government vs. Individual Responsibility:
1 (Government) Base Category
2 -0.105 -0.364*** -0.214** (0.156) (0.127) (0.100) 3 -0.146 -0.269* -0.148 (0.174) (0.150) (0.113) 4 -0.144 -0.301** -0.185* (0.154) (0.140) (0.110) 5 -0.296** -0.363** -0.247** (0.116) (0.149) (0.101) 6 0.110 -0.396*** -0.148 (0.186) (0.105) (0.108) 7 -0.006 -0.240 -0.085 (0.169) (0.159) (0.116) 8 0.013 -0.419*** -0.246** (0.193) (0.099) (0.097) 9 -0.169 -0.319** -0.225** (0.133) (0.135) (0.100) 10 (Individual) -0.428*** -0.346*** (0.085) (0.078)
Income gap could be smaller? 0.025 -0.025 -0.042
(0.073) (0.043) (0.036)
Political Affiliation:
ANC Base Category
DA 0.020 0.076 0.074 (0.152) (0.077) (0.064) EFF – 0.138 0.180** (0.089) (0.087) Other -0.110 0.047 0.050 (0.173) (0.144) (0.127) None -0.187 -0.187** -0.189*** (0.143) (0.076) (0.062)
Better off than Parents? 0.118 0.091* 0.106***
(0.080) (0.048) (0.041) Age 0.001 -0.001 -0.001 (0.003) (0.002) (0.002) Female 0.062 -0.057 -0.030 (0.080) (0.047) (0.040) Education in Years 0.023 -0.013 -0.006 (0.016) (0.010) (0.008) Marital Status:
Married Base Category
13 (0.084) (0.053) (0.046) Partnered 0.197 -0.220** -0.040 (0.157) (0.090) (0.081) Separated/Divorced -0.170** 0.027 -0.033 (0.079) (0.100) (0.073) Widow/Widower -0.260*** -0.001 -0.053 (0.082) (0.101) (0.082) Earns Salary 0.105 -0.025 0.016 (0.079) (0.047) (0.040) Grant Recipient 0.084 -0.061 -0.047 (0.087) (0.049) (0.042) Lives in Khayelitsha 0.227*** (0.061) Observations 220 648 874 Pseudo R2 0.245 0.070 0.077
Marginal effects. Standard errors are contained in parentheses. * p<0.10, ** p<0.05, *** p<0.010
The final table included here – Table 7 – is analogous to the previous regression, though the dependent variable is whether or not individuals believe they have a moral obligation to vote following the receipt of a gift. The acceptance of gifts has a relatively small but significant positive effect in the pooled sample. The effect is much larger in Delft than in Khayelitsha. Residents in Delft also exhibit a higher incidence of moral obligation to vote following the receipt of a gift than residents in Khayelitsha. One possible interpretation of this is that individuals in Delft – having been born in the Western Cape – may feel more of an obligation towards local politicians than individuals in Khayelitsha – many of which have migrated from the Eastern Cape Province (see Table A2 in the Appendix). This may be as a result of the iterative element of clientelism (Hicken, 2011:292-293) previously discussed. Once again, political affiliation appears significant in Delft, with affiliation to the DA having a large and very significant effect relative to affiliation to the ANC. Few of the other factors controlled for in the model seem to affect the perceived moral obligation to vote, even when increasing the sample size by pooling the observations from the two townships.
Table 7: Determinants of Voter Obligation (1)
Gifts Oblige (2) Gifts Oblige (3) Gifts Oblige Delft Khayelitsha Pooled Sample
Is Accepting Gifts Acceptable? 0.153** 0.027* 0.060***
(0.060) (0.016) (0.020)
Inequality Problem? 0.004 0.020 0.036
(0.065) (0.025) (0.026)
Supports BIG 0.010 -0.010 -0.008
(0.048) (0.017) (0.019)
Rich People Should be Taxed:
Less Base Category
Same 0.008 0.004 -0.004 (0.069) (0.024) (0.027) More -0.010 0.047 0.024 (0.073) (0.039) (0.035) Government Wasteful? -0.076 -0.017 -0.017 (0.092) (0.020) (0.024)
14 Perceived Circumstances in 5 Years?
Better Base Category
Same 0.223 -0.049*** -0.011
(0.136) (0.017) (0.029)
Worse -0.004 -0.016 -0.009
(0.049) (0.019) (0.023)
Frequency of Trust in Government:
Never Base Category
Sometimes 0.069* -0.025 0.004 (0.039) (0.024) (0.024) Mostly -0.007 0.020 0.027 (0.090) (0.042) (0.045) Always – -0.004 0.027 (0.028) (0.040) Government vs. Individual Responsibility:
1 (Government) Base Category
2 -0.048 0.952*** 0.190 (0.072) (0.016) (0.135) 3 0.234 0.922*** 0.132 (0.283) (0.032) (0.135) 4 0.013 0.930*** 0.103 (0.148) (0.024) (0.130) 5 0.089 0.742*** 0.120 (0.131) (0.055) (0.087) 6 -0.000 0.868*** 0.031 (0.114) (0.078) (0.092) 7 0.017 0.939*** 0.107 (0.119) (0.020) (0.122) 8 0.053 0.935*** 0.123 (0.151) (0.023) (0.127) 9 0.219 0.960*** 0.306* (0.246) (0.007) (0.172) 10 (Individual) 0.560* 0.917*** 0.247 (0.333) (0.037) (0.189)
Income gap could be smaller? 0.025 0.024 0.026
(0.034) (0.019) (0.019)
Political Affiliation:
ANC Base Category
DA 0.369*** 0.031 0.038 (0.073) (0.040) (0.037) EFF – -0.031 -0.036 (0.026) (0.037) Other – None 0.973*** -0.038* -0.019 (0.030) (0.021) (0.031)
Better off than Parents? -0.084* -0.025 -0.035
15 Age 0.001 -0.001 -0.000 (0.002) (0.001) (0.001) Female 0.057* -0.015 -0.005 (0.035) (0.021) (0.021) Education in Years -0.001 -0.005 -0.002 (0.009) (0.004) (0.004) Marital Status:
Married Base Category
Never Married -0.003 -0.000 0.002 (0.051) (0.021) (0.023) Partnered -0.047 -0.031 -0.031 (0.046) (0.029) (0.036) Separated/Divorced – 0.028 -0.030 (0.049) (0.031) Widow/Widower 0.089 0.008 0.055 (0.118) (0.045) (0.054) Earns Salary 0.044 -0.007 -0.015 (0.044) (0.019) (0.020) Grant Recipient 0.057 0.012 0.023 (0.054) (0.021) (0.023) Lives in Khayelitsha -0.062 (0.043) Observations 191 635 855 Pseudo R2 0.221 0.099 0.085
Marginal effects. Standard errors are contained in parentheses. * p<0.10, ** p<0.05, *** p<0.010
Conclusion
The results presented here point towards a relationship betweenredistributive preferences and clientelistic practices and perceptions on clientelism. In particular, political affiliation is found to impact significantly on clientelistic preferences or perceptions as well as attitudes towards redistributive preferences – with affiliation to the EFF generally found to increase preferences for redistribution and perception of the acceptability of gift acceptance. However, further study is required if the precise nature of these relationships is to be determined, and the newly collected data resulting from this study will prove very useful to the local research community.
References
Du Toit, A., &Neves, D. 2007. In Search of South Africa's "Second Economy".Africanus , 37 (2), 145-174.
Hicken, A. 2011. Clientelism. Annual Review of Political Science , 14, 289-310.
Gallego, J., &Wantchekon, L. 2012. Experiments on Clientelism and Vote-Buying.Research in
Experimental Economics, 15, 177-212.
Poverty in South Africa. A Southern Africa Labour and Development Research Unit Working Paper Number 64. Cape Town: SALDRU, University of Cape Town
Nleya, N., & Thompson, L. (2009). Survey Methodology in Violence-prone Khayelitsha, Cape Town, South Africa. IDS Bulletin , 40 (3), 50-57.
Pellicer, M., Piraino, P., & Wegner, E. 2014. The Role of Information and Mobilization for Redistributive Preferences: A Survey Experiment in South Africa. GIGA Hamburg and SALDRU, University of Cape Town
16
Southern, N. 2011. Political Opposition and the Challenges of a Dominant Party System: The Democratic Alliance in South Africa. Journal of Contemporary African Studies , 29 (3), 281-298. Statistics South Africa.2013a, July.2011 Census Suburb Delft. Available: https://www.capetown.gov.za/en/stats/2011CensusSuburbs/2011_Census_CT_Suburb_ Delft_Profile.pdf [2014, October 3]
Statistics South Africa.2013b, July.2011 Census Suburb Khayelitsha. Available: https://www.capetown.gov.za/en/stats/2011CensusSuburbs/2011_Census_CT_Suburb_ Khayelitsha_Profile.pdf [2014, October 3]
Turok, I. 2001. Persistent Polarisation Post-Apartheid? Progress Towards Urban Integration in Cape Town. Urban Studies , 38 (13), 2349-2377.
17
A
PPENDIX
This appendix contains a model for the perceived adequate level of taxation on the wealthy. An ordered probit model was used given that respondents could answer whether they believed the wealth should be taxed less, more or the same. From the analysis in the main text, the perceived level of taxation does not appear to have an effect on clientelistic preferences. Table A1 indicates that clientelistic preferences do not have an effect on the perceived adequate level of taxation of the wealthy. Table A2 contains summary statistics of the province of birth for individuals in both townships as well as for the pooled sample. As is clear, the large majority of respondents in Delft were born in the Western Cape, while the majority of respondents living in Khayelitsha were born in the Eastern Cape.
Table A1: Perceptions on the Level of Taxation for the Rich
(1) (2) (3)
Delft Khayelitsha Pooled Sample
Is Accepting Gifts Acceptable? -0.103 0.087 0.002
(0.182) (0.092) (0.080)
Moral Duty to Vote after Receiving Gift? -0.090
(0.296) 0.234 (0.169) 0.110 (0.141)
Government Wasteful? -0.263 -0.023 -0.058
(0.434) (0.100) (0.096)
Perceived Circumstances in 5 Years?
Better Base Category
Same -0.232 0.369*** 0.219*
(0.337) (0.142) (0.130)
Worse -0.526** 0.166 -0.006
(0.249) (0.113) (0.102)
Frequency of Trust in Government:
Sometimes -0.294* -0.013 -0.137 (0.172) (0.128) (0.099) Mostly -0.716* -0.220 -0.350** (0.367) (0.186) (0.155) Always -0.157 -0.047 -0.175 (0.837) (0.159) (0.143)
Government vs. Individual Responsibility:
1 (Government) Base Category
2 0.440 0.650* 0.686** (0.548) (0.336) (0.272) 3 1.764*** 0.783** 0.914*** (0.573) (0.343) (0.281) 4 0.857 0.222 0.387 (0.545) (0.359) (0.291) 5 0.725 0.584* 0.638** (0.448) (0.314) (0.250) 6 0.504 0.236 0.255 (0.468) (0.358) (0.274) 7 0.346 -0.331 -0.050 (0.444) (0.348) (0.267) 8 0.381 0.118 0.150 (0.464) (0.356) (0.277)
18
9 0.509 0.228 0.302
(0.463) (0.346) (0.275)
10 (Individual) 0.470 0.006 0.121
(0.711) (0.445) (0.365)
Income gap could be smaller? 0.123
(0.170) -0.135 (0.094) -0.073 (0.080) Political Affiliation:
ANC Base Category
DA 0.305 0.084 0.075 (0.257) (0.167) (0.131) EFF 5.783*** 0.094 0.137 (0.389) (0.219) (0.210) Other -0.038 0.227 0.012 (0.476) (0.344) (0.271) None 0.529 0.220 0.231 (0.335) (0.194) (0.156)
Better off than Parents? -0.448** 0.047 -0.086
(0.200) (0.109) (0.092) Age -0.008 -0.009** -0.009** (0.008) (0.005) (0.004) Female -0.195 -0.032 -0.062 (0.181) (0.107) (0.090) Education in Years -0.031 -0.014 -0.023 (0.039) (0.020) (0.017) Marital Status:
Married Base Category
Never Married -0.463** 0.070 -0.085 (0.226) (0.116) (0.099) Partnered -0.525* 0.378* 0.035 (0.296) (0.198) (0.167) Separated/Divorced -0.245 0.218 0.073 (0.267) (0.189) (0.147) Widow/Widower 0.154 0.373 0.292 (0.362) (0.229) (0.186) Earns Salary -0.177 0.122 0.016 (0.186) (0.103) (0.087) Grant Recipient -0.255 0.043 -0.027 (0.214) (0.109) (0.095) Lives in Khayelitsha -0.676*** (0.134) Ancillary Parameters: Cut 1 -2.843 -0.656 -1.854 (1.051) (0.506) (0.422) Cut 2 -0.924 1.127 -0.097 (1.047) (0.505) (0.418) Observations 244 662 906 Pseudo R2 0.118 0.056 0.068 * p<0.10, ** p<0.05, *** p<0.010
19 Table A2: Province of Birth by Township
Province Delft Khayelitsha Total
Eastern Cape 13 (3.00%) 891 (73.64%) 904 (54.99%) Western Cape 412 (94.93%) 252 (20.83%) 664 (40.39%) Other 9 (2.07%) 67 (5.54%) 76 (4.62%) Total 434 1,210 1,644
Note: “Other” includes both individuals born in other South African provinces as well as individuals born outside of South Africa. Column percentages are in parentheses.
Scientific Coordinator : Xavier Oudin (oudin@ird.pdr.fr) Project Manager : Delia Visan (delia.visan@ird.fr)
Find more on www.nopoor.eu Visit us on Facebook, Twitter and LinkedIn