Publisher’s version / Version de l'éditeur:
Vous avez des questions? Nous pouvons vous aider. Pour communiquer directement avec un auteur, consultez la première page de la revue dans laquelle son article a été publié afin de trouver ses coordonnées. Si vous n’arrivez pas à les repérer, communiquez avec nous à PublicationsArchive-ArchivesPublications@nrc-cnrc.gc.ca.
Questions? Contact the NRC Publications Archive team at
PublicationsArchive-ArchivesPublications@nrc-cnrc.gc.ca. If you wish to email the authors directly, please see the first page of the publication for their contact information.
https://publications-cnrc.canada.ca/fra/droits
L’accès à ce site Web et l’utilisation de son contenu sont assujettis aux conditions présentées dans le site LISEZ CES CONDITIONS ATTENTIVEMENT AVANT D’UTILISER CE SITE WEB.
The 4th International Building Physics Conference [Proceedings], pp. 1-8, 2009-06-15
READ THESE TERMS AND CONDITIONS CAREFULLY BEFORE USING THIS WEBSITE. https://nrc-publications.canada.ca/eng/copyright
NRC Publications Archive Record / Notice des Archives des publications du CNRC :
https://nrc-publications.canada.ca/eng/view/object/?id=dfd6fa54-efc7-4388-b4a9-576229a731cd https://publications-cnrc.canada.ca/fra/voir/objet/?id=dfd6fa54-efc7-4388-b4a9-576229a731cd
NRC Publications Archive
Archives des publications du CNRC
This publication could be one of several versions: author’s original, accepted manuscript or the publisher’s version. / La version de cette publication peut être l’une des suivantes : la version prépublication de l’auteur, la version acceptée du manuscrit ou la version de l’éditeur.
Access and use of this website and the material on it are subject to the Terms and Conditions set forth at
Energy rating of polyurethane spray foamed walls: procedures and preliminary results
http://irc.nrc-cnrc.gc.ca
Ene rgy rat ing of polyure t ha ne spra y foa m e d
w a lls: proc e dure s a nd pre lim ina r y re sult s
N R C C - 5 0 8 5 7
E l m a h d y , A . H . ; M a r e f , W . ; S w i n t o n , M . C . ; T a r i k u , F .
J u n e 2 0 0 9
A version of this document is published in / Une version de ce document se trouve dans:
4th International Building Physics Conference, Istanbul, Turkey, June 15-18, 2009, pp. 1-8
The material in this document is covered by the provisions of the Copyright Act, by Canadian laws, policies, regulations and international agreements. Such provisions serve to identify the information source and, in specific instances, to prohibit reproduction of materials without written permission. For more information visit http://laws.justice.gc.ca/en/showtdm/cs/C-42
Les renseignements dans ce document sont protégés par la Loi sur le droit d'auteur, par les lois, les politiques et les règlements du Canada et des accords internationaux. Ces dispositions permettent d'identifier la source de l'information et, dans certains cas, d'interdire la copie de documents sans permission écrite. Pour obtenir de plus amples renseignements : http://lois.justice.gc.ca/fr/showtdm/cs/C-42
Energy rating of polyurethane spray foamed walls: procedures and
preliminary results
A.H. Elmahdy, W. Maref, M. C. Swinton & F. Tariku
Institute for Research in Construction, National Research Council of Canada, Ottawa, Ontario, Canada
ABSTRACT: Spray polyurethane foam (SPF) insulation is used in buildings to provide a durable and effi-cient thermal barrier. In addition to its thermal insulation property, it is claimed to provide an effective air barrier system. A joint research project between NRC-IRC and a consortium of SPF manufacturers and con-tractors was conducted to develop thermal and air barrier characteristics as well as a wall energy rating (WER) system for SPF walls.
Experimental and analytical work was performed to determine the WER of SPF walls. The experimental part included air leakage and thermal transmission (R-value) tests to determine the wall air leakage rate at differ-ent conditions (e.g., ∆P= 50, 75, 100 Pa) and the R-value at different temperature differences, (e.g., ∆T= 40 and 55 K). An analytical method was also developed to calculate WER by combining the heat loss due to thermal transmission by conduction and that due to air leakage.
Ten conventional wood stud walls (i.e., 2” by 6” studs), 2.4 m by 2.4 m (nominal size) of different insulation material (e.g. glass fibre batts, and of SPF), some with penetrations were constructed and tested. The testing included: (i)- initial air leakage and thermal resistance; (ii)- the walls were conditioned in the Dynamic Wall Test Facility (DWTF) according to an established routine; (iii)- then they were tested again for air leakage and thermal resistance after conditioning.
This is the first of a series of papers to present the results of this major project. In this paper, an overview of the project, its objectives and the theoretical approach to determine the WER are presented. A description of air leakage and R-value test procedures, wall samples construction and the experimental results of two walls and a sample of the analytical results of the same two walls will also be presented. Future papers will summa-rize the experimental and analytical results of the remaining walls, along with the results of the computer modelling of the air leakage and thermal performance of all the walls tested in this project.
1 INTRODUCTION
The Spray Polyurethane Foam (SPF) industry faces a challenge. On one hand the industry supports re-sponsible use of hydrochlorofluorocarbon (HCFC’s), while, on the other hand, the high performance of SPF in buildings dealing with air, heat and moisture movement results in reduction of greenhouse gas production.
The situation is similar to one existing 12 years ago, when the Canadian and American SPF industry decided to develop better tools enabling the transfer of technology developed with the CFC blown foams to the second generation of blowing agents, namely
HCFC. The research was performed under SPF in-dustry/NRC consortium using an arbitrarily devel-oped foam system “Base 88” (Bomberg & Kumaran, 1989 and Kumaran & Bomberg, 1990). This foam system was used together with a number of different blowing agents to develop accelerated prediction of thermal performance for cellular plastics (foams) in-dependent of the polymeric composition and blow-ing agent used.
Today’s marketplace, however, is focused on the system performance rather than a “drop-in” blowing agent replacement, as it was 12 years ago. This im-plies that a decision on the SPF cost is made in rela-tion to its total performance that includes SPF
con-paper.
Fig schematic showing cross section of WER-1 and
igures 2 and 3 are photos of the two wall assem-tribution to heat, air and moisture aspects not only
on the basis of steady state “R-value”. Therefore, it is important to evaluate total performance of SPF in-sulated walls with the third generation of blowing agents as well as meeting air barrier requirement (as required by building codes bodies).
This paper is one of a series of papers to present the results of a joint research project between the NRC-IRC and SPF producers, contractors and certifying organizations. The main focus of the project is to develop analytical and experimental procedures to determine the energy rating of SPF insulated walls. This would take into account the effect of air leak-age and thermal transmission characteristics of SPF insulated walls. The focus of this paper is on the procedures and some limited results obtained from testing two reference walls: one SFP insulated wall and the other is a glass fiber insulated wall. Other papers in the series will present the results of the other eight walls together with more analytical re-sults and analysis.
2 PROJECT OBJECTIVES
The main objective is to develop experimental and analytical procedures to determine the energy rating of SPF walls. In addition, the foam producers and applicators desired to demonstrate that the use of medium-density foam (when applied properly) could also provide an air barrier system that meets the per-formance requirements given in the Canadian Con-struction Material Centre Guide 07272 (CCMC, 1996).
3 APPROACH
The work in this project consists of both experimen-tal and analytical tasks that would be performed si-multaneously and would feed information back and forth across their boundaries.
3.1 Experimental Tasks
In this task, laboratory testing protocols were devel-oped to characterize the thermal and air leakage characteristics of walls under investigation. This in-cluded: air leakage test, R-value test using guarded hot box apparatus, material thermal characterization (only for foam insulation) using heat flow meter ap-paratus and wall conditioning. A data reduction and calculation method was developed to determine the WER of each wall assembly.
3.2 Analytical task
The advanced NRC-IRC hygrothermal model, hy-gIRC-2D (Karagiozis 1993, Karagiozis; Salonvaara and Kumaran, 1996 and Karagiozis, 1997) is used for thermal analysis of all wall assemblies. The model is capable of analysing transient heat, air and moisture transfer through building envelope compo-nents. However, in this research project its applica-bility is limited to simulating heat and airflow trans-fer.
3.3 Wall sample description
All walls included in this project were built using the conventional 2” by 6” wood stud frame construction. This included reference walls (filled with glass fiber and SPF insulation) and other walls that incorpo-rated penetrations to simulate building components such as windows, electric boxes (indoor and out-door), air vents and plastic pipes, according to the test requirements specified in the CCMC Air Barrier Guide. Figure 1 is a schematic of a cross section of the two walls: glass fiber insulated wall (WER-1) and SPF insulated wall (WER-2) presented in this
OSB Gypsum 12 mm Top plates SPF 6 mil polyethylene WER-1 WER-2 Glass fiber ure 1. A WER-2. F blies.
Fig . A photo of WER-1 (glass fiber insulated wall)
3.4 Wall energy rating calculations
ulations is
per-S
A series of laboratory testing was performed on each of the testing protocol:
cterization (only for the spray ure-g heat flux meter. Data for ure-glass
o walls (reference wall with glass fiber an
, thermal transmission, sample ure 2
The wall energy rating (WER) calc
formed using the experimental results obtained from testing the wall assembly. The procedure to deter-mine WER will be presented later and the results for the two walls reported in this paper will be summa-rized.
Figure 3. A photo of WER-2 (SPF insulated wall)
4 TEST PROCEDURE AND APPARATU
wall assembly. The following is a summary − Air leakage test
− Thermal resistance test (using guarded hot box) − Material chara
thane foam) usin
fiber was obtained from standard database infor-mation (Kumaran et al, 2004).
− Sample conditioning (or weathering) according to the CCMC Air Barrier Guide protocol (CCMC, 1996).
It should be noted that although 10 wall samples were included in this project, only the data and re-sults for tw
d a reference wall with SPF insulations) are re-ported in this paper.
As indicated earlier, a certain testing sequence was followed during this project. The test sequence is as follows: air leakage
conditioning, air leakage and thermal transmission again (after sample conditioning). Figure 4 is an illu-stration of the test sequence followed in this project.
R value in GHB
-Sample conditioning Air leakage test
Air leakage test
R-value in GHB
Figure 4 Illustration of the testing sequence.
Air leakage tests were performed on WER-1 and is in accordance ndard (ASTM, 1997). A special 4.1 Air leakage test
WER-2. The test procedure used with ASTM E283 sta
air leakage test apparatus was designed to test the wall sample (2.4 m by 2.4 m in size). Special con-siderations were taken to minimize the extraneous (system) air leakage in each test. Figure 5 is a sche-matic illustrating the mounting of the wall specimen in the air leakage test apparatus.
Clamp Sealing tape Screws Foam Insulation Gypsum board Air leakage tester Gasket OSB Wall Frame 2”x2” Wood “Grips” WRB
Figure 5. A schematic illustrating the wall mounting in the air akage tester.
The thermal resistance test was performed in the ethod follows that ASTM E1423. Thes
The material characterization was performed accord-004) using the heat
ards through the specimens du
All wall samples were conditioned under wind cyc-ribed in the CCMC Tech-ier Systems for Exterior
n
d at that pressure for
ssure cy
Figure 7 A schematic of the pressure cycle during conditioning.
The following is a summary of the results of air lea-transmission properties, material cha-racterization, simulation and the WER calculation.
The air leakage tests were performed at several pres-sure differentials from ΔP=50 to 150 Pa. Figure 8 le
4.2 Thermal resistance test
e guarded hot box. The test m
scribed in ASTM C1199 and
second, held at that pressure for three seconds and then decreased to zero Pa pressure in one second, followed by a three second dwell at zero Pa pres-sure before the following gust cycle begins. One cycle of negative pressure, where pressure is dri-ven from zero to -1200 Pa (P’3) in one second, held at that pressure for three seconds and then increased to zero Pa pressure in one second. The total time required to carry out this condi-tioning would be about 4 hours 45 minutes.
Figure 7 shows a representation of the pre are well established procedures developed at IRC
and formed the basis of the ASTM test standards (ASTM, 1998-a and ASTM, 1998-b). Figure 6 is a picture of the NRC-IRC guarded hot box apparatus.
Figure 6 A photo of the NRC-IRC guarded hot box apparatus
4.3 Material characterization ing to ASTM C518 (ASTM, 2 flow meter apparatus.
The test specimens were placed horizontally in a 60 cm x 60 cm heat flow meter apparatus. Heat flowed vertically upw
ring the tests.
4.4 Sample conditioning lic and gust loads as desc nical Guide for Air Barr
Walls of Low Rise Buildings (CCMC, 1996). The cyclic wind conditioning consists of, sequentially:
1 1000 cycles of positive pressure, where pressure is driven from zero to 800 Pa (P2) in one second, held at that pressure for three seconds and the decreased to zero Pa pressure in one second, fol-lowed by a three second dwell at zero Pa pressure before repeating the cycle.
2 1000 cycles of 800 Pa (P’2) negative pressure, where pressure is driven from zero Pa pressure to -800 Pa in one second, hel
three seconds and then increased to zero Pa pres-sure in one second, followed by a three second dwell at zero pressure before repeating the cycle. 3 Gust wind conditioning consists of, sequentially
One cycle of positive pressure, where pressure is driven from zero Pa to 1200 Pa (P3) in one
cles and the duration of each cycle for both the cyclic loading and the gust wind.
5 RESULTS
kage, thermal
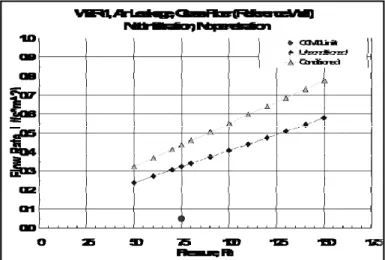
5.1 Summary of air leakage test results of WER-1
shows a summary of the net air leakage test results for WER-1 before and after sample conditioning.
Figure 8 A summary of the air leakage test results of WER-1
ir leakage values reported in this paper are normalized to the standard temperature and pressure
igure 9 presents the air leakage results for W
Figure 9 Air leakage results for WER-2
From Figures 8 and 9, it is clear that WER-2 hows a remarkable decrease in air leakage rate
ar that WER-1 did not meet the CCMC requirement as an air barrier and WER-2 does meet that requirement. It is worth noting that many tests were performed on both walls
to
ommended to standard commit-tee
perature of 20±1°C and a cold side tempera-ture at -20±1°C and -35±1°C. Table 1 provides a
condi-Also shown in Figure 8 is the maximum allowable
air leakage to meet the requirements given in the CCMC Air Barrier Guide (set at 0.05 l/(s.m2) at ΔP=75 Pa). The net air leakage is calculated after subtracting the extraneous (system) air leakage from the total quantity.
sum
All a
conditions (101.325 Pa and 20 °C). F
ER-2. Also shown on Figure 9 is the CCMC air leakage limit (set at 0.05 l/(s.m2) at ΔP=75 Pa).
s
compared to WER-1. It is also cle
perfect the test procedure and minimize the extra-neous (system) air leakage to less than 0.02 l/(s.m2). In fact, latest modifications to the air leakage tester showed zero extraneous air leakage rate when test-ing the rest of wall samples in this project. Full de-tails for the results will be presented in future publi-cations, since they were not available at the proper time for this paper.
It should be noted that WER-1 was built with a 6-mil polyethylene air barrier and was installed in a fashion that was considered representative of the typical field practices. Also, the SPF insulated wall (i.e., WER-2,) was sealed at the top plates. These practices will be rec
to achieve such levels of air tightness in SPF walls.
5.2 Summary of the thermal resistance tests
The thermal resistance (R-value) tests were per-formed before and after sample conditioning at room side tem
mary of the R-value tests before and after tioning for WER-1 and WER-2.
Table 1 R-value for WER-1 and WER-2
Wall Designation R-value, m2.K/W
Before cond. After cond.
Cold side temperature, °C
-20 -35 -20 -35
WER-1 3.24 3.38 3.25 3.44
WER-2 3.60 3.57 3.53 3.50
Table 1 also show of
both walls slightly
m-perature decreases. Surpr c
i-tioning of the walls did not result in considerable change in the walls lue.
), and therefore it was not performed in the laboratory. For the SPF
insu-tion res, s that the t incre hermal resistance te ases as the cold side isingly however, the ond R-va
5.3 Summary of material characterization tests The material characterization for glass fiber wall (WER-1) is available in thermal properties data bases (Kumaran, et al, 2004
lated wall (WER-2), the material characteriza was performed at a number of mean temperatu the results of which are summarized in Table 2.
Ta Summary of the material characterization of the foam in t SPF insulated wall (WER-2)
Mean Temperature Tmean, °C ble 2 he Parameter Symbol units 24.4 24.3 2.5 20.4 24.0 Average thickness mm 97.5 98.2 98.2 98.2 95.0 L Density ρ kg/m3 34.9 34.9 34.9 34.9 35.1 Hot surfa temperatur ce e Th °C 35.3 35.2 19.6 40.4 35.1 Cold sur-face tem- 13.5 13.3 14.6 0.4 12.9 perature Tc °C Tempera-t -e ΔT 21.8 21.9 34.2 40.0 22.2 ure differ nce K Mean tem- Tm 24.4 24.3 2.5 20.4 24.0 perature °C Heat flux W / m2 4.11 4.23 6.46 8.01 . q 4 56 Thermal conduc-q / ΔT W/(m2 • 0.189 0.19 0.19 0.20 0.205 tance C = C K) Thermal r sistance ΔT / q e-R = R m2• K/W 5.30 5.18 5.29 4.99 4.87 Thermal λ W/( K) 0.018 0.019 0.019 0.0197 0.0195 conductivi-ty λ=L/R m• Thermal re-er sistance p unit thick-ness r =R/L r m•K/W 54.4 52.7 53.9 50.9 51.2 5.4 Simul The therm program f atio results
a ances as determined by hygIRC
or the two walls (WER-1 and WER-2) are summarized in Table 3. The results presented in this erature difference of ΔT = °C and cold side at –20 °C)
n
l resist
section are at the temp 40°C (warm side at 20
and ΔP = 0 Pa for both the experimental and simula-tion cases. In addisimula-tion, the apparent R-value was de-termined at ΔP = 0, 75 and 150 Pa for both walls.
Table 3 Experimental and simulation comparison of R-value for WER-1 and WER-2.
RSI , m2.K/W @ ΔT = 40 oC
WALL ID 2 b R-value, RSIwer m2.K/W
Experiment RSIgh Modelling m .K/W ΔP, Pa ΔP, Pa 0 0 75 150 WER 1 3.24 3.29 1.99 1.37 WER 2 3.60 3.58 3.40 3.30
The simulation results need to be analyzed and interpreted based on the following important as-sumpt
a- terial layers are in perfect contact with each other
path is predefined een the studs
mulation and expe-l of the experimentaexpe-l uncertainty, the modeling as-su
ions: The ma
b- Adiabatic (no heat loss) conditions at the pe-rimeters of the wall assembly
c- Airflow
d- Glass fibre insulation completely filled the cavity betw
e- SPF insulation thickness is uniform throughout the stud cavity.
The deviation between the si
rimental results is less than 6%, which is the usually acceptable uncertainty leve
measurement (Elmahdy, 1992). In addition to the ±6% experimental
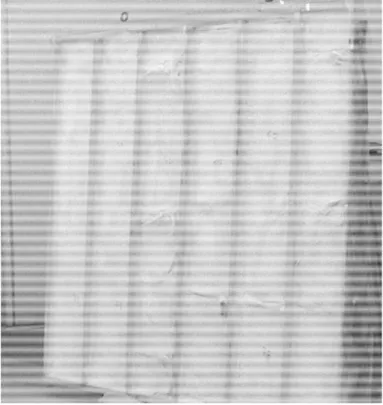
mptions outlined above contributed to the devia-tions of the results. More importantly, the modelling assumption ‘uniform SPF insulation thickness’ might be the primary reason of the differences in WER-2. As shown in Figure 10, the SPF insulation thickness is not uniform in a real wall assembly. Since the actual thickness profile of the SPF insula-tion in the wall assemblies were not available at the time computer simulations were carried out, the SPF insulation thickness was assumed to be 80 mm and uniform throughout the cavity.
Figure 10. A photo showing the non-uniform thickness of the foam
The computer program used (hygIRC-2D) pre-dicts the temperature and air flow fields inside t cavity of the wall. The convection loops inside the cavity (vertical cross section of the SPF insulated wall (WER-2) is shown in Figure 11.
he Wall crossection(m) W a m ) ll he ight ( 0.05 0.1 0.15 0.5 1 1.5 2 T 17.3187 14.8861 12.4535 10.0209 7.588 5.155 -4.57456 36 78 2.72319 0.29061 -2.14197 -7.00714 -9.43972 -11.8723 -14.3049 -16.7375 OSB SPF Air Cavity Gypsum
Figure 11 Convection loops in the air cavity of SPF wall (WER-2).
A similar temperature profile and convection loops for the glass fiber wall (WER-1) is shown in Figure 12. As Figure 11 shows, the SPF insulation provides a good air barrier, where as Figure 12 indi-cates that the glass fiber insulation allows air to flow through any opening, such as the electric box on the right side of the figure.
Wall crossection (m) W a ll he ight (m ) 0.05 0.1 0.15 0.5 1 1.5 2 T 17.3187 14.8861 12.4535 10.0209 7.58836 5.15578 2.72319 0.29061 -2.14197 -4.57456 -7.00714 -9.43972 -11.8723 -14.3049 -16.7375
OSB Fiberglass Gypsum
Figure 12. Convection loops and temperature profile of the glass fiber wall (WER-1).
5.5 WER calculation
The wall energy rating (WER) is determined by combining the heat transmission loss due to air lea-kage and conduction through the wall assembly. The following is a summary of the calculation procedure to determine the WER.
The total heat loss can be expressed as:
con air
WER=Q +Q (1)
air leakage (W); WER=wall energy rating (W).
erimental results, the
quanti-where Qcon=heat loss due to conduction (W);
Qair=heat loss due to
First, using the exp
ties on the right hand side of Equation 1, the RSIwer
could be expressed as:
wer
T
RSI A
Qcon Qair f Qi air
Δ =
+ − (2)
where RSIwer=apparent thermal resistance (RSI)
ac-counting for conduction and air leakage loss as
de-termined from the simulation (m2.K/W) at ΔT =
40°K and ΔP = 75 Pa; f i=factor of interaction.
The factor of interaction (representing the degree of interaction between heat loss terms) is expressed as a fraction, ranging from 0 for no interaction, to an increasing fraction towards 1 for greater interaction.
Equation 2 could be rewritten as:
(
)
(
/ 40 (1 ) 3.6)
wer ghb T RS 75 , i p a p a I A T RSI A f q ρ c T Δ = Δ + − Δ (3)where A=area of the wall sample (5.95 m2);
ΔT=temperature difference (40 °K); RSIghb40
=thermal resistance as determined by the guarded hot box (m2.k/W); qp75=air leakage rate determined
at Δ 2
P = 75 Pa (l/(s.m )); ρa = density of air (1.2 kg/m3); cp a, = specific heat capacity of air (0.279
W.hr/kg.K).
Equation 3 could be simplified and re-written as:
(
)
(
1/ 40 (1 ) 75 1.21)
wer ghb i p RSI RSI + − f q (4) malized) is expressed in a consistent with the Canadian window standarde W 1
=
Finally, the WER (nor form
by adding a constant (set at 50 W/m2) to make all values positive and the final expression for th ER could be expressed as:
50 wer T WER RSI Δ = − (5)
where WER=wall energy rating (W/m ).
The experimental data was used to determine the
2
factor of interaction ( f i) and WER. Table 4
pro-vides a summary of the final results f walls covered by this paper.
or the two
Table 4 Summary of WER calculations for WER-1 and WER-2
Wall ID Meas ured RSI m2.K/ W Meas-ured air leakage rate L/(s.m2) Derived factor of interac-tion f i wer RSI m2.K/ W WER W/m2 WER-1 3.25 0.369 0.56 1.97 29.7 WER-2 3.53 0.013 0.07 3.42 38.3
th
s to confirm their field erformance as an effective air barrier system. The shown that it is possible to rate walls for energy
per-formance o he ka
-racteristic to ensure a high degree of
accuracy in all m ents in order to obtain wall
e a ha d b d to t b ng
c u nt
he results given in Table 4 show that for airtight wa s (e.g. WER-2) there is little interaction between conduction and air leakage streams. On the other
a less tight wall (e.g. WER-1), nteraction between the two com-6 DISCUSSION
The challenges facing e spray polyurethane foam insulation industry prompted development of energy rating of SPF insulated wall
p
information presented in this paper for two walls has based n their t
critical
rmal and air lea ge cha s. It is
easurem
nergy r ting t t coul e use mee uildi
ode req ireme s. T
ll
hand, in the case of there is apparent i
ponents of heat loss. This is demonstrated by com-paring the factor of interaction, f i, of both walls.
It is clear that more examples of demonstrating the performance of walls of different foams and penetration elements (e.g. electric boxes, pipes, air vents, etc.) should be tested and evaluated using the procedures outlined in this paper. This is essential in order to provide conclusive proof of the applicability of the procedures, and use and approval by building designers of code officials. A total of ten walls with different foams and penetrations are being tested and evaluated. Another paper in the series to present more data was submitted to an ASTM symposium (Maref et. al, 2009).
7 CLOSING REMARKS
Experimental and analytical m thods were deve el-oped to determine the energy rating of polyurethane foam insulated walls for the purpose of providing tools to rate the overall thermal performance of SPF insulated walls. The preliminary results from the evaluation of two walls indicated that the methods developed are adequate to differentiate between air-tight and less air-tight walls. The data also showed that for airtight walls, there is not a strong interaction be-tween the heat loss due to air leakage and that due to conduction heat loss. Such interaction increase as the wall becomes more less tight.
In order to generalize the use of this approach, more walls of different configurations and design ing the reported be published in the near
iety for Testing and Materials.
ASTM 1998-b. ASTM E 1423 Practice for Determining the Steady State Thermal Transmittance of Fenestration
Society for Testing and Mate-rials.
. H. 1992. Heat transmission and R-value of fene-stration systems using IRC hot box: procedure and uncer-tainty analysis, ASHRAE Transactions volume 98, part 2,
maran, M.K. "Report on sprayed
polyure-Ku
Ma will be tested and evaluated us
thodology. The results will
future, and a proposal to develop a Canadian stan-dard on the topic will be proposed in the near future.
ACKNOWLEDGEMENT
The authors wish to acknowledge the contribution from: Canadian Urethane Foam Contractors Associ-ation (CUFCA), Honeywell, BASF Canada and Demilec.
REFERENCES
ASTM 1998-a. ASTM C 1199 Test Method for Measuring the Steady State Thermal Transmittance of Fenestration
Sys-ems Using Hot Box Methods, Philadelphia: American So-t
c
tems, Philadelphia: American
ASTM 2004. ASTM C518 Steady-State Thermal Transmission Properties by Means of the Heat Flow Meter Apparatus, Section 4, Volume 04.06, , Philadelphia: American Society for Testing and Materials.
Elmahdy, A
Atlanta, USA. Bomberg, M.T.; Ku
thane foam with alternative blowing agents," CFCs and the Polyurethane Industry : Vol 2 : (A Compilation of Technic-al Publications) pp. 112-128, 1989, (NRCC-31113) (IRC-P-1638)
maran, M.K.; Bomberg, M.T.
Ku "Thermal performance of
sprayed polyurethane foam insulation with alternative blowing agents," Journal of Thermal Insulation, 14, (July), pp. 43-57, July, 1990, (NRCC-32365) (IRC-P-1695) TM 19
AS 97. E-283 Test Method for Rate of Air Leakage
Through Exterior Windows, Curtain Walls and Doors, Philadelphia: American Society for Testing and Materials. maran, M.K., Lackey, J., Normandin, N., van Reenen, D.,
and Tariku, F.,2004. A Thermal Moisture and Transport Property Database for Common Building and Insulating Materials, Final Report, ASHRAE Research Project 1018-RP, Institute for Research in Construction, National Re-search Council, Ottawa, Ontario, Canada.
Canadian Construction Materials Center (CCMC). 1996. Tech-nical Guide for Air Barrier Systems for Exterior Walls of Low-Rise Buildings, Masterformat Section 07272, National Research Council of Canada.
ragiozis
Ka , A.N. 1993. Overview of the 2-D hygrothermal
heat-moisture transport model LATENITE. Internal IRC/BPL Report, IRC/NRC, National Research Council of Canada
ragiozis, A.N.; Salonvaara, M.; Kumaran, M.K. 1996
Ka .
Nu-merical simulation of experimental freeze conditions in glass-fiber insulation. Building Physics in the Nordic Coun-tries, Espoo, Finland, pp. 455-465.
Karagiozis, A.N. 1997. Analysis of the hygrothermal behavior of residential high-rise building components. Client report A-3052, IRC/NRC, National Research Council of Canada ref, W., Elmahdy, A. H.;.; Swinton, M. C.; Tariku, F. 2009.
Experimental and Analytical Assessment of Energy Rating of Polyurethane Spray Foam Walls, Submitted to ASTM Second symposium on heat-air-moisture transport: mea-surements and implications in buildings, Vancouver, Cana-da, April 19-20, 2009