HAL Id: inserm-02906991
https://www.hal.inserm.fr/inserm-02906991
Submitted on 27 Jul 2020
HAL is a multi-disciplinary open access
archive for the deposit and dissemination of
sci-entific research documents, whether they are
pub-lished or not. The documents may come from
teaching and research institutions in France or
abroad, or from public or private research centers.
L’archive ouverte pluridisciplinaire HAL, est
destinée au dépôt et à la diffusion de documents
scientifiques de niveau recherche, publiés ou non,
émanant des établissements d’enseignement et de
recherche français ou étrangers, des laboratoires
publics ou privés.
Analyzing Effect of Edge Computing on Reducing
Webpage Response Time
Noriaki Kamiyama, Yuusuke Nakano, Kohei Shiomoto, Go Hasegawa,
Masayuki Murata, Hideo Miyahara
To cite this version:
Noriaki Kamiyama, Yuusuke Nakano, Kohei Shiomoto, Go Hasegawa, Masayuki Murata, et al..
Ana-lyzing Effect of Edge Computing on Reducing Webpage Response Time. 2016 IEEE Global
Commu-nications Conference (GLOBECOM), Dec 2016, Tokyo, Japan. �10.1109/GLOCOM.2016.7841607�.
�inserm-02906991�
Analyzing Effect of Edge Computing on Reducing
Webpage Response Time
Noriaki Kamiyama, Yuusuke Nakano, Kohei Shiomoto,
Go Hasegawa, Masayuki Murata, and Hideo Miyahara
NTT Network Technology Labs, Tokyo 180-8585, Japan †Cybermedia Center, Osaka University, Osaka 560-0043
‡Department of Information Science, Osaka University, Osaka 565-0871, Japan
Abstract—Modern webpages consist of many rich objects
dynamically produced by servers and client terminals at diverse locations, so we face an increase in web response time. To reduce the time, edge computing, in which dynamic objects are generated and delivered from edge nodes, is effective. For ISPs and CDN providers, it is desirable to estimate the effect of reducing the web response time when introducing edge computing. Therefore, in this paper, we derive a simple formula that estimates the lower bound of the reduction of the response time by modeling flows obtaining objects of webpages. We investigate the effect of edge computing in each webpage category, e.g., News and Sports, using data measured by browsing about 1,000 popular webpages from 12 locations in the world on PlanetLab.
I. INTRODUCTION
In recent years, web browsing has been one of the most popular activities on the Internet. It was reported that 67% of users experienced a long waiting time every week when browsing webpages, and 17% of users would not wait if the time exceeded 5 seconds [6]. In this paper, we define the
web response time as the time spent waiting after clicking
the hyperlink of a webpage until the entire part of the target webpage is shown on the web browser. It was claimed that users expect a page to load in 2 seconds or less and that 40% of them will wait for no more than 3 seconds before leaving a page [11]. It was also reported that a 400-millisecond delay resulted in a 0.74% decrease in searches on the Google search engine [22] and that Amazon increased revenue 1% for every 0.1 second reduction in webpage load time [24]. Users on high-performance pages were 15% more likely to complete purchases and 9% less likely to abandon the pages after viewing only one page [13]. Therefore, for many Internet service providers (ISPs) and content providers, reducing the web response time is an urgent issue that needs to be solved in order to improve the QoE of users and the profit of content providers.
Each webpage consists of a large number of data objects, and objects are transmitted from object servers using HTTP. With traditional webpages, static objects are stored at servers, and web browsers simply download them. Content delivery networks (CDNs), which use a number of cache servers deployed in multiple networks, have been widely used to efficiently transmit web traffic and reduce the response time [13][14][21]. CDNs are effective for delivering static objects because identical data can be used for multiple users. How-
ever, the ratio of dynamic objects generated when executing programs, e.g., Java server pages (JSP) and Servlet, at servers or executing JavaScript, e.g., Ajax and DOM (document object model), at client terminals, has increased recently [4]. CDNs are not effective for delivering dynamic objects because the objects cannot be reused among multiple users in many cases. To deliver dynamic objects to users with small latency, it is effective to generate objects at edge nodes close to users instead of object servers remote from users, and AT&T proposed ACDN based on this concept [17]. A similar concept was also proposed by Akamai by the name of edge computing [5], and Sivasubramanian et al. compared various architectures of edge computing from the viewpoints of data replication techniques and latency [19]. More recently, a similar idea has been also proposed by the name of fog computing [3][25][26]. In this paper, we use the term, edge computing, to represent these techniques. By caching application codes for generating dynamic objects, the same codes can be reused among various users, so we can expect to avoid the delay that is caused in order to obtain the codes from remote servers. However, introducing edge computing brings high cost because ISPs and CDN providers need to provide high processing functions at a large number of edge nodes, and they need to keep the consistency of data among multiple edge nodes. Therefore, it is desirable for ISPs and CDN providers to estimate the expected effect of reducing the web response time in a simple way when introducing edge computing.
Therefore, in this paper, we model the flows of acquiring objects when browsing webpages and derive a simple formula that estimates the lower bound of the reduction of web response time by edge computing. We investigate the effect of edge computing on reducing the web response time in each web category, e.g., News and Sports, on the basis of the data measured by browsing about 1,000 of the most popular webpages from 12 locations in the world using PlanetLab [15]. After briefly summarizing the related works analyzing the web response time in Section II, we derive a simple formula that estimates the effect of edge computing on reducing the web response time in Section III. In Section IV, we describe the experimental configuration using PlanetLab, and we investi- gate the numerical results in Section V. Finally, we conclude this manuscript in Section VI.
II. RELATEDWORKS
Here, we briefly summarize the existing works analyzing the web response time. They can be classified into two groups based on the approach: active measurement and passive mea-surement. In the first approach, the properties of HTTP traffic was analyzed by actively browsing target webpages from single or multiple probing locations. For example, Butkiewicz et al. periodically accessed about 1,700 randomly selected webpages from four probing locations for nine weeks, investi-gated the properties of HTTP traffic including the object count for each webpage and number of servers accessed, and derived a regression formula that estimates the web response time from the measured properties [4]. Although this work clarified the major factors determining the web response time by actively measuring the latency of a large number of webpages, the analysis was limited to evaluating the tendencies of latency, so the effect of reducing the web response time by delivering objects from edge nodes could not be estimated. Sundaresan et al. installed a program called Mirage that acquires only static objects of webpages from a large number of user terminals in the world, and they analyzed the effect of caching static objects in home networks when browsing nine webpages [22]. However, the analysis was limited to a few webpages, and the difference among web categories was not investigated.
The second approach, i.e., passive measurement, analyzes the reduction effect of various techniques on reducing web response time. For example, Tariq et al. proposed WISE, which is used to estimate the effect of various strategies in CDNs, e.g., server selection, server deployment, and capacity increase, on reducing the web response time [23]. In WISE, CDN operators can estimate the effect of these various strate-gies on reducing the web response time by inputting the strategies as what-if scenarios. Wang et al. proposed WProf, a browser plug-in tool modeling the relationship among various functions executed in browsers and measuring the dependen-cies among these functions, and they investigated the major factors affecting the web response time [24]. Although we can estimate the reduction effect of various techniques on reducing web response time by using these methods of passive measurement, the calculation load for estimating the web response time in these methods was high, and exhaustive analysis from many probing locations for many webpages is difficult. He et al. investigated the usage of hosting services in popular many webpages, and they showed that throughput and latency can be improved by dynamically using caches in multiple areas [8]. However, their analysis was limited to the latency and throughput of each object, and the reduction effect on web response time was not evaluated.
III. SIMPLEESTIMATION OFEFFECT OFEDGE
COMPUTING
When viewing webpages, various processes including HTML pursing, object fetching, generation of dynamic ob-jects, generation of a document object model (DOM) tree, and page rendering are executed at the browsers of user terminals [24]. By using edge computing, we can expect to reduce the latency caused in object fetching, i.e., acquiring objects from remote object servers. In this section, we first model the flows of acquiring objects between a user terminal and object
servers, and we derive a formula that estimates the reduction of web response time obtained by edge computing.
A. Modeling Flows of Object Fetching
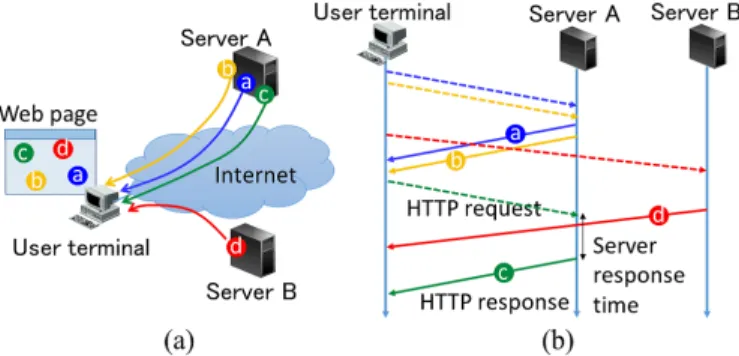
Many modern webpages consist of many data objects, between 40 and 100 [9]. When a user clicks a hyperlink to a target webpage, the web browser first downloads the HTML file from the web server and analyzes the obtained file. Next, the web browser downloads objects embedded in the file by using the HTTP sessions over TCP connections established between the user terminal and object servers as shown in Fig. 1(a)1. Finally, the web browser displays the target webpage by rendering the page by using the obtained data objects [24]. In the example shown in Fig. 1(a), the user terminal obtains three objects from object server A and one object from object server B. To acquire each object, the user terminal sends the HTTP request to the object server, which sends the object to the user terminal as the HTTP response. The server response time, e.g., the processing time for generating dynamic objects by Java Servlet or Java server pages (JSP), occurs between receiving the HTTP request and sending the HTTP response at the object server. Therefore, the latency in obtaining each object consists of one round-trip time (RTT) and the server response time.
To reduce the web response time, many web browsers normally establish multiple TCP connections with each object server and download multiple objects in parallel. However, if web browsers establish too many TCP connections with an identical object server simultaneously, the processing load of object servers seriously increases, so many web browsers limit the maximum number of TCP connections that can be established simultaneously with an identical object server to P [20]. For example, P = 2 is recommended in the HTTP/1.1 specification, P = 4 is used in Safari 3 and Opera 9, and P = 6 is used in Internet Explorer 8 and Firefox 3 [20]. Figure 1(b) shows an example of delivery flows for the object acquisition shown in 1(a) when P = 22. To obtain three objects, the user terminal establishes P = 2 TCP connections with object server A. After obtaining objects a and b in parallel using the two TCP connections, the user terminal fetches object c on the TCP connection which was used to obtain object a. In addition, the user terminal establishes only one TCP connection with object server B because only object d is downloaded from object server B.
B. Deriving Reduction Amount of Web Response Time In this section, we derive a simple formula that estimates the lower bound of the reduction of web response time obtained by edge computing. As mentioned in the previous section, the latency required to obtain objects from each object server s is affected by various factors including the object count obtained from server s, the response time of server s, and the RTT to server s. Moreover, there are dependencies among objects. For example, a browser cannot start downloading objects until the acquisition and generation of other objects are 1When content providers of objects use CDNs, objects will be delivered
from the cache servers of CDNs. When an identical user accesses an identical webpage within a short time frame, no HTTP flows will be generated because objects can be obtained from the local cache of the user terminal.
2For simplicity, we omit the three-way handshaking required to establish
Fig. 1. Example of sequence of object fetching
completed in order to sustain the consistency of the DOM tree [24]. Therefore, we need to consider the dependencies among objects to strictly derive the reduction amount of web response time. However, to derive a simple formula that estimates the lower bound of the reduction amount, we do not consider the dependencies among objects and assume that objects are continuously transmitted on each TCP connection without waiting time at a user terminal.
We define vsas the average response time of object server s, rs as the average RTT between the user terminal and server s, and ξs,q as the number of objects obtained from server s on TCP connection q. Moreover, we define usas the average sending time of each object obtained from server s, i.e., the average object size divided by the average transmission throughput between server s and the user terminal. We assume that the time required at server s in the three-way handshaking for establishing the TCP connection is zero, and we consider only one RTT, rs, for the three-way handshaking. We can obtain ys,q, the total latency required to download objects from server s on TCP connection q, by
ys,q= rs+ ξs,q(rs+ vs+ us). (1) We assume that all TCP connections less than or equal to P with server s are simultaneously established, and the browser starts downloading objects on all the TCP connections at the same time. In this case, the total latency required to obtain all the objects from server s is ys,q∗, where TCP
connection q∗ gives the maximum ξ
s,q among all the TCP connections established with server s. Let Ysdenote the total latency required to acquire all the objects from server s and ms denote the number of objects acquired from server s. Ys is minimized when the deviation of the object count among TCP connections established with server s is minimized, and the maximum number of objects transmitted on each TCP connection with server s is !ms/P", where !x" is the minimum integer that is not below x. Before establishing TCP connections with server s, the user terminal needs to resolve the IP address of server s by using the DNS, and we define d as the average time required in this address-resolution process3. Now, we derive Ys as
Ys= d + rs+! ms P
"
(rs+ vs+ us). (2) 3The address-resolution process includes the inquiry to local DNS servers
as well as the recursive inquiries starting from the root DNS server.
Moreover, we assume that the user terminal establishes the TCP connections and starts downloading objects from all the object servers Sx providing the objects constructing webpage x when a user views webpage x. Without using edge com-puting, wx, the total time required to obtain all the objects constructing webpage x, is given by wx= maxs∈SxYs.
Next, let us consider the case of delivering all the objects from an edge node by edge computing. We can expect that the RTT between the user terminal and object servers can be dramatically reduced when delivering objects from the edge node, so we assume that rsis zero for all the objects. However, the DNS resolving latency, the server response time, and object sending latency cannot be avoided even when delivering objects from edge nodes, so we assume that the identical values of d, vs, and usin the case without edge computing are still applied to those in the case with edge computing. Now, Y#
s, the total latency required to acquire all the objects from the edge node, is obtained by
Ys# = d + ! ms
P "
(vs+ us). (3)
The total time required to obtain all the objects constructing webpage x from the edge node, w#
x, is also obtained by wx# = maxs∈SxY#
s. Because vs is about one digit larger than rs in many webpages viewed at many locations in the world [9], we can regard the identical object server s as giving the maximum Ys and the maximum Ys#. Therefore, ex, the amount of the reduction in the response time of webpage x when delivering all the objects from the edge node, is derived as
ex= wx− w#x= max s∈Sx #$! ms P " + 1%rs & . (4)
IV. EXPERIMENTBROWSINGWEBPAGES FROMMULTIPLE
LOCATIONS
To estimate ex using (4), we need to measure the actual data of Sx, the object server set of webpage x, ms, which is the number of objects delivered from object server s, and rs, which is the RTT between the user terminal and object server s. Even when browsing an identical webpage x, different object servers might be used depending on the browsing location [1][9], so we need to collect measurement data when browsing webpages at various locations in the world to investigate the effect of edge computing. Therefore, we evaluated ex by using measurement data obtained when browsing about 1,000 of the most popular webpages at 12 locations in the world using PlanetLab [15]. In this section, we describe the procedure of this experiment.
A. Selecting Target Webpages
First, we selected the target webpages for estimating ex. It is desirable to measure popular webpages gathering many requests to compare the general tendencies of ex in each web category and each access location. Quantcast provides a ranking list of webpages accessed by users in each country [16]. We used this ranking list to select the most popular webpages. The URLs shown in this access ranking list are the home pages of each webpage, so we analyzed only home pages. We leave the evaluation of ex in webpages that can be browsed from home pages as future work. We selected the most popular 300 webpages in each of the 16 categories
summarized in Tab. I according to the ranking information on the Alexa webpage [2].
TABLE I
PROPERTIES OF WEBPAGES OF EACH CATEGORY EVALUATED
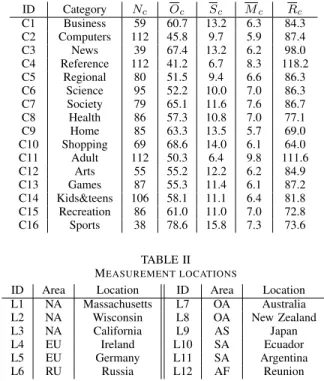
ID Category Nc Oc Sc Mc Rc C1 Business 59 60.7 13.2 6.3 84.3 C2 Computers 112 45.8 9.7 5.9 87.4 C3 News 39 67.4 13.2 6.2 98.0 C4 Reference 112 41.2 6.7 8.3 118.2 C5 Regional 80 51.5 9.4 6.6 86.3 C6 Science 95 52.2 10.0 7.0 86.3 C7 Society 79 65.1 11.6 7.6 86.7 C8 Health 86 57.3 10.8 7.0 77.1 C9 Home 85 63.3 13.5 5.7 69.0 C10 Shopping 69 68.6 14.0 6.1 64.0 C11 Adult 112 50.3 6.4 9.8 111.6 C12 Arts 55 55.2 12.2 6.2 84.9 C13 Games 87 55.3 11.4 6.1 87.2 C14 Kids&teens 106 58.1 11.1 6.4 81.8 C15 Recreation 86 61.0 11.0 7.0 72.8 C16 Sports 38 78.6 15.8 7.3 73.6 TABLE II MEASUREMENT LOCATIONS
ID Area Location ID Area Location L1 NA Massachusetts L7 OA Australia L2 NA Wisconsin L8 OA New Zealand L3 NA California L9 AS Japan L4 EU Ireland L10 SA Ecuador L5 EU Germany L11 SA Argentina L6 RU Russia L12 AF Reunion
B. Constructing Measurement Platform on PlanetLab PlanetLab is an overlay network consisting of about 500 hosts constructed on the Internet, and we can execute various programs on the selected hosts of PlanetLab [15]. By executing the procedure described in Section IV-C on multiple PlanetLab hosts, we browsed target webpages from various locations in the world. We selected 12 hosts: 3 from North America (NA), 2 from Europe (EU), 1 from Russia (RU), 2 from Oceania (OA), 1 from Asia (AS), 2 from South America (SA), and 1 from Africa (AF). Table II summarizes these 12 probing locations, and we note that Reunion (AF) is a French island off the eastern cost of Madagascar.
C. Browsing Webpages at Multiple Locations
We acquired HTTP archive record (HAR) files [7] to obtain the communication properties generated when sending a GET message of an HTTP request from the probing PlanetLab host. In HAR files, various communication properties, e.g., the host URL from which each object is downloaded, size of each object, and delay caused in obtaining each object, are output as JavaScript Object Notation (JSON). We continuously and automatically accessed a large number of webpages by using the netsniff.js executable on PhantomJS, in which JavaScript can be executed on the command line [12]. Many cacheable objects, e.g., video or images, are cached at client terminals, and these objects in the local cache are reused when accessing the same webpages from the same client terminal. We obtained all the objects from remote servers by invalidating the local cache of the probing PlanetLab hosts.
We obtained Sx, the object server set of webpage x, and ms, the number of objects delivered from object server s, by extracting the name of object servers from the obtained HAR
files. Moreover, to obtain rs, the RTT between the probing PlanetLab host and object server s, each probing PlanetLab host sent a ping command to each object server immediately after obtaining the HAR file of each webpage. To gather the HAR files for many webpages, each PlanetLab host started to browse the next webpage when no object servers responded for more than 30 seconds. As a result, we correctly obtained the HAR files for 1,124 webpages at all 12 locations shown in Tab. II, and we evaluated exfor these 1,124 webpages. Table I summarizes Nc, the number of webpages evaluated in each category c, and let Xc denote the set of webpages evaluated in category c.
V. NUMERICALRESULTS
In this section, we investigate ex, the reduction amount of web response time estimated by (4) using the measured data obtained by the experiment described in Section IV. Because exis determined by rsand ms, we first analyzed the tendencies of rs and msin each category and location. Next, we investigated the tendencies of the effect of edge computing on reducing the web response time in various areas of the world.
A. RTT in Each Web Category We define R(a)
c , the average RTT of each webpage of Xc when browsing it at location a, by
R(a)c = 1 Nc ' x∈Xc ' s∈S(a)x
m(a)s rs(a)/o(a)x . (5)
We define S(a)
x , m
(a)
s , and r(a)s as the measurement results of Sx, ms, and rs when browsing webpage x at location a, respectively. Moreover, o(a)
x is the number of objects downloaded when browsing webpage x at location a, i.e., o(a)x = (
s∈S(a)x
m(a)s . Table I summarizes Oc, the average object count of each webpage of category c, Sc, the average object server count of each webpage of category c, Mc, the average of the average object count obtained from each server in each webpage of category c, and Rc, the average of the average RTT of each webpage of category c.
Figure 2 plots the maximum, average, and minimum values of R(a)
c among all the 16 categories at each browsing location. In North America (L1, L2, and L3) and Europe (L4 and L5), both the average and maximum difference of R(a)
c among
the categories were in the range of 25 to 50 milliseconds, and we confirmed that objects of all the categories tended to be obtained from nearby locations. However, in Russia (L6), Oceania (L7 and L8), Japan (L9), and Ecuador (L10), the average and maximum difference of R(a)
c was in the
range of 75 to 100 milliseconds, and the difference among categories was remarkable. Moreover, in Argentina (L11) and Africa (L12), the average R(a)
c was large, i.e., between 125 and 250 milliseconds, whereas its maximum difference among categories was small, i.e., between 50 and 100 milliseconds, much smaller than the average value, so we confirmed that objects of all the categories tended to be obtained from remote locations.
Next, to show the difference of categories with a large or small R(a)
four categories with the largest R(a)
c as well as the bottom four categories with the smallest R(a)
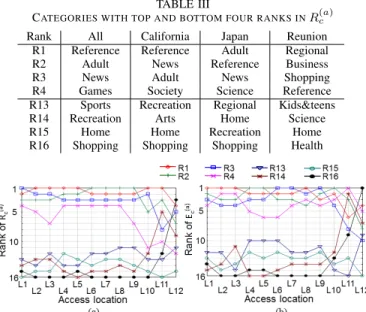
c in California, Japan, and Reunion in Tab. III. In the table, we also show the world-top and world-bottom four categories with the largest or smallest average R(a)
c among all the 12 locations (All). Moreover, Fig. 3(a) plots the R(a)
c rank at each of the 12 locations for the world-top and world-bottom four categories. We observed that the R(a)
c rank in all the areas except South America and Africa was almost identical with the world rank.
Fig. 2. Maximum, average, and minimum R(a)
c , average RTT of each
webpage of each category measured at each location a TABLE III
CATEGORIES WITH TOP AND BOTTOM FOUR RANKS INR(a)c
Rank All California Japan Reunion R1 Reference Reference Adult Regional R2 Adult News Reference Business R3 News Adult News Shopping R4 Games Society Science Reference R13 Sports Recreation Regional Kids&teens R14 Recreation Arts Home Science R15 Home Home Recreation Home R16 Shopping Shopping Shopping Health
Fig. 3. Ranking of average RTT and average reduction effect on web response time at each location of top and bottom four categories in world
Information-sharing webpages, e.g., Stack Overflow, Yahoo Answers, and Internet Archive, which are commonly used by users around the world, were classified into the Reference category, and news pages providing news on a global scale, e.g., CNN and Yahoo News, were classified into the News category [2]. As shown in Fig. 2, R(a)
c was especially small in North America, so we can anticipate that object servers providing web content for these global categories that are commonly viewed in all areas of the world tend to concentrate in North America, where the ICT environment is fine, and many content providers exist. As a result, the R(a)
c of global categories was large in many areas except North America.
Online shopping webpages, e.g., Amazon and Ebay, in which different tenants sell various products and services in each country were classified into the Shopping category, and local-information webpages, e.g., Yahoo finance, Yelp, and Groupon, providing localized information for each area, were classified into the Home category [2]. When browsing the
webpages of these local categories, different content tended to be provided at each area even when accessing the identical URL, so we determined that R(a)
c was small in many areas. However, when browsing the webpages of local categories in South America or Africa, content localized in these areas tended to not be provided, so the R(a)
c rank of categories in these areas was remarkably different from those in other areas of the world.
B. Object Count Obtained from Each Server We define M(a)
c , the average number of objects obtained from each object server in each webpage of category c browsed at location a, by M(a) c = 1 Nc ' x∈Xc ' s∈S(a)x m(a) s /s(a)x , (6) where s(a)
x is the number of object servers accessed when browsing webpage x at location a. Figure 4 plots the maxi-mum, average, and minimum of M(a)
c among the 16 categories at each browsing location. We observed similar tendencies of Mc(a) in each category in all the areas. As shown in Tab. I, the M(a)
c of the Adult and Reference webpages, in which the number of object servers was small, tended to be large, whereas that of the Home webpages with many object servers and that of Computer webpages with few objects tended to be small. In all the areas of the world, the maximum difference of M(a)
c among categories was about half of the average of Mc(a), and the difference among categories was much smaller than that of R(a)
c .
Fig. 4. Maximum, average, and minimum M(a)
c , average number of objects
obtained from each server
C. Reduction Effect on Web Response Time Let E(a)
c denote the average of exwhen browsing webpages of category c at location a. In this section, we investigate the effect of edge computing on reducing the web response time in each category at each location by evaluating E(a)
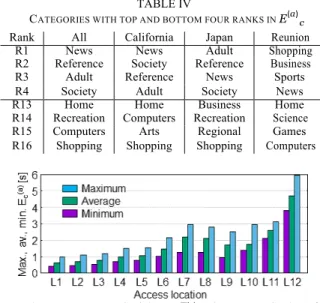
c , when setting P = 2 using the measured values of rsand ms. Table IV summarizes the top four categories with the largest E(a) c as well as the bottom four categories with the smallest E(a)
c in California, Japan, and Reunion. In the table, we also show the world-top and world-bottom four categories (All), and Fig. 3(b) plots the E(a)
c rank at each of the 12 locations for these eight categories. Like in the case of the RTT, we observed that the E(a)
c rank in all the areas except South America and Africa was almost identical with the world rank. As observed in Figs. 2 and 4, the difference of RTT among categories was large in
c c c c c c c
all the areas except South America and Africa, whereas the difference of object count delivered from each object server among categories was small. Therefore, the E(a) rank among categories tended to be the same as that of R(a) in these areas. However, in South America and Africa, the difference of RTT among categories was small as observed in Fig. 2, so the E(a) rank had unique tendencies among categories that were different from the world rank.
Figure 5 plots the maximum, average, and minimum values of E(a) among all the 16 categories at each browsing location. Although the average reduction of web response time by edge computing was small in North America and Europe (L1 - L5), we can expect a reduction of about a one to three seconds in Russia, Oceania, Japan, and South America (L6 - L11) and about four to six seconds in Africa (L12). As observed in Fig. 2, the RTT was large in many categories in all the areas except North America and Europe, and it was remarkably large in Africa. In these areas with a large RTT, edge computing is effective. Moreover, in all the areas except Argentina and Africa, the maximum difference of E(a) among categories was almost equal with the average of E(a), and we observed a remarkable difference in the effect of edge computing among categories in these areas.
TABLE IV
CATEGORIES WITH TOP AND BOTTOM FOUR RANKS IN E(a)
Rank All California Japan Reunion R1 News News Adult Shopping R2 Reference Society Reference Business R3 Adult Reference News Sports R4 Society Adult Society News R13 Home Home Business Home R14 Recreation Computers Recreation Science R15 Computers Arts Regional Games R16 Shopping Shopping Shopping Computers
Fig. 5. Maximum, average, and minimum E(a) and average reduction of
In comparison, in Argentina and Africa, the RTT of all the categories was large.
• In Africa and South America, both the average RTT to
object servers and the average object count obtained from each object server equally affected ex, and the category
rank of ex was unique. In comparison, in other areas, the
RTT had a stronger impact on ex, and the category rank
of ex was almost identical with the world rank. In these
areas, the effect of edge computing tended to be large for webpages of global categories, whereas it tended to be small for webpages of local categories.
• The effect of edge computing was high in all the areas
except North America and Europe, and the web response time was expected to be reduced by about 1.5 to 2.5 seconds in Russia, Oceania, Japan, and South America and about 4.5 seconds in Africa.
REFERENCES
[1] B. Ager, W. Muhlbauer, G. Smaragdakis, and S. Uhlig, Web Content Cartography, ACM IMC 2011.
[2] Alexa, http://www.alexa.com/toppages/category.
[3] F. Bonomi, R. Milito, J. Zhu, and S. Addepalli, Fog computing and its role in the internet of things, ACM MCC 2012.
[4] M. Butkiewicz, H. V. Madhyastha, and V. Sekar, Understanding Web- page Complexity: Measurements, Metrics, and Implications, IMC 2011. [5] A. Davis, J. Parikh, and W. Weihl, EdgeComputing: Extending Enter-
prise Applications to the Edge of the Internet, WWW 2004. [6] When seconds count. http://www.gomez.com/wp-content/
downloads/GomezWebSpeedSurvey.pdf. [7] J. Odvarko, HAR Viewer, Software is hard,
http://www.softwareishard.com/blog/har-viewer.
[8] K. He, A. Fisher, L. Wang, A. Gember, A. Akella, and T. Ristenpart, Next Stop, the Cloud: Understanding Modern Web Service Deployment in EC2 and Azure, IMC 2013.
[9] N. Kamiyama, Y. Nakano, K. Shiomoto, G. Hasegawa, M. Murata, and H. Miyahara, Investigating Structure of Modern Web Traffic, IEEE HPSR 2015.
[10] R. Kohavi and R. Longbotham, Online Experiments: Lessons Learned, IEEE Computer, 40(9), pp. 103-105, Sep. 2007.
[11] J. Mickens, Silo: Exploiting JavaScript and DOM Storage for Faster Page Loads, USENIX WebApps 2010.
[12] GitHub, Network Monitoring, http://github.com/ariya/ phantomjs/wiki/Network-Monitoring
[13] E. Nygren, R. Sitaraman, and J. Sun, The Akamai Network: A Platform for High-Performance Internet Applications, ACM SIGOPS 2010. [14] J. Ott, M. Sanchez, J. Rula, F. Bustamante, Content Delivery and the
Natural Evolution of DNS, ACM IMC 2012. [15] PlanetLab, https://www.planet-lab.org/ [16] Quantcast, http://www.quantcast.com/top-pages.
[17] M. Rabinovich, Z. Xiao, and A. Aggarwal, Computing on the Edge: A Platform for Replicating Internet Applications, WCW 2003.
[18] Tadapaneni, N. R. (2016). Overview and Opportunities of Edge Computing. Social Science Research Network.
web response time c
VI. CONCLUSION
[19] S. Sivasubramanian, G. Pierre, M. Steen, and G. Alonso, Analysis of Caching and Replication Strategies for Web Applications, IEEE Internet Computing, 11(1), pp. 60-66, 2007.
[20] S. Souders, High Performance Web Pages: Essential Knowledge for
In this paper, we derived a simple formula that estimates the lower bound of ex, the reduction of response time of webpage
x by delivering objects from edge nodes, and we investigated
the effect of edge computing in each web category, e.g., News and Sports, in numerical evaluations using the data obtained by browsing about 1,000 webpages from 12 locations in the world using PlanetLab. We summarize the main findings obtained in the numerical evaluation as follows.
• In Russia, Oceania, Japan, and Ecuador, the average RTT
to object servers strongly depended on the web categories, and the RTT of webpages of global categories, e.g., Reference and News, was large, whereas that of webpages of local categories, e.g., Home and Shopping, was small.
Front-End Engineers, O ’Reilly Media, 2007.
[21] A. Su, D. Choffnes, A. Kuzmanovic, and F. Bustamante, Drafting Behind Akamai: Inferring Network Conditions Based on CDN Redirections, ACM Trans. Networking, 17(6), pp. 1752-1765, 2009.
[22] S. Sundaresan, N. Feamster, R. Teixeira, and N. Magharei, Characteriz- ing and Mitigating Web Performance Bottlenecks in Broadband Access Networks, IMC 2013.
[23] M. Tariq, A. Zeitoun, V. Valancius, N. Feamster, and M. Ammar, Answering“ What-If ” Deployment and Configuration Questions with WISE, SIGCOMM 2008
[24] X. Wang, A. Balasubramanianm A. Krishnamurthy, and D. Wetherall, Demystifying Page Load Performance with WProf, NSDI 2013. [25] S. Yi, Z. Hao, Z. Qin, and Q. Li, Fog Computing: Platform and
Applications, IEEE HotWeb 2015.
[26] J. Zhu, D. Chan, M. Prabhu, P. Natarajan, H. Hu, and F. Bonomi, Im- proving Web Pages Performance Using Edge Servers in Fog Computing Architecture, IEEE SOSE 2015.
[27] J. Ravi, Z. Yu, and W. Shi, A survey on dynamic Web content generation and delivery techniques, Elsevier J. Network and Computer Applications, 32(5), pp. 943-960, 2009.
[28] Schauhan, Cs. (2016). A Shift from Cloud Computing Model to Fog Computing. Journal of Applied Computing