HAL Id: hal-00184122
https://hal.archives-ouvertes.fr/hal-00184122
Submitted on 6 Feb 2020
HAL is a multi-disciplinary open access archive for the deposit and dissemination of sci-entific research documents, whether they are pub-lished or not. The documents may come from teaching and research institutions in France or abroad, or from public or private research centers.
L’archive ouverte pluridisciplinaire HAL, est destinée au dépôt et à la diffusion de documents scientifiques de niveau recherche, publiés ou non, émanant des établissements d’enseignement et de recherche français ou étrangers, des laboratoires publics ou privés.
Distributed under a Creative Commons Attribution| 4.0 International License
Condensation of Pure and Mixture of Hydrocarbons in a
Compact Heat Exchanger: Experiments and Modelling
Bernard Thonon, André Bontemps
To cite this version:
Bernard Thonon, André Bontemps. Condensation of Pure and Mixture of Hydrocarbons in a Compact Heat Exchanger: Experiments and Modelling. Heat Transfer Engineering, Taylor & Francis, 2002, 23 (6), pp.3-17. �10.1080/01457630290098718�. �hal-00184122�
Condensation of Pure and
Mixture of Hydrocarbons in a
Compact Heat Exchanger:
Experiments and Modelling
B. THONONCEA-Grenoble, GRETh, Grenoble, France
A. BONTEMPS
Universit´e Joseph Fourier Grenoble, LEGI-GRETh, Grenoble, France
This article presents a study on heat transfer in condensation of pure and mixtures of hydrocarbons in a compact welded plate heat exchanger. Three pure uids (pentane, butane, and propane) and two mixtures (butane C propane ) have been used. The operating pressure ranges from 1.5 to 18 bar. For pure uids, two heat transfer mechanisms have been identied. For low Reynolds numbers, the condensation occurs almost lmwise and the heat transfer coefcient decreases with increasing Reynolds number. For higher values of the Reynolds number, the heat transfer coefcient increases gently. The transition between the two regimes is between Re D 100 and 1,000 and depends on the operating conditions. For mixtures, the behavior is different. For low Reynolds numbers, mass transfer affects heat transfer and reduces the heat transfer coefcient by a factor of up to 4. Correlations for lmwise and in-tube condensation do not predict the results accurately, and a specic correlation is proposed for pure uid condensation. For mixtures, the condensation curve method does not allow mass transfer effects to be taken into account, and more work is required to establish an accurate predictive model.
Condensation occurs in many industrial processes, but rarely with pure uids. The uids encountered are mixtures and often noncondensabl e gases are present, and this makes the condensatio n process very complex.
This project, JOE3-CT97-0062, has been partially supported by the EC, within the frame of the Non-nuclear Energy Programme. The authors grate-fully acknowledg e Alfa-Laval Vicarb for supporting this study and coordi-nating the European project.
Address correspondenc e to Dr. B. Thonon, CEA-Grenoble, GRETh, 17 rue des martyrs, 38054 Grenoble, France. E-mail: thonon@cea.f r
In the case of mixtures or in the presence of a noncon-densable gas, the vapor condensing must diffuse through the gas to the interface. This requires a partial pressure gradient toward the interface.
The partial pressure of the vapor falls from a constant value at a rather large distance from the interface to a lower value at the interface. Correspondingl y, the ac-companying saturation temperature also falls toward the interface. Therefore, during condensatio n the condens-ing vapor arrives by diffusion at the condensate surface, and it is the thermal resistance in the vapor that limits
the process. Hence, in order to improve the heat transfer, one must reduce the thermal resistance on the vapor side. Several factors can enhance the condensatio n process by reducing the vapor-side resistance. During condensation of mixtures or of vapors that contain noncondens -ables, the heat transfer on the vapor side can be improved by raising the vapor velocity. It has been shown that the heat transfer coefcient can be improved by approxi-mately 30% by increasing the vapor velocity. The use of nely undulate d surface can also achieve signicant augmentation s in heat transfer during condensation. It has been shown that corrugation can promote turbulent equilibriu m between the phases and thus contribute to the increase in heat transfer.
Compact heat exchangers are characterized by small hydraulic diameters (1–10 mm), and there is no reliable design method to estimate heat transfer coefcients dur-ing condensatio n in such small passages. In the open literature, condensatio n of mixtures and of vapor in the presence of noncondensable s has been studied, but es-sentially for conventiona l geometries (plain tubes ), and only a few results have been published with uids repre-sentative of actual process condition s (hydrocarbons).
HEAT TRANSFER IN CONDENSATION Gravity-Controlle d Regime
For the gravity-controlle d regime, the Nusselt theory for a plain wall allows the local heat transfer coefcient to be calculated. The average heat transfer coefcient is given by [1]
aNuDCo 1:47 Re ¡1=3
L (1)
Figure 1 Filmwise condensation models.
where Co is a physical property number: Co D kL µ l2 L qL(qL¡ qG)g ¶¡1=3 (2) The lm Reynolds number is calculated by
ReL D 4 Ç
mLDh
lLP (3)
where P denotes the wetted perimeter (for at channels twice the plate width).
The Nusselt theory is valid only if the liquid lm is smooth, but for lm Reynolds numbers over 30, waves appear at the interface and increase the heat transfer coefcient. Kutatelatze has proposed a modied Nusselt correlation. The average heat transfer coef-cient is given by [1]
aKuDCo
ReL
1:08 Re1:22L ¡5:2 (4)
For Reynolds numbers above 1,600, the liquid lm becomes turbulent and the Labuntsov correlation can be applied. The average value is given by [1]
aLaDCo
ReL
8570 C 58 Pr¡L0:5¡Re0:75
L ¡253¢
(5) A plot of these three models is given in Figure 1. For practical use, asymptotic models are often introduce d in order to take into account laminar, wavy lm, and turbulent lm condensation simultaneousl y (Figure 2):
aLWD ¡a2NuC a2Ku¢0:5 (6)
aWTD ¡a2KuC a2La¢ 0:5
Figure 2 Asymptotic models for lmwise condensation.
Forced-Convection Regime
In the shear-controlle d regime, several theoretical or semiempirical correlations exist for predicting the heat transfer coefcient. The most common ones are the Akers correlation modied by Cavallini and Zecchin (as presented by Cavallini et al. [2]), the Boyko-Kruzhili n [3], and the Shah [4] correlations.
Akers or Cavallini-Zecchin : acvDaRebeqPr 0:33 L kL Dh (8) where Reeq is an equivalent Reynolds number for the
liquid C vapor mixture: Reeq D Ç
m[(1 ¡ x ) C x(qL=qG)0:5]Dh
lL (9)
Boyko and Kruzhilin or Shah:
acvD aLOF (10)
where the heat transfer coefcient of the liquid phase (aLO) is deduced from specic correlations for forced
convection and F is the enhancement factor.
CONDENSATION IN PLATE HEAT EXCHANGERS
Steam Condensation
Tovazhnyansk i and Kapustenko [5] have performed some tests on a plate heat exchanger with a 60Ê corruga-tion angle. Their tests covered a large range of Reynolds numbers. For Reynolds numbers above 300, a
shear-controlled regime dominates and the heat transfer coef-cients are compared to a modied Boyko and Kruzhilin correlation, the Boyko-Kruzhili n enhancement factor being F D µ 1 C x ³q L qG ¡1 ´¶0:5 (11)
The use of this correlation means that the enhancement of the heat transfer coefcients in condensatio n is com-parable to the enhancement in single-phas e ows. For example, for a 60±corrugation angle, the heat transfer coefcient is six times larger than for a comparable plain channel (Thonon et al. [6]). For lower Reynolds num-bers (ReL< 300), condensation seems to be
gravity-controlled. However, the Nusselt law underestimates the heat transfer coefcient. The herringbone pattern of the corrugation tends to drain the condensate to the periph-ery of the channel and keeps the condensate lm thin.
Di-an et al. [7] have studied steam condensatio n in two different geometries: a plain rectangular channel and a corrugated channel (45± corrugation angle). For the plain rectangular channel with Reynolds numbers between 70 and 500, the Nusselt theory predicts the heat transfer coefcients with good accuracy. For the corrugated channels, their results clearly outline the two regimes of condensation . For Reynolds numbers below 350 a gravity-controlle d regime exists, and for Reynolds numbers above 350 a shear-controlle d regime dominates. The change of regime at a Reynolds number of 350 is explained by the change in the ow pattern. In corrugated channels, the transition from laminar to tur-bulent regime occurs at a lower Reynolds number than for a plain tube (about ReL D400). The intensication
number of 250 and of 220% for a Reynolds number of 900.
Wang and Zao [8] studied steam condensation in a plate heat exchanger with a 45±corrugation angle. Their results clearly indicate that the heat transfer coefcient is shear-controlled : the heat transfer coefcient increases with the liquid lm Reynolds number. The intensi-cation of the heat transfer coefcient compared to the Nusselt theory varies from a factor of 2 to 3 depending on the ow conditions.
Wang et al. [9, 10] have studied steam condensatio n in one plate and frame and two brazed heat exchangers. The effect of mass ux and pressure has been studied. The results have been compared to the Shah and Boyko-Kruzhilin correlations and a large discrepancy has been observed. The density exponent of the Boyko-Kruzhili n correlation has been reduced to 0.45 and allows better predictive accuracy.
Condensation of Refrigerants
Compact heat exchangers are often used in refriger-ant systems. A review has been recently presented by Palm and Thonon [11].
For ammonia applications , Panchal and Rabas [12] have carried out two series of tests with high and low corrugation angle (60± and 30±). The results indicate that the plates with low corrugation angle give higher heat transfer coefcients than the plates with a 60± cor-rugation angle. This is probably caused by an increase of the liquid hold-up in high-corrugation-angl e plates.
Kumar [13] has reported results for condensatio n of R22 and ammonia in various types of plate heat ex-changers. The results indicate that the condensatio n is gravity-controlle d for low Reynolds numbers, and shear-controlle d for higher Reynolds number. The mea-sured heat transfer coefcients are 1.5 to 4 times larger than those expected in a comparable plain tube. The same type of results was also obtained by Navarro and Bailly [14], for condensatio n of refrigerants in compact brazed heat exchangers.
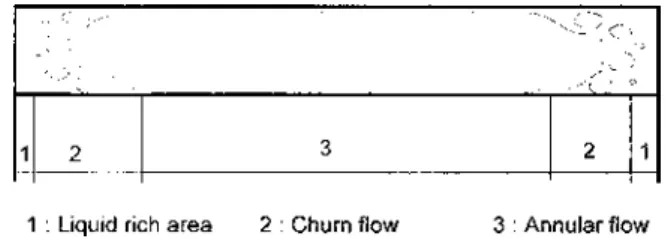
Chopard et al. [15] have performed tests for conden-sation of R22 at high Reynolds numbers in welded plate heat exchangers. Three different geometries were tested (plain rectangular, in-line, or staggered studs). The re-sults are presented in terms of an intensication factor of the single-phase heat transfer coefcient. The heat trans-fer coefcients of in-line or staggered studs are signif-icantly higher than those of the plain channel. Further-more, even for the plain channel, the Shah correlation underestimates the heat transfer coefcients. Local mea-surements of the void fraction have shown that the liquid is drained to the periphery and that a thin lm of liquid remains in the central part of the channel (Figure 3).
Figure 3 Flow structure in a rectangular channel.
Arman and Rabas [16] made a serious effort to de-velop a general computer program for heat transfer and pressure drop of single-componen t and binary mixtures during condensatio n in plate heat exchangers. Starting with a review of the sparse literature in the area, they conclude that the condensatio n heat transfer is shear-controlled. The computation scheme for heat trans-fer was based on a correlation by Tovazhnyansk i and Kapustenko [5] and for pressure drop on the Lockhart-Martinelli method. The condensatio n channel is divided into a number of steps, and the local heat transfer co-efcient and pressure drop of each step is calculated iteratively. A number of constants in the correlations were determined by comparison with experimental data from the literature. Results from new experiments with pure saturated ammonia were then compared to the pre-dictions of the computer program, and the deviations were shown to be small for the case of single-componen t uids.
More recently, Yan et al. [17] have presented results on condensatio n of R134a in a compact brazed heat exchanger having a 60±corrugation angle. The effects of mass ux, average heat ux, local vapor quality, and operating pressure have been studied. The results indicate that the heat transfer coefcient increases with mass ux, indicating forced-convection heat transfer. To correlate the results a modied Akers correlation is proposed:
Nu D a RebeqPr1L/3 (12)
As outlined by Srinivasan and Shah [18], the heat trans-fer performances are closely linked to the ow pattern. Most of the conventiona l in-tube correlations fail in predicting the heat transfer coefcient in compact heat exchangers, as the ow patterns are radically different from in-tube ows. Furthermore, for very small chan-nels, the surface tension has to be taken into account.
EXPERIMENTAL APPARATUS General Description
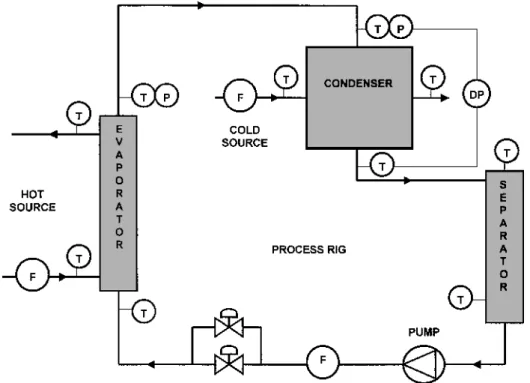
A test rig devoted to hydrocarbon application s has been used for the experiments. Fluids such as
Figure 4 Description of the hydrocarbon test rig. T, temperature measurement; P, pressure measurement; DP, drop pressure measurement; F, ow meter.
butane, propane, or mixtures can be used. The heat exchangers tested can be either evaporators or con-densers. The pressure can be varied up to 20 bar with temperature up to 80±C. The hydrocarbon ow
rate is up to 600 kg/h with a maximum heat duty of 70 kW.
The test rig has three independent circuits (Figure 4):
The hot water circuit (100) The cold water circuit (200) The hydrocarbon circuit (300)
The condenser is installed after the evaporator and is fed by saturated vapor. The saturation condition s are checked by measurement of the inlet pressure and tem-perature and by comparison with the saturation curve of the uid [T D f ( psat)]. At the heat exchanger outlet, the
liquid ows directly to a storage tank. Consequentl y, the uid temperature is assumed to be close to the saturation temperature, therefore neglecting possible subcoolin g of the liquid.
Heat Exchanger Geometry
The plate arrangement of the tested heat exchanger is given in Figure 5. The main characteristics are plate width, B D 0.3 m; plate length, L D 0.3 m; Corruga-tion angle, 45±; plate spacing, e D 0.005 m; hydraulic
diameter, Dh D2 e D 0.01 m.
Measurements
The temperatures and pressures are measured on both the hydrocarbon and the water sides:
Tin 300: inlet hydrocarbon temperature,±C Tout 300: outlet hydrocarbon temperature,±C Pin 300: inlet hydrocarbon pressure, bar DP300: hydrocarbon pressure drop, mbar
Ç
M300: hydrocarbon mass ow rate, kg/s
Tin 200: inlet water temperature,±C Tout 200: outlet water temperature,±C
Ç
V200: water volumetric ow rate, m3/s
The accuracy of the temperature measurements (after calibration )is §0.2±C. The owmeters have an accuracy
of §1%. The differential and absolute pressure taps are
Figure 5 Detail of the compact heat exchanger. (courtesy of Alfa-Laval Vicarb.)
heated to avoid the presence of liquid in the connecting pipes, and the accuracy is §1%.
RESULTS Data Reduction
Experimental differences have been observed be-tween the heat duties calculated on the water and hy-drocarbon sides. These differences are mainly due to uctuations on the hydrocarbon mass ow rate. The hydrocarbon mass ow meter is located between two tanks, and at low ow rates (or low heat duties) insta-bilities are measured by the ow meter. For heat du-ties greater than 20 kW, the energy balance is within §10%, which is acceptable for such two-phase ow experiments.
Therefore, the actual heat duty is assumed to be the one measured on the water side:
Ç
Q D ÇQwater DVÇ200q200cp;200(Tout;200¡Tin;200) (13)
Then, from this value and assuming an exact heat bal-ance, the hydrocarbon mass ow rate is recalculated from Ç M300 D Ç Qwater (hin¡hout)300 (14) The heat transfer coefcient on the condensation side is deduced from the overall heat transfer coefcient, where the heat duty is estimated from the water side:
U D QÇ
DTln: A
(15) The average heat transfer coefcient on the condensa-tion side is deduced from
1 U D 1 a1 CRwC 1 a2 (16) where a1 and a2 are the heat transfer coefcients on
the hydrocarbon and water sides. The latter is calcu-lated with the correlations presented by Thonon et al. [6] obtained for several plate heat exchangers. For the geometry studied (corrugation angle of 45±), the corre-lation is
Nu D 0:347 Re0:653Pr0:33 (17)
where the Reynolds and Prandtl numbers are calculated for the single-phas e liquid ow on the cooling side.
The reference heat transfer surface ( A) is based on the projected area. Therefore, the surface extension (less than 20%) is included directly in the heat transfer correlation.
The results concerning the heat transfer coefcients are presented using the liquid Reynolds number assum-ing all the ow is liquid (condenser outlet):
ReLOD Ç m Dh
lL (18)
where Çmis the mass velocity of the hydrocarbon ow. The estimated uncertainty for the heat transfer coef-cient on the condensatio n side ranges between 15% at high Reynolds number and 30% at low Reynolds numbers.
Tests Performed
Five sets of tests have been performed: three with pure uids and two with mixtures. For each uid, the ab-solute pressure and the mass ow rate on the condensa-tion side were varied. The range covered is presented in Figure 6 for pentane, butane, propane, butane–propane (49%–51% by mass), and butane–propane (28%–72% by mass).
The pure uids used are of high quality and contain less than 0.1% of other components. The physical prop-erties have been calculated using the Prophy software developed by PROSIM. For the two butane C propane mixtures, the mass concentration has been estimated by measuring the dew and bubble temperatures at differ-ent pressures and by comparing with the temperature predicted by the physical property software.
Pure Fluid Condensation
Three series of tests have been performed using pure hydrocarbons (pentane, butane, and propane) and the overall thermal and hydraulic performances have been recorded and are presented in Figures 7–9. The operat-ing pressure ranges from 1.5 up to 18 bar, with Reynolds numbers between 100 and 2,000.
The results clearly indicate that for low Reynolds numbers the heat transfer coefcient in condensatio n is similar to that of a laminar falling lm and for higher Reynolds numbers turbulent effects tend to increase the heat transfer coefcient. The transition between these two mechanisms occurs for Reynolds numbers between 100 and 1,000, depending on the pressure.
The operating pressure has two effects. First, in the laminar zone, the heat transfer coefcients increase with pressure, which is essentially an effect of the physi-cal properties. Second, the higher pressures give higher
Figure 6 Experimental conditions (all data).
transition Reynolds numbers, and this might be linked to an effect of the condensate Prandtl number.
Mixture Condensation
For the mixtures (Figures 10 and 11), the behavior is quite different. In the rst zone, the heat transfer coefcient increases with the Reynolds number, and then in the second zone the behavior is similar to the one of pure uids.
Figure 7 Condensation of pure pentane.
These observation s outline the effect of mass transfer on the overall heat transfer coefcient. For low Reynolds numbers (laminar lm) and for pure uids the heat trans-fer resistance is mainly in the liquid lm, and this re-sistance increases with the Reynolds number (Nusselt theory). For higher Reynolds numbers, the liquid lm becomes turbulent and with increasing Reynolds num-bers the heat transfer coefcient increases.
For pure uids there is no mass transfer effect during condensation . On the contrary, with a mixture, there is
Figure 8 Condensation of pure butane.
Figure 10 Condensation of a 49%–51% butane–propane mixture.
a mass transfer resistance due to molecular diffusion in the gas phase. For low Reynolds numbers, the velocity is low and there is almost no mixing in the gas phase, consequently mass transfer effects will reduce the heat transfer coefcient. For higher Reynolds numbers, mix-ing occurs in the gas phase and enhances mass transfer; consequently the heat transfer resistance is mainly in the liquid lm and the mixture behaves as a pure uid.
DATA ANALYSIS Pure Fluids
To correlate the results, two approaches can be adopted. We can consider either falling-lm or forced-convection correlations. For falling-lm models, the heat transfer coefcients are plotted introducin g the physical property number Co. For forced convection, the enhancement factor F is used [Eq. (10)]. The data have been compared to several correlations for lmwise (Figure 12) and in-tube forced convection (Figure 13) condensation , but all these correlations fail in predicting the heat transfer performances. In the laminar regime, condensate drainage may occur in the furrow of the cor-rugation, and this will reduce the mean lm thickness and consequentl y increase heat transfer. The vapor ve-locity at the heat exchanger inlet is relatively low and the shear effect should be negligible .
A new correlation is proposed and adjusted based on the measurements. This correlation is based on lm
condensatio n and introduces a corrective term taking into account the geometry of the corrugated channel. The effect of the geometry is introduce d by the heat transfer coefcient of the liquid phase (aLO). The use
of the equivalent Reynolds number (Reeq) rather than
the liquid Reynolds number (ReL) gives better results
(Figure 14).
F D1564 Re¡eq0:76 D a aLO
(19)
This new correlation gives satisfactory results for the three pure uids tested (Figure 15): 80% of the data are predicted within §20%. The three pure uids used (pentane, butane, and propane) have physical properties that are quite similar, and it is not surprising that a single correlation, based on a nondimensiona l approach, gives good results. To validate and generalize this correla-tion, other operating condition s (lower pressures) and more viscous uids should be used. Only one geom-etry has been tested, but the correlation has been built with nondimensiona l numbers. The general form of this correlation (enhancement factor) is similar to the one proposed by Tovazhnyansk i and Kapustenko [5].
Mixture
The experimental data (Figure 16) suggests two heat transfer mechanisms: (1) a laminar regime in which the mass transfer resistance is the dominant resistance;
Figure 13 Comparison of condensation enhancement factors using butane with condensation correlations (FB-K, Boyko-Kruzhilin [3];
FYan, Yan et al. [17]).
Figure 15 Comparison of predicted and measured heat transfer coefcients.
(2) a turbulent regime in which heat transfer is controlled by the liquid lm.
The condensatio n curve method has been applied to our results. The mass transfer resistance is assumed to
be proportiona l to the heat transfer resistance in the va-por phase (1=aG). A correction factor (z) is introduced
to take into account the concentration prole between the bulk of the ow and the liquid lm interface. The
Figure 17 Evaluation of mass and heat transfer resistances.
resulting heat transfer coefcient is given by Silver [19] or Bell and Ghaly [20]:
a D 1
(1=apure uid condensatio n) C (z=aG)
(20) where the vapor heat transfer coefcient is estimated from single-phase heat transfer correlation, calculating the Reynolds number with the vapor fraction;zis given
by
zDx cpG
dT
dh (21)
where dT=dhis the inverse of the slope of the conden-sation curve h D h(T ).
The calculation is carried out using an average vapor quality of x D 0.5. The physical properties are estimated at the dew temperature for the vapor phase and at the bubble temperature for the liquid phase.
The results are presented in Figure 17. The equivalent mass transfer resistance decreases with the Reynolds number; on the contrary, the condensate heat transfer resistance increases. The experimental trends are well predicted by this model. For the turbulent regime (Re > 1,500) there is very good agreement, but for the lami-nar regime the heat transfer coefcient is overpredicted (Figure 18).
CONCLUSION
A small industrial compact condenser has been in-stalled and instrumented on a hydrocarbon test rig at GRETh. Five sets of tests have been performed using hydrocarbons: three with pure uids and two with mix-tures. The pressure was varied between 1.5 and 18 bar for a range of Reynolds numbers between 100 and 2,000. These condition s are representative for industrial cases. For pure uids (pentane, butane, and propane), two regimes have been identied. For low Reynolds numbers, the heat transfer coefcient in condensa-tion decreases, indicating a laminar regime. For higher Reynolds numbers, the heat transfer coefcient in-creases gently, indicating a transition to turbulent ow. For mixtures (butane C propane ), the behavior is dif-ferent. At low Reynolds numbers, the heat transfer coef-cient is much lower than with pure uids and increases with the Reynolds number. For higher Reynolds num-bers, it remains almost constant or increases slightly, and the values are close to those obtained with pure uids. Furthermore, a signicant pressure effect is ob-served for the laminar regime: low pressures give higher heat transfer coefcients. These observation s indicate that mass transfer effects are signicant and affect heat transfer during condensation.
A model for pure uid condensation has been es-tablished and gives satisfactory results within the range of tested uids. For mixtures, the condensation curve method does not allow estimating the heat transfer coef-cient in the laminar regime. But for turbulent regimes, as the mass transfer effect is negligible , the pure uid model allows predicting the condensation heat transfer coefcient of mixtures.
In order to validate the measurements and the cor-relations, obtained on small-scale units, industrial mea-surements have been performed. A prototype compact heat exchanger has been designed and manufactured by Alfa-Laval Vicarb and installed in an industrial plant producing chloroform.
NOMENCLATURE
a constant
A heat transfer area, m2
B plate width, m
Co physical property number, W/m2K
cp heat capacity, J/kg K Dh hydraulic diameter, m e plate spacing, m F enhancement factor g gravity, m/s2 h specic enthalpy, J/kg L length, m Ç
M mass ow rate, kg/s Ç m mass velocity, kg/s m2 Nu Nusselt number p pressure, Pa P perimeter, m Pr Prandtl number Ç Q heat duty, W Re Reynolds number
Reeq equivalent Reynolds number Rw wall resistance, m2K /W T temperature, ±C
DTln log mean temperature difference, K U overall heat transfer coefcient, W/m2K
Ç
V water volumetric ow rate, m3/s x vapor quality
z correction factor
a heat transfer coefcient, W/m2K k thermal conductivit y, W/m K
l dynamic viscosity, Pa s q density, kg/m3
Subscripts
cond condensatio n side cv convective
in inlet
G vapor phase (fraction) Ku Kutatelatze correlation
L liquid phase (fraction ) La Labuntsov correlation LO liquid phase only
LW laminar-wavy
Nu Nusselt correlation out outlet
sat saturation water water side WT wavy-turbulent 100 hot water 200 cold water 300 process uid
REFERENCES
[1] Rohsenow, W. M., Condensation: Part 1, in Handbook of
Heat Transfer Fundamentals, 2d ed., McGraw-Hill, New York, 1985.
[2] Cavallini, A., Longo, G. A., and Rosetto, L., Condensation Heat Transfer and Pressure Drop of Refrigerants in Tubes of Finned Tube Heat Exchangers, in Recent Development in
Finned Tube Heat Exchangers: Theoretical and Practical As-pects, DTI Energy Technology, Denmark, 1993.
[3] Boyko, L., and Kruzhilin, G., Heat Transfer and Hydraulic Resistance During Condensation of Steam in an Horizontal Tube and in a Bundle of Tubes, Int. J. Heat Mass Transfer, vol. 10, pp. 361–373, 1967.
[4] Shah, M. M., A General Correlation for Heat Transfer Dur-ing Film Condensation in Pipes, Int. J. Heat Mass Transfer, vol. 22, pp. 547–556, 1979.
[5] Tovazhnyanski, L. L., and Kapustenko, P. A., Intensication of Heat and Mass Transfer in Channels of Plate Condensers,
Chem. Eng. Commun., vol. 31, pp. 351–366, 1984.
[6] Thonon, B., Vidil, R., and Marvillet, C., Recent Research and Developments in Plate Heat Exchangers, J. Enhanced Heat
Transfer, vol. 2, no. 1–2, pp. 149–155, 1999.
[7] Di-an, L., and Yongren, L., Steam Condensation in a Verti-cal Corrugated Duct, Proc. 1988 Natl. Heat Transfer Conf., HTD-Vol 96, vol. 2, pp. 389–393, 1988.
[8] Wang, Z.-Z., and Zhao, Z.-N., Analysis of Performance of Steam Condensation Heat Transfer and Pressure Drop in Plate Condensers, Heat Transfer Eng., vol. 14, no. 4, pp. 32–41,
1993.
[9] Wang, L., Christensen, R., and Sunden, B., Analysis of Steam Condensation Heat Transfer in Plate Heat Exchangers, in G. P. Celata, P. Di Marco, and R. K. Shah (Ed.), Two-Phase
Flow Modelling and Experimentation, pp. 375–380, Edizioni ETS, Pisa, Italy, 1999.
[10] Wang, L., Christensen, R., and Sunden, B., Calculation Pro-cedure for Steam Condensation in Plate Heat Exchangers, in
Compact Heat Exchangers and Enhancement Technology for the Process Industries, pp. 479–484, Begell House, New York, 1999.
[11] Palm, B., and Thonon, B., Thermal and Hydraulic Per-formances of Compact Heat Exchangers for Refrigeration
Systems, in Compact Heat Exchangers and Enhancement
Technology for the Process Industry, ed. R. K. Shah, pp. 455–
462, Begell House, New York, 1999.
[12] Panchal, C. B., and Rabas, T. J., Thermal Performance of Ad-vanced Heat Exchanger for Ammonia Refrigeration Systems,
Heat Transfer Eng., vol. 14, no. 4, pp. 42–57, 1993.
[13] Kumar, H., The Design of Plate Heat Exchangers for Refrig-erants, Proc. Inst. Refrig., 1991-92.5-1, 1992.
[14] Navarro, J. M., and Bailly, A., Compact Brazed Plate Heat Exchangers, in Heat Exchanger Technology: Recent
Develop-ments, ed. C. Marvillet, pp. 276–283, Elsevier, Paris, France, 1994.
[15] Chopard, F., Marvillet, C., and Pantaloni, J., Assessment of Heat Transfer Performance of Rectangular Channel Geome-tries: Implication on Refrigerant Evaporator and Condenser Design, Proc. First European Conf. on Thermal Sciences, IChemE, no. 129, vol. 1, 1992.
[16] Arman, B., and Rabas, T., Condensation Analysis for Plate and Frame Heat Exchangers, HTD-Vol 314, Natl. Heat Transfer
Conf., vol. 12, pp. 97–104, ASME, New York, 1995. [17] Yan, Y.-Y., Liao, H.-S., and Lin, T.-F., Condensation Heat
Transfer and Pressure Drop of Refrigerant R-134a in a Plate Heat Exchanger, Int. J. Heat Mass Transfer, vol. 42, pp. 993–
1006, 1998.
[18] Srinavasan, V., and Shah, R. K., Condensation in Compact Heat Exchangers, J. Enhanced Heat Transfer, vol. 34, pp. 237–256,
1997.
[19] Silver, L., Gas Cooling with Aqueous Condensation, Trans.
Inst. Chem. Eng., vol. 25, pp. 30–42, 1947.
[20] Bell, K. J., and Ghaly, M. A., An Approximate General-ized Design Method for Multicomponent /Partial Condensa-tion, AICHE., Symp. Ser., vol. 39, no. 131, pp. 72–79, 1972.


![Figure 13 Comparison of condensation enhancement factors using butane with condensation correlations (F B-K , Boyko-Kruzhilin [3];](https://thumb-eu.123doks.com/thumbv2/123doknet/13381848.404725/12.846.168.674.71.508/figure-comparison-condensation-enhancement-factors-condensation-correlations-kruzhilin.webp)

