HAL Id: pastel-00780958
https://pastel.archives-ouvertes.fr/pastel-00780958
Submitted on 25 Jan 2013
HAL is a multi-disciplinary open access archive for the deposit and dissemination of sci-entific research documents, whether they are pub-lished or not. The documents may come from teaching and research institutions in France or abroad, or from public or private research centers.
L’archive ouverte pluridisciplinaire HAL, est destinée au dépôt et à la diffusion de documents scientifiques de niveau recherche, publiés ou non, émanant des établissements d’enseignement et de recherche français ou étrangers, des laboratoires publics ou privés.
during composting process of french organic wastes and
chinese polluted soil
Yuan Zhang
To cite this version:
Yuan Zhang. Modelling the dynamic of organic micropollutants during composting process of french organic wastes and chinese polluted soil. Sociology. AgroParisTech, 2011. English. �NNT : 2011AGPT0069�. �pastel-00780958�
AgroParisTech INRA-EGC
présentée et soutenue publiquement par
Yuan ZHANG
4 novembre, 2011
Modelling the dynamic of organic micro-pollutants during composting
process of French organic wastes : Application for bioremediation of
Chinese polluted soil
Doctorat ParisTech
T H È S E
pour obtenir le grade de docteur délivré par
L’Institut des Sciences et Industries
du Vivant e
t de l’Environnement
(AgroParisTech)
Spécialité : Science de l
’environment
Directeur de thèse : Patricia GARNIER & Yong-Guan ZHU Co-encadrement de la thèse : Sabine HOUOT
Jury
M. Yves COQUET, Professeur, AgroParisTech Examinateur
M. Kai-Song ZHANG, Professeur, IUE-CAS Examinateur
M. Chao-Xiang LIU, Professeur, IUE-CAS Examinateur
M. Tian-Ling ZHENG, Professeur, Xiamen University Examinateur
M. Chang-Zhou YAN, Professeur, IUE-CAS Examinateur
M. Wen-Sui LUO, Professeur, IUE-CAS Rapporteur
M. Zong-Ze SHAO, Professeur, Third institute of Oceanography Rapporteur
M. Yong-Guan ZHU, Professeur, IUE-CAS Directeur (Partie Chine)
Mme. Patricia GARNIER, CR, INRA-EGC Directeur (Partie France)
ACKNOWLEDGEMENT
The realization of my PHD could not be possible without the supports and the generosities from a great number of persons. I make firstly a point of thanking very sincerely to Ms. Patricia GARNIER and Mr. Yongguan ZHU, who in charge of me in France and in China respectively, for the relevance of their advices and the confidence that they invested in me, as well as their great help during my whole PHD period. Thanks to Ms. Francois LAUNAY and Corinnes FIERS, secretary of scientific direction in l'Ecole Doctorale ABIES, for their scientific directions and her extensive supports.
I want also to make a point of expressing my gratitude towards Ms. Sabine HOUOT, responsible of Equip Soil, who gave me a lot of technical directions and experimental conveniences, Mr. Enrique BARRIUSO, director of UMR INRA-AgroParisTech EGC, where I was complete my PHD for the part of France.
I prefer to say thanks to Egide with the program PHC-PFCC, who provides me the financial support when I was in France during my PHD period.
I would like to appreciate Yves COQUET , who provides me the chance to do my Master ‟ s Degree in AgroParisTech, and who leads to enter the soil science.
I want to thanks to Gwenaelle LASHERMES, my cooperator, who gives me a lot of help not only in the aspect of study but also in the aspect of life since I did my training course in the year of 2007. I would like to appreciate Mr. Jeremy DOUBLET and Cedric FRANCOU, who provide me the database so that I can complete the calibration of our model with more convenience.
I would like to thank to Mr. Nunan NAOISE, Mr. Jean-philipe STERYER, Ms. Muriel JOLLY, Ms. Marjolaine DESCHAMPS, Valerie BERGHEAUD, Ms. Min QIAO, and Nathalie BERNET, Clement PELTRE… for their academic and technical supports during my PHD in China and in France.
I would like to thank Chunnu GENG, JingJing PENG, Xuping JIAN, Gang LI, Bo XU, and Hongbo LI …who give me a lot of help during my period of study in Xiamen.
Finally, I prefer to make a point of testifying my affection with all the persons in UMR INRA-AgroParisTech in France and at RCEES-CAS in China, who took care about me and encouraged me during my PHD period. They thus contributed to make a good experience for me.
Summary: ACKNOWLEDGEMENT ... 1 LIST OF FIGURES ... 7 LIST OF TABLES ... 12 LIST OF ABBREVIATIONS ... 13 ABSTRACT ... 15 RESUME ... 17 GENERAL INTRODUCTION... 19
CHAPTER 1 LITERATURE REVIEW ... 23
1.1 Presentation of composting ...23
1.1.1 Temperature ... 23
1.1.2 Areation (ventilation) ... 23
1.1.3 Free Air Space (FAS) ... 24
1.1.4 Moisture content ... 25
1.1.5 C/N ratio ... 26
1.1.6 pH value ... 26
1.1.7 The fate of microorganisms during the composting process... 26
1.2 Evolution of organic matter (OM) during composting ...27
1.2.1 The mesophilic phase ... 27
1.2.2 The thermophilic phase ... 27
1.2.3 The cooling phase ... 27
1.2.4 The maturation phase ... 28
1.3 Bioremediation of contaminated soil by composting ...28
1.3.1 Contaminated soil by PAHs ... 28
1.3.2. Potential bioremediation of PAH-contaminated soils by composting ... 29
1.3.3 Evolution of PAHs during composting ... 30
1.4 Modelling the dynamics of OM and OP during the composting ...31
1.4.1 Summary of environmental conditions ... 31
1.4.2 Summary of OM models ... 33
1.4.3 Summary of OP models ... 37
1.5 Objectives of the thesis ...40
1.6 References ...42
PART I: MODELING ORGANIC CARBON AND ORGANIC POLLUTANT DYNAMICS DURING COMPOSTING OF ORGANIC WASTES ... 51
CHAPTER 2: MODELLING OF ORGANIC MATTER DYNAMIC DURING THE COMPOSTING PROCESS ... 52
2.1 Abstract ...52
2.2 Introduction ...53
2.3 Materials and Methods ...54
2.3.1 The model ... 54
2.3.2 Data acquisition for the model calibration ... 58
2.3.3 Calibration and evaluation of the model ... 60
2.4 Results and Discussion ...63
2.4.1 Estimation of model parameters ... 63
2.4.2 Evaluation of calibrated model ... 67
2.4.3 Sensitivity analysis ... 73
2.5 Conclusion ...75
2.6 Acknowledgements ...76
CHAPTER 3: A MODEL COUPLING ORGANIC CARBON AND ORGANIC POLLUTANT DYNAMICS DURING COMPOSTING ... 81
3.1 Abstract ...81
3.2 Introduction ...82
3.3 Description of the COP_Compost model ...83
3.3.1 Organic C module ... 83
3.3.2 Organic pollutant module... 86
3.3.3 Model coupling OC and OP modules ... 86
3.4 Data acquisition for model calibration and evaluation ...87
3.4.1 Data acquisition for calibration and evaluation of the OC module ... 87
3.4.2 Data acquisition for OP module calibration ... 88
3.4.3 Data acquisition for the coupling between OC and OP modules ... 89
3.5 Model calibration and evaluation ...89
3.5.1 Calibration and evaluation of the OC module ... 89
3.5.2 Calibration and evaluation of the OP module ... 91
3.6 Results and discussion ...92
3.6.1 Calibration of the OC module ... 92
3.6.2 Evaluation of the OC module ... 93
3.6.3 Calibration of the OPs module ... 96
3.7 Conclusions ...101
3.8 Acknowledgements ...102
3.9 References ...103
CHAPTER 4: SENSITIVITY ANALYSIS OF COP_COMPOST MODEL FOR THE DEGRADATION OF ORGANIC MICROPOLLUTANTS DURING COMPOSTING PROCESS ... 107
4.1 Abstract ...107
4.3 Materials and methods ...109
4.3.1 Presentation of COP_Compost model ... 109
4.3.2 Software / Interface (MATLAB & Excel) ... 112
4.3.3 Experimental Data for model calibration and evaluation ... 115
4.3.4 Model calibration for OP module ... 117
4.3.5 Sensitivity analysis ... 118
4.4 Results and discussion ... 119
4.4.1 Calibration of OP module ... 119
4.5 Sensitivity analysis ...124
4.5.1 Sensitivity of pyrene and simazine to all parameters ... 124
4.5.2 Sensitivity to initial conditions ... 126
4.6 Conclusion ...129
4.7 Acknowledgements ...130
4.8 References ...131
PART II: APPLICATION OF COP_COMPOST MODEL TO BIOREMEDIATION OF PAH CONTAMINATED SOIL ... 135
TROUGH COMPOST ... 135
CHAPTER 5: REMEDIATION OF POLYCYCLIC AROMATIC HYDROCARBON (PAH) CONTAMINATED SOIL THROUGH COMPOSTING WITH FRESH ORGANIC WASTES ... 136
5.1 Abstract ...136
5.2 Introduction ...137
5.3 Materials and methods ...138
5.3.1 Experimental design ... 138
5.3.2 Contaminated soil ... 139
5.3.3 Mixture of wastes... 139
5.3.4 Initial soil/waste mixtures... 139
5.3.5 Specific added microorganisms ... 140
5.3.6 Bioreactors ... 140
5.3.7 Temperature and moisture ... 141
5.3.8 Sample collection ... 141
5.3.9 Organic matter analysis ... 142
5.3.10 PAHs analysis ... 142
5.3.11 PAH sorption ... 143
5.3.12 PLFA analysis ... 144
5.3.13 Statistical analysis ... 144
5.4 Results & Discussion...145
5.4.1 Dry mass ... 145
5.4.2 Organic matter analysis ... 146
5.4.4 PLFA profiling ... 150
5.5 Conclusion ...153
5.6 Acknowledgements ...154
5.7 References ...155
CHAPTER 6: MODELLING REMEDIATION OF POLYCYCLIC AROMATIC HYDROCARBON (PAH) CONTAMINATED SOIL THROUGH COMPOSTING WITH COP-COMPOST MODEL .... 161
6.1 Materials and Methods ...161
6.1.1 Contaminated soil ... 161
6.1.2 Mixture of wastes... 161
6.1.3 Initial soil/waste mixtures... 161
6.1.4 Bioreactors ... 162
6.1.5 Temperature and moisture ... 162
6.1.6 Sample collection ... 162
6.1.7 Organic matter analysis ... 163
6.1.8 PAHs analysis ... 163
6.1.9 PAH sorption ... 164
6.1.10 Statistical analysis ... 164
6.1.11 COP_Compost model ... 165
6.1.12 Model application ... 167
6.2 Data acquisition for model simulation...167
6.2.1 Organic matter analysis ... 167
6.2.2 Organic micro-pollutant analysis ... 168
6.3 Results and discussion ...170
6.3.1 OM simulation ... 170
6.3.2 OP simulation ... 171
6.3.2.2 Simulations with coupling model ... 173
PART III: GENERAL CONCLUSION AND PERSPECTIVES ... 177
LIST OF FIGURES
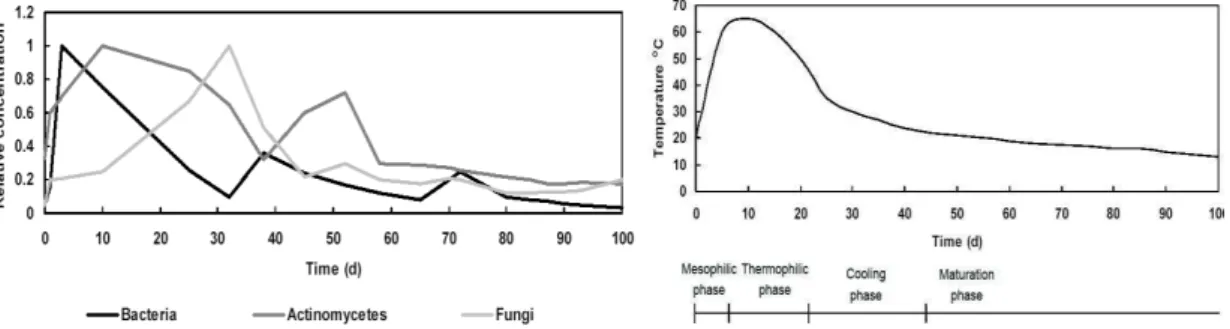
Figure 1.1_A): Microbial succession during the composting process (Epstein, 1997)
1.1_B): Idealized temperature variation in the compost during the composting process
Figure 1.2: Model describing the flux of C and N in the course OM decompositionin
the field of soil: Model STICS (Nicolardot et al., 2001)
Figure 1.3: Schematic Representation of ADM1 model: conversion of a process of
the anaerobic digestion (Batstone et al., 2002)
Figure 1.4: Schema of the model of Kasier (1996)
Figure 1.5: Multi-compartiment model (Xue and Selim, 1995; Shelton and Doherty,
1997)
Figure 1.6: Model of Saffih-Hdadi (2003)
Figure 2.1: General schema of the composting model of organic matter
Figure 2.2: Van Soest biochemical fractions of the initial composting mixtures used
for model calibration and validation (Francou et al., 2008; Doublet et al., 2011). R1 to R6 are mixtures based on green waste (Francou et al., 2008); P1 to P6 mixtures are based on sewage sludge (Doublet et al., 2011). Mixtures marked with a "C" constituted the calibration dataset, and those marked with a "V" were randomly selected to constitute the validation dataset.
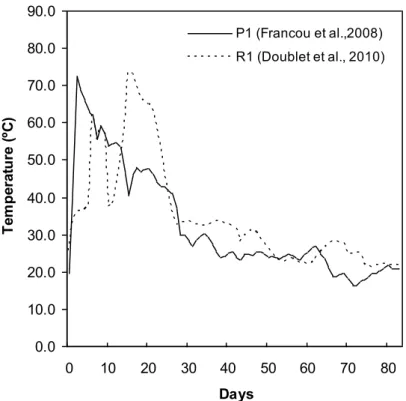
Figure 2.3: The evolution of the temperature during the composting process for P1
(Doublet, 2008) and R1 (Francou, 2003).
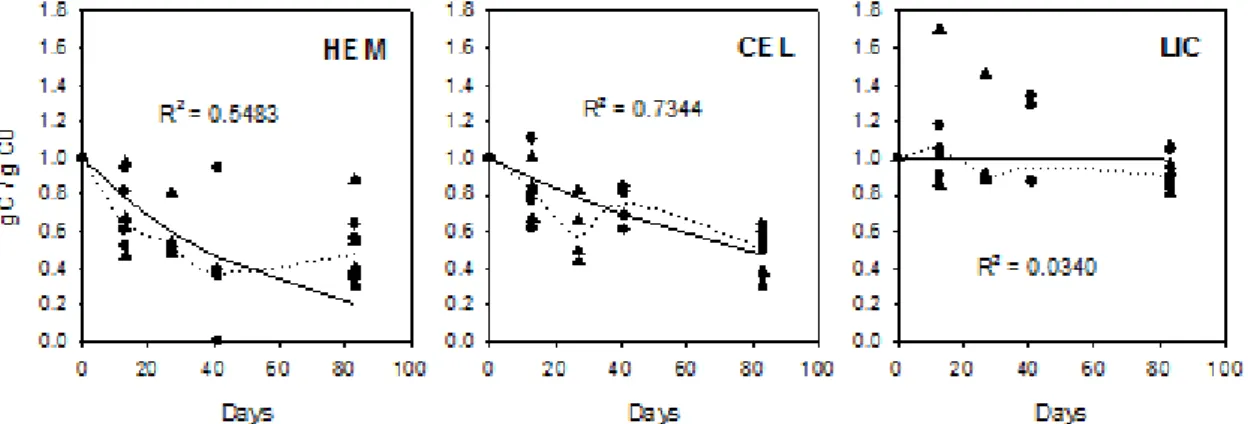
Figure 2.4: Experimental evolutions of the HEM, CEL and LIC fractions during the
eight composting experiments of the calibration dataset. Symbols represent experimental values; dotted lines represent experimental medians. Solid lines represent the simulated evolutions obtained with first order kinetics, including the hydrolysis constants K3, K4 and K5 for the HEM, CEL and LIC, respectively.
The symbols represents the mixtures based on green waste (Francou, 2003; Francou et al., 2008); the symbols represents the mixtures based on sewage sludge (Doublet et al., 2011).
Figure 2.5: Example of the experimental (points) and simulated (lines) evolutions of
the SOL and H2O fractions, and the CO2 and microbial biomass during composting obtained with the calibration procedure of the model (seven parameters being fixed and six optimised for each composting experiment). In
this case, the P1 mixture displayed a median quality of fitting to the calibration dataset. Regarding SOL, the heavy black curve represents the total SOL fraction composed of SOL-S and SOL-F.
Figure 2.6: Example of the experimental (points) and simulated (lines) evolutions of
the biochemical fractions and CO2 during composting and obtained using the calibrated model (all parameters being fixed and described in Table 2.3; for the six parameters previously optimised, the mean of the optimised values was taken). In this case, the R4 mixture displayed a median quality of fitting to the validation dataset.
Figure 2.7: Comparison of observed and simulated, initial and final, biochemical composition of the composting experiments in the validation dataset. “exp_ini” expresses initial observed data of Van Soest fractions (% of TOM); “exp_final” expresses final observed data of Van Soest fractions; “simul_final” expresses final simulated data of Van Soest fractions.
Figure 2.8: Analysis of model sensitivity to the CO2 fraction for 10 model parameters (Y, umax, KS, mB, K3, YH2O, K2, K1, K5, K4).
Figure 3.1: Schematic representation of the COP-Compost model. The total OC is
divided into six pools based on biochemical fractionation. Parameters and variables are described in Table 3.1.
Figure 3.2: Experimental (symbols) and simulated (lines) data on biochemical
fractions, carbon dioxide, water, microbial biomass (simulated only), and temperature (experimental only) during composting. The simulations were obtained using the OC module. The symbols represent the mean ± standard errors of experimental values of the six composting replicates.
Figure 3.3: Relationships between experimental and simulated values of biochemical
fractions, carbon dioxide and water. Full dots: data used for OC module calibration (Mixtures P1, P2, P3, P5, R1, R3, R5, R6), empty dots and grey triangles: data used for validation (P4, P6, R2, R4 and L, respectively). The dotted line is the 1:1 line.
Figure 3.4: Experimental (symbols) and simulated (lines) data on soluble, sorbed,
non-extractable, and mineralized LAS during composting. The simulations were obtained successively with Runs A, B, C, D for compost LAS-3 which presented a median quality of fitting. Symbols represent experimental values ± standard
errors.
Figure 3.5: Relationships between experimental and simulated values for soluble,
sorbed, non-extractable and mineralized OPs for the four OPs, with Run B. The dotted line is the 1: 1 line.
Figure 3.6: Experimental and simulated distribution kinetics during the composting
of 14C between mineralized, soluble, sorbed and NER fractions, from 14C-labeled glyphosate, LAS, fluoranthene and NP applied at the beginning of composting experiments. Simulations were obtained using the proposed calibration of the model coupling OC and OPs. GLY-2, LAS-2, FLT-2, and NP-1 represent the median quality of simulations. Area plots represent simulations and hatched histograms represent experimental values.
Figure 4.1: The presentation of COP_Compost model Figure 4.2: The structure of MATLAB interface
Figure 4.3: Example of simulation (curves) of the experimental data (points) set
corresponding to the composting mixture R4 used for the evaluation of the model. The simulations were done using the average estimated parameters of Table 4.2.
Figure 4.4: Comparison between simulated results and observed data (obtained from
Hartlieb et al., 2003) for the 4 fractions (soluble, sorbed, NER and mineralised fraction) of pyrene (Fig.4-A) and simazine (Fig.4-B).
Figure 4.5: Comparison of observed data of simazine (obtained from Hartlieb et al.,
2003) and simulated results using the model with adding a specific microbial population.
Figure 4.6: Sensitivity coefficient of the different model parameters for the 4
fractions of pyrene (Fig.4.6-A) and simazine, with adding the specific microbial population (Fig.4.6-B).
Figure 4.7: The sensitivity of pyrene to the initial quality of organic matters. Initial
quantity of fraction of pyrene was: W0 (Soluble) = 4.8; S0 (Sorbed) = 91; NER0 (non extractable) = 4.6 (gC / 100g TOCi). GW+SS = mixture of P3 (Doublet, 2008); GW+BIO+P = R4 (Francou, 2003); Manure =Fumier_Bovin. GW: Green wastes; SS: Sewage sludge; BIO: biowastes; P: Papers. Figures in line A represent the organic compositions characterized by the method of Van Soest. Figures in line B are the evolution of microbial biomasses in each organic waste. Line C shows the evolution of 4 OP fractions coupled with different organic wastes.
Figure 4.8: The sensitivity of simazine to the initial quality of organic matters. Initial
quantity of fraction of pyrene was: W0 (Soluble) = 51.6; S0 (Sorbed) = 43.3; NER0 (non extractable) = 5.1 (gC / 100g TOCi). Figures in line A are the evolution of microbial biomasses in each organic waste. Line B shows the evolution of 4 OP fractions coupled with different organic wastes.
Figure 4.9: The sensitivity of each fraction (soluble, sorbed, non-extractable and
mineralized fraction) of simazine (Line A) and pyrene (Line C) to the initial quantity of microbial biomass; Line B corresponds the evolution of microbial biomass.
Figure 5.1: Design of bioreactor (volume of 1L).
Figure 5.2: Evolution of dry mass during composting for the different treatments (S,
W, SW and SWB).
Figure 5.3: Loss of carbon mass (Fig.5.3-A) and percentage of total initial organic
carbon mineralisation calculated according to the loss of carbon mass (Fig.5.3-B).
Figure 5.4: Changes of the biochemical fractions during composting in the W
treatment (100% wastes) using the Van Soest method.
Figure 5.5: Evolution of total PAHs during composting (mean ± standard deviation)
in the different treatments (S, W, SW and SWB); first order adjusted kinetics of dissipation in the SW and SWB treatments.
Figure 5.6: Evolution of small (2- and 3-rings), medium (4-rings) and large (5- and
6-rings) PAHs concentrations in soil during composting.
Figure 5.7: (5.7-A) Organic carbon-normalisaed sorption coefficient of FLT and PHE
in initial soil, waste and soil-waste mixtures; (5.7-B) Evolution of Organic carbon-normalisaed sorption coefficient during composting in the soil-waste mixture (SW treatment). Different letters (a, b and c) within rows are significantly different (p < 0.05) according to one way-ANOVA analysis.
Figure 5.8: Principal component analysis of PLFA data. PC1 & PC2 represents
different dates of composting course. Principal component 1 (PC1) explained 68.1% of the variation, while PC2 explained 14.5%. : Experimental data of Treatment S; : Data of Treatment W; : Data of Treatment SW; : Data of Treatment SWB. Different colours represented data with different date. Black = Day 0; Deep gray = Day 14; Gray = Day 35; Black circle = Day 42 and Gray
circle = Day 60.
Figure 5.9: G+/G- (Fig.5.9-A) and Fungal/Bacterial PLFA ratio (Fig.5.9-B) in
different treatments during composting process.
Figure 6.1: Schematical presentation for COP_Compost model
Figure 6.2: Evolution of Van Soest fractions after 60 days of composting Figure 6.3: Evolution of 16 USEPA-PAHs concentration during composting Figure 6.4: Evolution of Kd value for FLT and PHE
Figure 6.5: Comparison between simulated and observed dataset for the end of
composting (Curve: Simulated data; Points: Observed data)
Figure 6.6: Relationships between experimental and simulated values for soluble,
sorbed, non-extractable (NER) and mineralized fraction (14C-CO2) of FLT, with Test A and B. The first line corresponds test A and second line represent test B.
Figure 6.7: Relationships between experimental and simulated values for soluble,
sorbed, non-extractable (NER) and mineralized fraction (14C-CO2) of PHE, with Test A and B. The first line corresponds test A and second line represent test B.
Figure 6.8: Relationships between experimental and simulated values for soluble,
sorbed, non-extractable (NER) and mineralized fraction (14C-CO2) of FLT, with the coupling model. The first line corresponds Test A and second line represents Test B.
Figure 6.9: Relationships between experimental and simulated values for soluble,
sorbed, non-extractable (NER) and mineralized fraction (14C-CO2) of PHE, with the coupling model. The first line corresponds Test A and second line represents Test B.
LIST OF TABLES
Table 1.1: The different functions of temperature
Table 1.2: Organic matter modelling in the field of soil and composting
Table 1.3: Comparisons between the OM model in soil and during composting Table 1.4: Three orders of the microbial growth
Table 1.5: Summary of OP models
Table 1.6: The equations for model of Saffih-Hdadi (2003) Table 2.1: Used Petersen‟s matrix (1965) for composting model
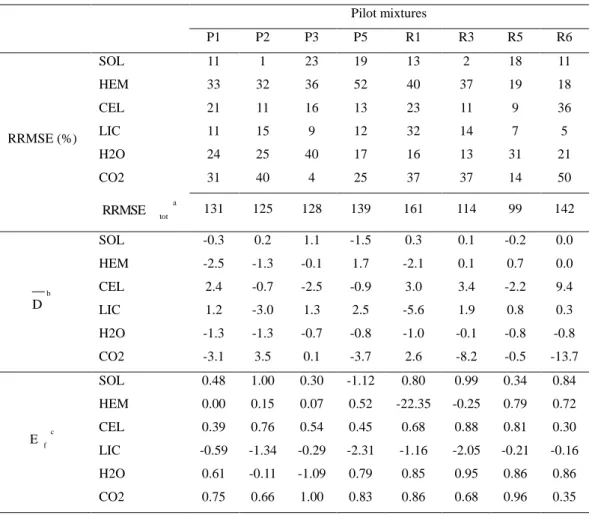
Table 2.2: Modelling Efficiency during the calibration stage using the eight data set
of composting P1, P2, P3, P5, R1, R3, R5 and R6
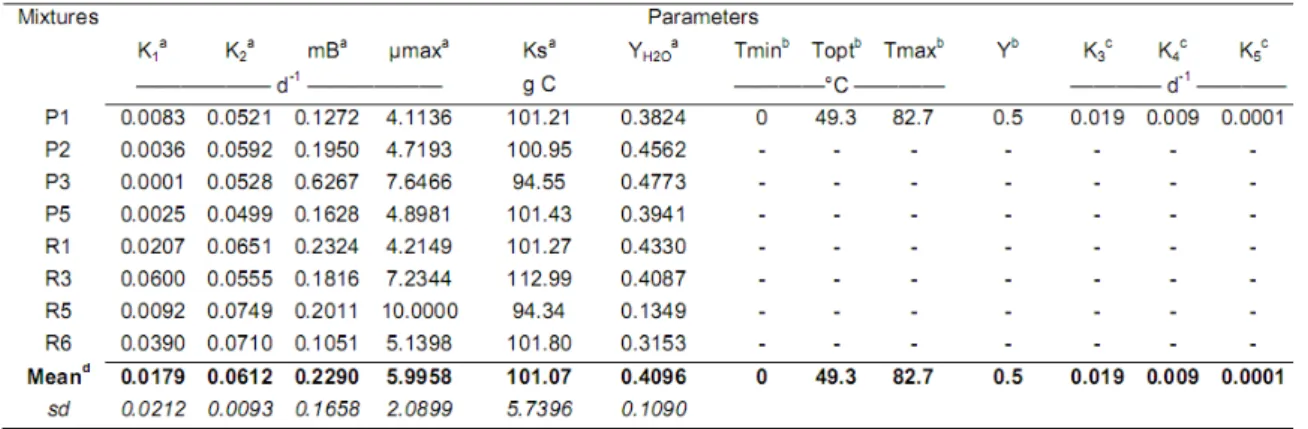
Table 2.3: Parameter values taken from the literature, estimated with the calibration
procedure and used in the calibrated model. The parameter values used in the calibrated model are highlighted.
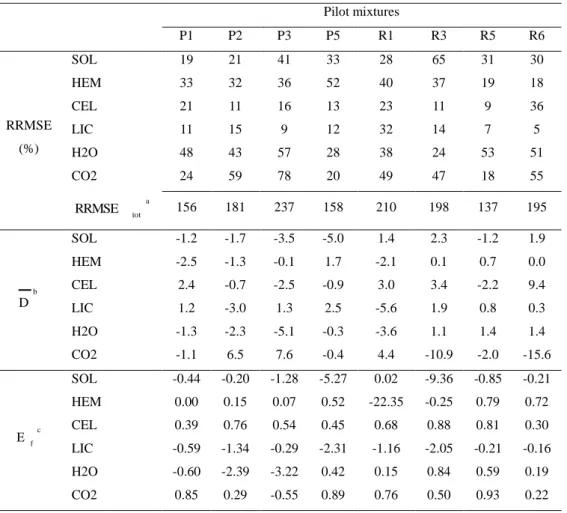
Table 2.4: Statistics to evaluate the calibrated model. The eight composting
experiments (P1, P2, P3, P5, R1, R3, R5 and R6) of the calibration dataset were used.
Table 3.1: Variables and parameters in the COP-Compost model
Table 3.2: Statistical evaluation of the goodness-of-fit of the OC module
Table 3.3: Parameter values and evaluation statistics of OP simulations of Runs A, B,
C, and D for the four OPs (units are given in Table 3.1).
Table 3.4: Statistical evaluation of model efficiency in the simulations obtained using
the model coupling OC and OP modules, and with Run B.
Table 4.1: Equations for OP module
Table 4.2: Variables and parameters in the COP-Compost model
Table 4.3: Parameter values and evaluation statistics of OP simulations (units given in
Table 4.2)
Table 5.1: Small, medium and large PAHs removal percentage for Treatment SW and
SWB
Table 6.1: Statistical evaluation of the goodness-of-fit of the OC module
Table 6.2: The parameters applied in the OP module for simulating the observed data Table 6.3: Statistical evaluation of the goodness-of-fit of the OP module
LIST OF ABBREVIATIONS
DM = Dry mass FLT = Fluoranthene GLY = Glyphosate
LAS = Sodium linear alkylbenzene sulfonate NP = Nonyphenols
OM = Organic Matter OP = Organic pollutant
PAH = Polycyclic aromatic hydrocarbon PHE = Phenanthrene
TOC = Total organic matter
Variables of COP_Compost model / biochemical fractions
H2O = organic C soluble in hot water SOL = soluble fraction in neutral detergent
SOL-S = Proportion of organic C in the soluble fraction in neutral detergent with slow degradation (pool Ci=1)
SOL-F = Proportion of organic C in the soluble fraction in neutral detergent with fast degradation (pool Ci=2)
HEM = Hemicellulose (pool Ci=3) CEL = Cellulose (pool Ci=4) LIC = Lignin (pool Ci=5) X = Microbial biomass W = Soluble OP in water
S = Sorbed OP extracted with solvent
Parameters of COP_Compost model
K1 = Hydrolysis constant of pool Ci=1 (SOL-S) K2 = Hydrolysis constant of pool Ci=2 (SOL-F)
K3 = Hydrolysis constant of pool Ci=3 (HEM) K4 = = Hydrolysis constant of pool Ci=4 (CEL) K5 = Hydrolysis constant of pool Ci=5 (LIC)
Y = Assimilation yield of the available OC for microbial biomass µmax = Maximal specific growth rate for microbial biomass Ks = Saturation constant for Monod kinetic
Tmin = Minimum temperature for microbial growth Tmax = Maximum temperature for microbial growth Topt = Optimum temperature for microbial growth mB = Death constant for microbial biomass
Ymcs = Availability yield for dead microbial biomass Kd = Sorption coefficient of organic C
Kd1 = Sorption coefficient of Ci=1 (SOL-S) Kd2 = Sorption coefficient of Ci=2 (SOL-F) Kd3 = Sorption coefficient of Ci=3 (HEM) Kd4 = Sorption coefficient of Ci=4 (CEL) Kd5 = Sorption coefficient of Ci=5 (LIC) Fr = Non-extractable residue formation rate dr = OP degradation rate
ABSTRACT
With the increasing of people‟s living standards, more and more urban wastes are produced everyday with a huge quantity. The big amount of wastes have not only occupied precious land resource, influenced the industry seriously and agricultural production, but also introduced various pollutants, which will harm human's life and health. Compost processing can help urban wastes to be recycled by transforming the organic matter into fertilizer and be returned to nature. Also it can be used as a bioremediation method for the polluted soil. The mathematical model is an efficient tool for understanding and modifying the composting process, predicting the stability of compost products, and then assuring the harmfulness of pollutants for agriculture. Our objective in this study was to construct a model describing the dynamics of organic micro-pollutants during the composting and parameterize the model under the interface of MATLAB. This model should be used according to users‟ needs with 3 modules: organic carbon module, organic pollutants module and coupling module. In order to calibrate and validate our model, the datasets from 12 different waste mixtures and 2 different types of pollutants with different initial conditions were applied. On the other hand, for applying the composting technique in the field of bioremediation of contaminated soil, an in-vessel composting experiment was designed in which the organic urban wastes mixed with soil contaminated by PAHs were used as materials. We studied the dynamics of organic matter, organic micro-pollutants and the microbial populations. The conclusion showed that the concentration of PAHs could be decrease by 50-60% with the effects of organic matters and the accelerated microbial activities compared to bare soil. Furthermore, the successive microbial populations have been observed during the composting process. These experimental results could be well simulated by our model which indicates its capacity in the soil-composting system.
However, we still came across some questions during my research. The simulations for soluble organic substrates were not accurate enough, due to the limits of the biochemical characterization of organic fractions. In our model, only the function of temperature has been considered as the environmental factor, more limiting factors such as moisture, oxygen, … need to be investigated in the further studies. The microbial diversity of each decomposition phase has been investigated in the experiment but was not added in the model because its impact on PAHs degradation is not clear enough. In order to answer all these questions, further researches needs to be done, although the study in the field of microbial flora has begun to be carried out.
RESUME
Avec l'augmentation de niveau de vie des populations, de plus en plus déchets urbains sont produits chaque jour en grande quantité. Ces déchets non seulement occupent une place importante mais dégradent l‟environnement en particulier parce qu‟ils contiennent divers polluants, qui peuvent porter atteinte à la santé humaine. Le compostage permet aux déchets urbains d‟être recyclés en transformant la matière organique en engrais pour les sols agricoles. Par ailleurs, ce procédé peut aussi être utilisé comme méthode de biorestauration pour les sols pollués. Les modèles mathématiques sont des outils qui permettent de comprendre et éventuellement de modifier le processus de compostage. Ils pourraient également prédire la stabilité des produits issus du compostage et quantifier la nocivité des polluants qu‟ils contiennent. L‟objectif dans cette étude était de construire un modèle décrivant la dynamique des micropolluants organiques au cours du compostage et paramétrer le modèle sous l'interface de MATLAB. Ce modèle peut être utilisé selon les besoins des usagers avec 3 modules: le module de carbone organique, le module de polluants organiques et le module de couplage. Afin de calibrer et valider notre modèle, un ensemble de données de 12 différents mélanges de déchets et 4 différents types de polluants ont été utilisés. Pour l'application de la technique de compostage dans le domaine de la bioremédiation des sols contaminés, une expérience de compostage en laboratoire a été conçue dans lequel les déchets urbains organiques ont été mélangés avec un sol contaminé par des HAP. Nous avons étudié la dynamique des matières organiques, des micropolluants organiques et des populations microbiennes. Les résultats ont montré que la quantité des HAP dégradée a été de 50-60% lorsque le sol est composté avec des déchets organiques. En outre, des populations microbiennes successives ont été observées pendant le processus de compostage. Ces résultats expérimentaux ont été simulés par notre modèle afin de tester sa capacité dans un système sol-compostage.
Cependant, quelques questions de recherches se posent encore: en ce qui concerne la modélisation, la simulation des substrats organiques solubles n'est pas assez bonne, ce qui est probablement dû à des limites sur l'étude des caractéristiques biochimiques des fractions organiques soluble; par ailleurs, seule la fonction température a été considérée comme facteur de l'environnement dans notre modèle, des limitations dues à l‟l'humidité ou à l'oxygène, par exemple, doivent être étudiées dans des études ultérieures. L'activité microbienne pendant chaque phase de dégradation des HAPs n'a pas encore été assez clairement établie pour être incorporée dans notre modèle.
GENERAL INTRODUCTION
Municipal solid waste (MSW) refers to waste generated from householders. Due to vast population growth and urbanization, the volume of MSW produced in China has dramatically increased. For instance, about 1.1 x 10⁸ and 1.6 x 10⁸ ton of the MSW produced in China had been reported in 1995 and 2004, respectively (Ministry of Construction of China, 2005), corresponding to an increase of 45% in just a span of 10 years. By the end of 2004, a total of 661 cities had 559 MSW disposal systems in China (Ministry of Construction of China, 2005). MSW treatment is mainly carried out using three processes corresponding to three different treatment technologies: landfill (86.5%), composting (6.4%) and incineration (7.1%) (Ministry of Construction of China, 2005). However, in 2005, only 35% of landfill sites are considered safe (Fang, 2007). The rest of landfill sites are simply filled in order to dispose waste. In response, the China government has recently turned its attention to the construction of MSW treatment plants in order to address the growing problem on MSW.
In France, everyday, more and more wastes are produced along with the evolution of life style and daily consummation. On 40 years, the quantity of wastes has been doubled with an average of 360 kg per year and per person.
In the million tons of waste collected each year (Source ADEME - ITOMA 2004): - 47% were stored in discharge
- 28% incinerated with a recovery d' energy (1% without recovery of energy) - 10% sent to a biological treatment (methanisation or composting)
- 14% sorted to be recycled
On the other hand, in Europe and France, the composting of organic urban origin waste of constitutes a field of valorization largely. The household refuse recycled by composting each year in European Union countries is estimated at 32 x 106 tons (T) (European Commission, 2005) and the whole organic urban origin waste treated by
composting accounts for 5 x 10⁶ T in France (ADEME, 2006). The European policy
of management of waste (Directive 1999/31/CE) as well as the commitments concerning the French level within the framework of Grenelle of the Environment
(2007) underlines the needs for reducing the tonnage of produced waste and the part of waste which can be recycled hidden or incinerated. The valorization of waste by composting is thus thought to play an important role in the French and European strategies of waste management.
Composting is indeed a widely used biological process accepted as a bio-treatment It is a “controlled” procedure of organic components degradation (from vegetables and animals origin), due to the activity of successive microbial communities evolving in aerobic conditions (i.e. in the presence of oxygen), and leading to the development of humified and stabilized organic matter (Francou, 2008). The product is called compost and can be used as amendment in agriculture.
The composting of organic fraction of urban wastes make possible to recycle it into cultivated soils to improve soil structure and fertility. The composting process has received much attention in recent years because of pollution concerns. Since composting has been demonstrated to have an important role in processing much of the biodegradable waste and therefore is effective in biodegrading micro-pollutants like PAHs using both conventional either windrow composting systems (Amir et al., 2005; McFarland and Qiu, 1995; Atagana, 2004) or in-vessel composting system (Antizar-Ladislao et al., 2006; Sasek et al., 2003).
Soil pollution by petroleum products (organic micro-pollutants) is a widespread problem. The past decade, bioremediation techniques have been developed and improved to clean up soils polluted with hazardous chemicals (Skladany and Metting, 1992; Alexander, 1994; Romantschuk et al., 2000). Contaminated soil can be bioremediated by addition of nutrients (biostimulation), addition of microbial inocula (bioaugmentation), aeration and turning, or by a combination of these practices (Alexander, 1994). Also, the addition of organic matter to the hydrocarbon contaminated soil can be beneficial, as it is a source of co-substrates, nutrients and microorganisms, and ameliorates the structure and water-retaining capacity of the soil (Alexander, 1994). Therefore, an increasing number of studies have considered the composting technique as a bioremediation method for contaminated soil.
Due to the great diversity of the organic wastes recycled by composting and organic pollutants (OPs) detected in the composts, modeling is a privileged method to
highlight the generic processes interacting in the fate of OPs. However, no model describing the fate of OPs in the course of composting was proposed in the literature. Moreover, it‟s necessary to describe the availability of OPs during composting and in the final composts by taking into account of the mechanisms of interaction between OPs and the organic matter. While great majority of the composting models were developed to simulate the production of heat and the mass loss during the composting process (Mason, 2006). Few models were proposed to describe their transformations of the organic matter and the evolution of its degradability (Kaiser, 1996; Sole-Mauri et al., 2007). These models however have the advantages: on one hand, they propose the description of the biochemical properties of the organic matter in the course of composting, whose evolution is likely to condition the sorption of OPs, and on the other hand, they can simulate the dynamics of the microbial biomass, which likely influence the fate of OPs. No model simulating the dynamics of OPs during composting was found in the literature. However, many models with compartments were developed to simulate the processes of evolution of the pesticides by explicitly taking into account the mechanisms of stabilization and the formation of bound residues. These models are necessary to evaluate the risks in long-term associated with the use of composts in agriculture (Saffih-Hdadi et al., 2003).
Therefore, the objective of my PHD was to build a new dynamic model for composting process to simulate the interactions between organic matters evolution and organic micro-pollutants behaviour taking into account the microbial activities, to evaluate the model with existing data (from French lab) of organic wastes composting and the in-vessel composting experiment results that I have got. The finally objective was to apply our constructed model to the bioremediation of polluted soils in China. Initiated in September 2008, this French-Chinese cotutelle thesis was financed by Egide (the Foreign Affairs of French Ministry) and by the Department Environment and Agronomy of the INRA (National institute of the Agronomic research) for the part in France. The part in China was financed by the Institut of Urban Environment (Chinese Academy of Sciences) for the Chinese part. The experimental part of the thesis was financed by the CRPE (Research centre on the Cleanliness and the Energy of the Veolia Environnement group). My thesis was directed by Patricia GARNIER and Yong-Guan ZHU, co-advisor was Sabine HOUOT.
This memory comprises a literature review (Chapter I) with a first part describing the process of composting and the transformations of the organic matter which take place during this mode of biological treatment. It also gives an overall picture of the accessible informations in the literature on the contents of OPs of the independent groups detected in the composts and to become to them during composting. The state of the art concerning the modeling of becoming of OPs during composting is also presented. This synthesis leads to the presentation of the specific objectives of this thesis and the presentation of the steps adopted for this work. The manuscript is then composed of 5 chapters (chapters II to VI) presenting the manuscripts of the scientific publications resulting from this work of thesis. A general conclusion and the prospects are given at the end for the report.
CHAPTER 1 LITERATURE REVIEW
1.1 Presentation of composting
Composting is defined basically as biological processes occurring in favourable conditions (good aeration, moisture, etc.) and allowed to transform the raw initial material probably unsanitary or with phytotoxic properties to stable and mature end product(Liang et al., 2003). Thus considerable e ort has been directed toward determining the impact of various environmental variables on composting (Schulze, 1961; Suler and Finstein, 1977; Rao et al., 1996). These variables include temperature, moisture content, aeration, nutrient balance, bulking agents, and substrate.
1.1.1 Temperature
The aerobic degradation of organic substrates leads to the increase of temperature that can reach 70-80ºC maximum. On the function of temperature, the composting process follows mesophilic, thermophilic, cooling and maturation phases with a succession of microbial populations (see Fig.1.1).
The distribution of active microorganisms is dictated by the temperature of compost. The rise of temperature permits partial cleansing by the destruction of pathogenic germs, animal parasites, the seeds and bodies of propagation of the plants. If the temperature is too high, it can involve an excessive drying of compost and cause a deceleration of activity of the micro-organisms.
1.1.2 Areation (ventilation)
The matrix of compost is a network constituted of solid particles and interstices of sizes variable which can be filled with water, air or both. The aeration permits to
Figure 1.1_A): Microbial succession during the composting process (Epstein, 1997) 1.1_B): Idealized temperature variation in the compost during the composting process
import oxygen essential to the metabolism of the micro-organisms, however, while the interstices are filled with water, the diffusion of oxygen is not possible. The balance between moisture and ventilation is necessary for the progress of composting. Hamelers (1992) analysed the influence of oxygen content and oxygen intake on the degradation of four different organic matters. Haug (1993) also introduced the model which simulated organic matter degradation with a variable of gas discharge rate.
pa rticle O k O Vol K O Vol k 2 0 2 % % 2 (Xi et al., 2005) [1]
Where Vol%O2 represents the percentage of oxygen volume, kparticle is a constant (its value varies from 0 to 1), the value of kparticle will ajust according to the compost particlesize.
1.1.3 Free Air Space (FAS)
Free Air Space (FAS %) place an important role during the composting process, because of its transportation with oxygen. The correct function about FAS is as below
23.675 3.4945 FAS 1 1 FAS e k (Haug, 1993) [2]
Water can take the pore space among the composting materials, and then influence the structure so as to reduce the porosity. Therefore, the change of moisture will transform the porosity, air exchange rate and the capacity of oxygen supply(Miller et al., 1986) to a great extent. The compost humidity has a close relationship with the porosity and FAS, Golueke et al.(1953) have established the relationship between humidity and porosity. Generally, the higher the humidity is, the bigger FAS the composts need. But when the humidity is larger than 60%, FAS will limit compost processing. Moreover,
according to the oxygen consumption rate in the composting process, when FAS is 30%~36%, the organic matter degradation ability of microorganisms is the strongest and when FAS is smaller than 28%, compost ventilation performance drop (Jeris, 1973):. Therefore, to reduce the restriction of composting process, FAS in piles must be bigger than 28%.
1.1.4 Moisture content
The moisture in the matrix of compost is necessary for microbial activities. The optimal moisture for composting is generally located between 50% - 80% of the total gross mass (Richard et al., 2002). During composting, there is production of water at the time of degradation of OM and drainage under the combined action of ventilation and rise of temperature. To compensate for an excessive water loss which limits the microbial activities, a watering of composts is usually realised.
The moisture and oxygen contents are two important environmental factors, that needs to be controlled during management of the composting process. Controlling the moisture content in compost on one hand is to strengthen the microbial activity, on the other hand is to the permit sufficient oxygen supply. The moisture content is very important for the degradation process, and the water pressure is one of the most common limiting factors for the microbial activities in the solid dielectric (Smith, 1978; Griffin, 1981). Low moisture content will limit the microbial activity, so as to stop the physical proliferation. While too high moisture content will cause the anaerobic composting occurs. The oversized humidity will increase the molecular film thickness and cause the interspaces to be much smaller among molecules, thus influence oxygen transportation (Hamelers, 1992; Tseng et al., 1995) An excess humidity will affect the oxygen distribution and the proliferation in the compost piles, the hydrodynamic force function as well as the change of microbial growth rate and then influence biodegradation rate. The insufficient oxygen will reduce degradation of organic matter (Richard and Walker, 1999) and will increase the anaerobic gas emissions (Haug, 1993; Epstein, 1997).
In the field of composting, the humidity revision function is paid attention by many researchers, for example, Haug discovered that the following equation which adapts in the biological solid composting process:
1 1 ] 062 . 7 ) 1 ( 64 . 17 [ 2 moisturefr a ction O H e k (Haug, 1993) [3]
Moreover, Stombaugh and Nokes (1996) also proposed a set of equations to describe the moisture evolution during the composting process:
m m k m m m m m k m m m k O H O H O H 3 3 2 2 2 1 0 . 1 0 . 1 0 . 0 2 2 2 .) ( / 4 . 0 .) ( / 2 . 0 .) -( / 0 3 2 1 wt wet kg kg m wt wet kg kg m wt wet kg kg m [4] 1.1.5 C/N ratio
The composting substrate is the source of nutrients for the micro-organisms. According to its composition in nutrients, microbial activities adjust on the limiting factors. The balance is particularly important for the major elements: C, N, P, K, S. It seems that C/N between 25 and 40 satisfies composting. The C/N decreases during composting to reach at the final value between 8 and 25. If C/N is too low, the microbiological degradation leads to the formation of excessive ammonia, which will increase the pH and the volatilisation of ammonia. On the contrary, if it is too high, the procedure is limited in nitrogen, which can lead to the formation of acid and make the pH drop, thus stop the microbial activities.
1.1.6 pH value
Generally the pH of green wastes is between 5 and 9 (Morel et al., 1986). According to the literatures, the acidity of wastes appears to have no limit for the procedure of composting.
All in all, initial wastes have acidity slightly stronger than the finished composts. But many work highlighted a phase of acidification at the beginning of composting. This phase of acidification is mainly due to the anaerobic production of organic acids and the immobilization of ammonium in the microbial biomass during the mesophilic phase. Then, during the thermophilic phase, the organic acids are degraded involving an alkalisation of the compost, phenomenon accentuated by the mineralisation of nitrogen.
1.1.7 The fate of microorganisms during the composting process
powder-like colonies. Both actinomycetes and fungi are relatively slow growing organisms that are less tolerant of low oxygen concentrations and high temperatures compared to the bacteria. The microbial populations and the temperature in the compost often follow a specific pattern dictated by the degradation of compounds in the organic matter. The composting process can be divided into four phases.
1.2 Evolution of organic matter (OM) during composting
The theoretical evolution of the temperature within the compost during composting makes it possible to define four successive phases, related to the activity of the various microbial populations.
1.2.1 The mesophilic phase
Easily biodegradable OM involves a strong microbial activity generating a strong production of heat and a fast rise of the temperature in the middle of the compost. The present micro-organisms are primarily bacteria, no-actinomycetes, as well as fungi (Vergé-Leviel, 2001).
1.2.2 The thermophilic phase
Very quickly the temperature reaches values 60°C even 75°C. Only the heat-resisting micro-organisms can survive these high temperatures. This phase is characterized by the presence of actinomycetes and thermophilous nonfilamentous bacteria. The mushrooms disappear beyond 60°C or survive in the form of spores. During this phase, a big part of OM is lost under the form of carbon dioxide CO2 and a draining of the compost related to the evaporation of water occurs. The phase of fermentation corresponds primarily to the degradation of the easily biodegradable molecules: glucides, proteins, lipids(Vergé-Leviel, 2001).
1.2.3 The cooling phase
The reduction in the quantity of easily degradable OM causes a deceleration of the microbial activity involving a cooling of compost. The mesophilic micro-organisms colonize the composting system again.
1.2.4 The maturation phase
During this last phase, the processes of humification dominate, as well as the slow degradation of the resistant compounds. This phase is characterized by the colonization of the compost by mushrooms when lignin and the cellulose become the dominant substrates. Among colonizing fungi, the filamentous fungi of the white, brown and soft rots are known for their role in the degradation of lignin and another xenobiotic related molecules (PAHs, chlorophenols…) (Vergé-Leviel, 2001). During this phase, the diversity of the metabolic micro-organisms augments. This phase lasts until the use of the composts.
1.3 Bioremediation of contaminated soil by composting 1.3.1 Contaminated soil by PAHs
Soil pollution by petroleum products which contain high concentration of PAHs is a widespread problem. Polycyclic aromatic hydrocarbons (PAHs) are hydrocarbons that contain at least two fused benzene rings in linear, angular, or cluster arrangements. PAHs in the molecular weight range between naphthalene (128.16) and coronene (300.36) are of environmental concern (Ashok and Saxena, 1995). Many PAHs are stable and persistent in the environment and toxic. PAHs are common by products formed either by thermal alteration of buried organic matter (petrogenic) or by incomplete combustion of organic matter (pyrogenic) (Suess, 1976; Sims and Overcash, 1983; Nikolaou et al., 1984).
PAHs also exhibit extraordinary structural diversity. The number of possible PAH isomer is large and it expands rapidly as the number of rings and alkylations increase. However, not all the possible PAHs exist because of the low conformational stability of larger ring numbers, especially for linearly fused PAHs (Harvey, 1997).
Polycyclic aromatic hydrocarbons (PAHs) are ubiquitous contaminants found in most of the processes of incomplete combustion of wood and fossil fuels (Jones and Voogt, 1999). Major sources of petrogenic PAHs also include crude oil and its refined products, coal, and oil shale (Harvey, 1997; Page et al., 1999).
smaller and unstable fragments (pyrolysis) results in the formation of free radicals with short average lifetimes. The highly reactive free radicals produce more stable and highly condensed aromatic ring systems through recombination reactions (pyrosynthesis) (Ballentine et al., 1996; Mastral and Callen, 2000).
1.3.2. Potential bioremediation of PAH-contaminated soils by composting
The Earlier studies showed that higher molecular weight PAHs remained in the soil after 16 weeks and 11 months of pilot-scale and full-scale land farming, respectively (Atagana, 2003; Atagana, 2004a). The past decade, bioremediation techniques have been developed and improved to clean up soils polluted with hazardous chemicals (Skladany and Metting, 1992; Alexander, 1994; Romantschuk et al., 2000). A promising approach to reduce PAH pollution is the utilization of the natural potential of microorganisms to utilize hydrocarbons since the bioremediation techniques are cheaper than the other alternatives (soil washing, solidification and stabilization, incineration, thermal treatment or advanced oxidation processes) used for cleaning up of contaminated sites (Clarinet, 2007).
Contaminated soil can be bioremediated by addition of nutrients (bio-stimulation), addition of microbial inocula (bioaugmentation), aeration and turning, or by a combination of these practices (Alexander, 1994). Also, the addition of organic matter to the hydrocarbon contaminated soil can be beneficial, as it is a source of co-substrates, nutrients and microorganisms, and ameliorates the structure and water-retention capacity of the soil (Alexander, 1994). When fresh organic substrates are incubated with a contaminated soil, a thermophilic phase is likely to occur and the
process is called composting. Earlier composting experiments using
hydrocarbon-contaminated soil co-composted with cow manure and mixed vegetable waste showed that more than 90% of the hydrocarbons including some of the recalcitrant components were removed (Atagana et al., 2003). Co-composting hydrocarbon-contaminated soil with poultry manure showed that PAHs could be removed from the soil by composting (Atagana, 2004b).
The composting process used to stabilise organic materials can be considered as a bioremediation process (Bollag & Bollag 1995). Numerous studies have shown that composting has an enormous potential for bioremediation through sustaining
microbial populations of a wide range of microorganisms, which are able to degrade a variety of organic contaminants at the laboratory and/or field scales (Antizar-Ladislao et al., 2005; Moretto et al., 2005; Semples et al., 2001; Lau et al., 2003). Composting has been proven to degrade PAHs, in rates that exceed 80% in some cases and require treatment time shorter than land-farming (Amir et al., 2005).
Composting strategies for soils contaminated with organic pollutants in general has been recently reviewed by Semple et al. (2001). The number of studies on composting of petroleum- contaminated soil and petroleum-based oil wastes is increasing (e.g. Beaudin et al., 1996, 1999; Al-Daher et al., 1998; Kirchmann and Ewnetu, 1998; Milne et al., 1998; Jørgensen et al., 2000; Chaw and Stoklas, 2001; Namkoong et al., 2002). Elevated temperatures stimulate hydrocarbon degradation (Atlas, 1975), and enhance the contaminant availability by increased solubility and mass transfer (Pignatello and Xing, 1996).
1.3.3 Evolution of PAHs during composting
Compost is a pool of considerable microbial diversity that can potentially serve as a source for the biological treatment of wastes by degradation, including PAHs, pesticides, and other contaminants. The PAHs are the contaminants whose evolutions during the composting were studied the most. The PAHs will be degraded partially during decomposition of OM. The term of degradation includes the PAHs mineralised, transformed in metabolites, volatilised or adsorbed on the OM of composts. The principal transformation could take place during the thermophile phase, but some studies showed that the degradation would be probably most important during the maturation phase of composting (Verge-Leviel, 2001).
Low-molecular-weight PAHs are readily degraded. However, high-molecular-weight PAHs (four and more rings) are more persistent, because of their low bioavaibility, due to their strong adsorption onto the soil organic matter (Manilal and Alexander, 1991; Weissenfiels et al., 1992). Oleszczuk (2007) indicated that the changes in the PAH content were less visible for three and four-ring but more visible for high weight molecular compounds of PAHs, this conclusion was similar to the study of Amir et al. (2005).
Therefore, many investigations have focused attention on the degradation of high-molecular-weight PAHs for cleaning up contaminated sites. The ability to predict the rate of PAHs degradation in soils of different properties is one of the most important challenges for soil remediation technologies (Harmsen, 2004). Soil is the main, ultimate sink for most organic contaminants.
1.4 Modelling the dynamics of OM and OP during the composting
Mathematical modelling can be employed as a useful tool in order to understand and to improve the composting process.
1.4.1 Summary of environmental conditions
Most modeler have focused on the composting system with large scales, and the mass and energy balance were considered as the foundation when they investigate the dynamics of substrates in composting system (Mason, 2006; Sole-Mauri et al., 2007; Lin et al., 2008; Vlyssides et al., 2009).Furthermore, most models were used to describe the environmental factors which were thought to be the elementary factors influencing the composting process. These factors are: temperature (Gray et al., 1971; Suler and Finstein, 1977; Finstein, 1980; Nakasaki K et al., 1985; Golueke, 1987; Richard and Walker, 1998), microbial biomass(Nakasaki et al., 1985; Nakasaki and Akiyama, 1988), moisture (Suler and Finstein, 1977; Schulze, 1961; Jeris and Regan, 1973; Bakshi, 1987), oxygen content (Suler and Finstein, 1977; Richard et al., 1999), porosity(Jeris and Regan, 1973), particular size (Gray et al., 1971) and C/N ratio (Morisaki et al., 1989). Among these factors, the microbial biomass, temperature, moisture and oxygen content were usually considered as the correction coefficients. In recent years a number of researchers have proposed a kinetic model to describe the composting efficiency on the function of these environmental factors (Finstein, 1980; Miller et al., 1986; Ndegwa et al., 2000; Xi et al., 2005). One of the common one belongs to Haug (1993) who showed a form as below containing 4 environmental factors: temperature (T, °C), oxygen content (O2, volume %), moisture content (kg H2O / kg wet-wt.) and FAS (m3 air/ m3 bulk agent).
) ( ... ) ( ) ( ) ,..., , (x1 x2 xn kS f1 x1 f x2 fn xn k [5]
composting; n refers to the number of environmental factors; f1, f2…fn are the functions corresponding to the environmental factors, under the special conditions, these factors will affect the reaction rate, while under the standard condition, the value of these function equal to 1.
The function of temperature in these models is a multiplicative function of the constant of potential biodegradation. This constant is increased when the temperature is higher and the microbial activity is enhanced, on the other hand, it is decreased when the temperature is too low. In the case of composting, when the temperature is too high (around 60°C) the function of temperature will decrease, because the microbial activities are limited. The functions of temperature are different for soil and compost. There are several propositions of functions (see Table 1.1).
Mason in 2006 has realized a summary about composting models and especially the functions of temperature. He found that the function of Rosso et al. (1993) described better the influence of temperature than the others.
Table 1.1: The different functions of temperature
Temperature correction Reference
T ( 1 ) (8 0 ) ...0 8 0 1 6 0 0 T T f C Kaiser (1996) (For composting) T ( 2 ...4 ) ( 6 0 ) ...0 6 0 2 0 (8 0 ) T T f C T 2 1 T T = T - T f (T1<T<T2) Stombaugh et Nokes (1996) T1 = 0 , T2 = 30 , T3 = 55 (For composting) fT = 1.0 (T2<T<T3) T 2 T = 3 .7 5 -T -1 0 f (T3 <T) C * ( T / T ) d T r e f ( * ) f a b e (Tref =15 ) a = -0.566 ; b = 0.620 ; c = 0.9125 ; d = 1.026 Recous et al. (1995) (For soil) 2 m a x m in T o p t m in o p t m in o p t o p t m a x o p t m in ( T -T ) ( T -T ) f = ( T -T ) [ ( T -T ) ( T -T ) -( T -T ) ( T -T -2 T ) ] Rosso et al. (1993) (For composting)
1.4.2 Summary of OM models
The multi-component compositions of OM largely determines the degree of involvement of different microorganisms in the degradation process, regulates the spectrum of microbial enzymes excreted (the soil called induction effect), specifies the effect of enzymes on the decomposed molecules, thus influencing the total rate of organic matter degradation, which can be evaluated, for example, by the decrease in organic carbon concentration. The degradation rates of individual components can vary widely. The modelling of Composting process is based on the organic matter degradation and biotransformation.
There exist several models in the literature which describe the processes of decomposition of OM. The OM models in which we were interested can be divided in two groups: the simple models and the models with more details on the biochemical characteristics.
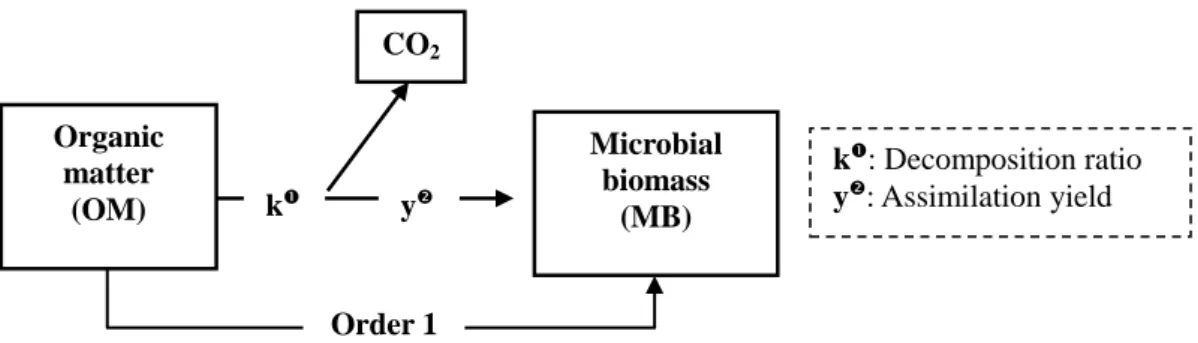
1) The simple models describing the decomposition of OM (see Fig.1.2): the organic compounds of OM are accessible to the microbial biomasses and a part of OM is mineralized into by the form of CO2. Generally, in the field of soil, the limitation of the decomposition comes only from the capacity of OM which is degraded by microbial biomass.
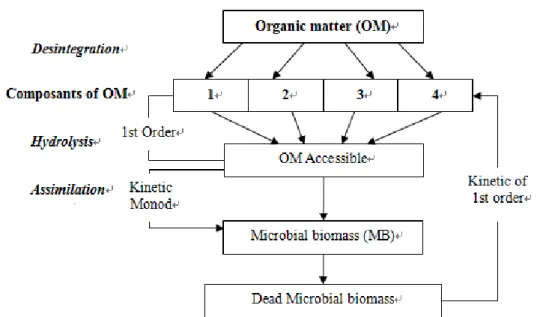
2) The Models describing the decomposition of OM on considering the biochemical characteristics of organic substances (see Fig.1.3 and 1.4): the organic compounds of OM are hydrolyzed and assimilated by microbial biomass. The limitation of the decomposition comes not only from OM but also from the microbial biomass which can be limiting.
Organic matter (OM) Microbial biomass (MB) CO2 Order 1 k: Decomposition ratio y: Assimilation yield
Figure 1.2: Model describing the flux of C and N in the course OM
decompositionin the field of soil: Model STICS (Nicolardot et al., 2001)
Figure 1.3: Schematic Representation of ADM1 model: conversion of a process of
the anaerobic digestion (Batstone et al., 2002)
The model ADM1 is used to simulate the anaerobic digestion. This model distinguishes the disintegration and the hydrolysis which are extracellular mechanisms. All the dynamics follow a kinetic of 1st order. The phase of disintegration is a nonbiological stage which transforms the components of the substrate into proteins and lipids. The phase of hydrolysis is enzymatic. It converts proteins and lipids into monosaccharide, amino acids and fatty-acid with long chains at the same time. The kinetics of Monod was used to represent the microbial growth. The decays of microbial biomasses evolve following the 1st order kinetic (Delgadillo-Mirquez et al., 2007).
In the literature of OM model during the composting, we are also interested in the model of Kaiser (1996). It distinguishes the OM compartments into three big parts: easily-biodegradable fraction (MB), slowly-biodegradable fraction (MH) and inert or non-biodegradable fraction (MI) according to their decomposition rates under the various microbial activities. These various micro-organisms are activated according to the temperature (See Figure 1.4). Where, MB refers to the organic fraction which may be dissolved immediately and assimilated by the microorganism; MH is composed of the dissolved macro-molecules and this kind of material needs to be hydrolyzed before the microbial assimilation; MI refers to the organic fraction which has almost no biological reactions. In 2007, Sole-Mauri et al. proposed a method to identify the
organic matter in more details: Carbohydrate (XC), protein (XP), liquids (XL), hemicellulose (XH), cellulose (XCE), lignin (XLG) and inert organic fraction (XI). Table 1.2 concludes some models describing the dynamics of organic matters in recent literatures. The principal differences between the models “soil” and “composting” are as follows (see details in Table 1.3).
Table 1.2: Organic matter modelling in the field of soil and composting Models Field Aerobic Number of compartments Hydrolysis Kinetic of microbial growth Microbial decay to the system
Kaiser, 1996 composting Aerobic 5
No Monod
Return to Humic OM Batstone et
al., 2002 digestion Anaerobic 3 Yes Monod
Return to the initial OM Garnier et al.,
2003 soil Aerobic 4 No First order
Return to Humic OM Tremier et al.,
2005 composting Aerobic 3 No Monod
Return to the initial OM Sole-Mauri et
al., 2007 composting Aerobic 7 Yes Monod
Return to the initial OM
To summarize, the principal differences between the models “soil” and “composting” are as follows (see details in Table 1.3).
The growth of microbial biomass µ can be described in three types of kinetics according to the literature (see Table 1.4). Generally, the studies prefer the 2nd order (Monod), for example Stombaugh (1996), Mason (2006) and Kaiser (1996).
Table 1.3: Comparisons between the OM model in soil and during composting
Model Limitation General expression of OM decomposition
In soil Comes especially from OM d C kC d t During composting
Comes from OM and MB
d C
X d t
« » can be calculated by different kinetic of order (see details in Table x)
Table 1.4: Three orders of the microbial growth
Croissance de BM Equation Description
Ordre 0 m a x f fT W
The microbial growth varies only on the function of temperature (T) and
moisture content (W)
Ordre 1
m a xC f fT W
(C : la concentration du substrat)
The microbial growth varies on the concentration of substrate and the site
environment Ordre 2(Monod) m a x T W S C f f K C (Ks : demi-saturation)
The microbial growth varies on the concentration of substrate and the site environment but there is a limit for the
microbial growth
1.4.3 Summary of OP models
In the literature, the models of organic pollutants (OPs) exist especially in the field of the soil but they can also be adapted to the composting. We found several types of models (showed in Table 1.5): A) The models with two compartments which describe
the phenomenon of degradation, adsorption and desorption; B) The
multi-compartment models (i.e. Fig.1.5) which distinguish the fraction weakly adsorbed and strongly adsorbed; C) The models which separate the molecular parent and their metabolites (i.e. Fig.1.6).
Table 1.5: Summary of OP models
Reference Compartiments Equations
Barriuso et al. (1991)
- Soluble Sw - Adsorbed Ss
Ss = Kd * Sw Kd: coefficient de distribution
Xue et Selim, 1995 & Shelton et Doherty, 1997 (see figure 8) - Soluble Sw - Easily accessible Ss1 - diffuse dans MO Ss2 S w t = - K1 * Sw + K-1*Ss1 1 S s t = K1 * Sw – (K -1 + K2) *Ss1 +K-2*Ss2 2 S s t = K2*Ss1 - K-2*Ss2 Saffih-Hdadi (2003) (see figure 9) - Pesticide - Metabolite See Table 1.6 Mineralisation Mineralisation Biodegradation Km3 Km3 Km2 Km1
S
1M
1S
2S
3M
2M
3 K1 K2 K3 K4Figure 1.6: Model of Saffih-Hdadi (2003)
*Ki, Kmi: Kinetic coefficients of sorption for molecular parent and their metabolites
*S: pesticide / M: metabolite K2 K-2 K1 K1
Sw
Ss
1Ss
2Figure 1.5: Multi-compartiment model *