This is a post-peer-review, pre-copyedit version of an article published in
Canadian Studies in Population. The final authenticated version is available online at: http://dx.doi.org/10.1007/s42650-019-00002-x
Please cite as:
Vézina, Samuel, Alain Bélanger, Patrick Sabourin, and Guillaume Marois. 2019. "Literacy Skills of the Future Canadian Working-Age Population: Assessing the Skill Gap Between the Foreign- and Canadian-Born." Canadian Studies in Population 46 (1): 5-25. https://doi.org/10.1007/s42650-019-00002-x. https://doi.org/10.1007/s42650-https://doi.org/10.1007/s42650-019-00002-x.
Literacy skills of the future Canadian working-age population: Assessing the skill gap between the foreign- and Canadian-born
Vézina, Samuel, Alain Bélanger, Patrick Sabourin, and Guillaume Marois
Abstract and keywords
This paper presents the results of literacy-proficiency projections using a microsimulation model that simultaneously projects future demographic, ethnocultural and socioeconomic characteristics of the Canadian population. Factors linked with literacy skills of the working-age population are analysed for both native- and foreign-born Canadians. The projection results show that literacy skills are likely to slightly decline between 2011 and 2061, as the positive effects of increasing education are cancelled out by the important skill gap between native- and foreign-born Canadians. Results of the simulation suggest that plausible changes to immigrant selection policies could prevent against the associated literacy skill decline among the Canadian working-age population.
Literacy skills; Microsimulation projections; Working-age population; Immigration
Résumé et mots-clés
Cet article présente les résultats de projections démographiques par microsimulation selon diverses caractéristiques démographiques, ethnoculturelles et socio-économiques. Les compétences en littératie de la population en âge de travailler sont projetées selon des paramètres distincts pour la population née au Canada et pour les immigrants. Les projections montrent que le niveau de compétences devrait baisser légèrement entre 2011 et 2061 puisque l’effet positif de l’augmentation du niveau d’éducation est contrebalancé par l’écart du niveau de littératie des immigrants et des natifs. Des changements à la politique de sélection des immigrants pourrait prévenir ce déclin projeté des compétences de la population canadienne en âge de travailler.
Compétences en littératie; Projections par microsimulation; Population en âge de travailler; Immigration
Context
The age and sex structure of Canada's population has changed considerably over the 20th century. The pyramid-shaped structure that prevailed during the first half of the century, then narrowed at its base and expanded at the upper end. Given current low fertility levels and high life expectancy, the population is aging, and migratory increase now accounts for about two-thirds of Canada's population growth (Statistics Canada 2017a). Furthermore, Canada is no exception: many other developed countries are characterized by this new demographic regime where ethnocultural diversity is not only increasing, but surpassing anything they have previously experienced (Vertovec 2007; Coleman 2006).
Immigration serves as a demographic policy tool, but it can also be an economic tool (Green and Green 2004) through the selection of “skilled” individuals. The idea is that immigrants with high level of human capital are more likely to successfully integrate into the labour market and into the general society. Canada has been a leader in the development and establishment of a points-based selection system (Papademetriou and Sumption 2011). The current criteria are highly selective in terms of education level and other human capital attributes (Citizenship and Immigration Canada 2017).
While the link between skills and education level seems straightforward among the Canadian-born population, the correlation is much more blurred among foreign-born Canadians. Indeed, data from the Survey of Adult Skills1 show that on average immigrants have weaker basic
1 The Organisation for Economic Co-operation and Development (OECD) and Statistics Canada developed the
Programme for the International Assessment of Adult Competencies (PIAAC) through which the Survey of Adults Skills is conducted. In this survey, literacy proficiency is measured along a continuous scale ranging from 0 to 500, where a higher score indicates greater proficiency. The literacy-proficiency projections presented in this paper are based on PIAAC Survey data. Thus, the definition of literacy skills corresponds to the definition and conceptual framework undergirding this survey. For more information, see OECD (2017) and Statistics Canada (2017b).
literacy skills than native-born adults, not only in Canada but all OECD countries (Xenogiani 2017). The gap remains significant even after accounting for various factors, such as demographic variables, education and language skills2. Therefore, at a given education level, holding other characteristics constant, the level of basic information-processing skills is lower for the foreign-born population. Green and Worswick (2017) conclude that “the actual amounts of skill being imported to the Canadian labour market through immigration is much lower than the nominal amount based on the skills that immigrants list at arrival.”
Of course, the skill set of a person is not limited to literacy skills. Nonetheless, previous studies using the Survey of Adult Skills have generally concluded that once educational attainment effects have been controlled for, literacy skills significantly contribute to explaining labor force outcomes. For example Green and Riddell (2007) estimate that in Canada “one-fifth of the typically measured impact of schooling on earnings arises because schooling generates higher levels of literacy”. Literacy skills, as measured in the Survey of Adult Skills, are quite basic, yet they are also powerful proxies for complex communication and reasoning skills, both increasingly valuable for the labour market of today and tomorrow (Levy 2010; Carey 2014). The academic literature shows that people with greater literacy proficiency are more likely to report being in good health or to take part in civic activities, are more trusting of others, better paid and less likely to be unemployed (OECD 2016; McIntosh and Vignoles 2001). At the country level, average literacy proficiency of the working-age population influences productivity and economic growth (Hanushek and Woessmann 2008; Coulombe et al. 2004).
Given the rising levels of immigration, issues with immigrants’ educational attainment, literacy skills, and labour market integration are increasingly relevant. This research projects the future improvement (or decline) of literacy proficiency among the adult Canadian population, which has important implications for well-being of the country. This research provides a new metric that yields a direct measure of the effects of the socio-demographic changes on working-age population literacy proficiency. Using the Survey on Adult Skills data, regression analyses are first performed to identify the factors linked with literacy skills, and to test their strength and significance. Second, this paper uses LSD-C (Laboratoire de Simulations Démographiques-Canada), a microsimulation model, which extends beyond the capacity of traditional projection models to account for the multiple dimensions of ethnocultural diversity in population projections and their impact on literacy skills. Using cohort-component or multi-state models, past research has focused on the impact of age and education, while ignoring the effect of immigration and increasing ethnocultural diversity on future literacy levels (See Keslair (2017)). The LSD-C microsimulation model is specifically designed to provide analyses of the socio-economic and cultural consequences of population changes in Canada. Using different “what-if” scenarios, this paper also simulates the effects of different immigrant selection patterns on the literacy skills of the future labour force.
Theoretical framework
Our research draws on multiple theoretical perspectives. The first, and most important, stems from the idea that projecting socioeconomic changes can be realized by using population projections, in agreement with the Demographic Metabolism theory (Lutz 2013). This theory emphasizes the importance of cohort succession to explain social changes. Since many characteristics of individuals (education, values, language, etc.) tend to remain stable over a
lifetime, social change may occur through the continuous succession of cohorts whose composition and social structure vary over time, as some individuals join the population through births and immigration, while others leaving it through death and emigration. Lutz (2013) has shown that Demographic Metabolism can also be used as a theory of socioeconomic change with predictive power; the goal of the theory is not to explain and project demographic variables with certainty, but “to predict broad socioeconomic change (ranging from values and religions to skills and productivity of the labour force) using a demographic paradigm”. In its empirical application, the Demographic Metabolism theory requires a model of projection that goes beyond age and sex and allows for the simultaneous projection of several variables. Accordingly, we develop a microsimulation model (see section on data and method) that better captures the effect of changes in population composition than the traditional cohort-component model allowing for the projection to go beyond age and sex and thus better capture changes in the composition effect.
In addition to Demographic Metabolism (Lutz 2013), this research encompasses other micro-level theories upon which the estimation of the different parameters driving the individual transitions (fertility, migration, education, etc.) are modeled (Bélanger, Sabourin, Marois, et al. 2018). In the context of this paper and for sake of brevity, it is not necessary to go through all of these in details. However, it is important to mention frameworks on which the estimation of the parameters of the literacy module is based. In this matter, Desjardins (2003a) and Barone and van de Werfhorst (2011) developed approaches asserting causal relationships between schooling, literacy skills, and economic and social outcomes. Countless dimensions are linked with skill acquisition and maintenance. For example, the Practice-Engagement Theory (Reder 1994) asserts that observed skill level is a function of the use of skills (incidence, frequency, complexity) on a daily basis in the everyday life. For practical reasons, it is not possible to consider all potential
factors linked with literacy in our analyses, particularly so in the microsimulation model. The omitted dimensions are thus considered to have at least partial effects in the numerous events simulated in the model. The microsimulation model used in this research simulates many demographic behaviours and projects several characteristics, offering a valuable tool for producing literacy projections in the context of increasing ethnocultural diversity.
Parameters of all modeled events in LSD-C are kept at a constant pace, implying that social changes occur only through changes in the composition of the population and are thus driven by demographic metabolism. Supported by empirical evidence, this research assumes that socio-demographic changes are the most important factors for future progress in the average literacy skills. However, this is not in contradiction with the idea that social change can be influenced by public policies as policies can play a role in modifying the future composition of the population. Thus, all the projection scenarios assume changes in the composition of the population either by changing the educational composition of future cohorts or by changing the characteristics of future immigrant cohorts. These changes can result from education (e.g., University tuition’s fees) or immigration (e.g., changes in the immigrant’s selection) policies without changes in individual behaviors.
Data and methods
The methodology of this research has two aspects. First, literacy skill determinants are identified and measured through multivariate analyses. Second, these estimates are used as input to run a microsimulation projection model. Different scenarios are designed to measure the extent to which the average literacy skills proficiency of the Canadian working-age population is likely to be affected by foreseeable changes in socio-demographic characteristics, notably in terms of educational attainment and ethnocultural diversity. Additional scenarios are designed to understand
how the characteristics of simulated immigrant cohorts can impact on the average skill level of the projected working-age population.
This paper focuses on the working-age population defined as persons aged 25 to 64 years old. This age cut-off was selected to increase the homogeneity of our sample in terms of labour force participation rate; at this age, most people have left school, and no one qualifies for normal CPP3 retirements benefits. Residents of the three northern territories, as well as non-permanent residents, are also excluded from analyses4.
Multivariate regression analyses were conducted to identify the literacy skill determinants using the 2012 PIAAC survey data. In this survey, literacy proficiency is measured along a continuous scale ranging from 0 to 500, where a higher score indicates greater proficiency. The series of tasks used for assessing literacy range from reading a product label or locating a single piece of information, to reading newspaper article and distilling information. To help interpret the scores, the scale is divided into proficiency levels. At each level, individuals can successfully complete certain type of tasks. For example, the first two levels require respondent to read and understand relatively short text, whereas the level 4 and 5 require multi-step operation to integrate, synthesize and interpret information (Statistics Canada 2013).
Regression models are stratified by immigration status to consider variables specific to foreign-born populations, such as age at immigration, country of birth, etc. Coefficients are derived
3 Canada Pension Plan (CPP). Retirement age in Canada is 65 years old for both men and women.
4 Are also excluded from the PIAAC survey sample – thus from the analyses – the population residing in institutions,
from linear regressions on log5 scores (literacy skills). The “complete” regression models control for the following independent variables:
1. Sociodemographic variables (age, sex, province, and area of residence6),
2. Human capital variables (education level, mother tongue, and language spoken at home),
3. Socioeconomic variables and life-wide factors (mother’s education level7, use of literacy skills at home, at work (labour force status) and in the everyday life8), and 4. variables linked with characteristics that are specific to immigrants, such as age at
immigration, years in host country since migration, immigration category, country of birth, and country of highest diploma9.
Additional regression models (“simplified models”) are used to derive the parameters needed to impute literacy scores to the projected Canadian population. These regression models omit some variables in the complete models and strictly contain the dimensions that are projected in the microsimulation model. For example, the life-wide factors such as the use of literacy skills in everyday life are excluded from the simplified regression models. Coefficients and adjusted R²
5 A simple logarithmic transformation is made on the dependant variable (literacy score) to obtain regression
coefficients that can be interpreted as showing the percentage effect of a unit change on the average score. The logarithmic transformation also ensures that the linear regression model will not lead to illogical predicted scores (below 0 or above 500) during the simulation.
6 We use the standard threshold used by Statistics Canada to distinguish rural and urban areas. An urban area
corresponds to an area with a population of at least 1,000 and a density of 400 or more people per square kilometre.
7 The mother’s education level is also a measure of social and cultural capital which directly and indirectly impacts on
the children skill development and socioeconomic status. See Augustine and Negraia (2018).
8 Intensity of reading books at home and of writing letters, memos or emails at work were used. Life-wide learning is
defined as occurring “in different context such as in the home, school, work, community and other.” (Desjardins 2003b: 211)
9 The country of birth and country of highest diploma have similar categories. The richest countries of the world are
grouped together and correspond to Western European countries, North American countries as well as Australia, Japan, New Zealand, Singapore, and South Korea.
of both the complete and the simplified models are presented in the results section. The implications for results, given the models’ different specifications, are also discussed.
In order to account for the multiple dimensions of ethnocultural diversity in population projections and their impact on literacy skills, we use LSD-C, a microsimulation projection model10 specifically designed for the prospective analysis of super-diversity11. LSD-C simultaneously projects demographic (age, sex, place of residence, place of birth, generation and immigrant status), ethnocultural (mother tongue, language spoken at home, knowledge of official languages, visible minority status, religion) and socioeconomic (education, labour force participation) characteristics of the Canadian population12.
LSD-C is case-based; individuals from the base population (representative sample of the
2011 population13) are simulated one by one, and their characteristics are modified through scheduled events, with timing determined by the values of their specific input parameters during the projection period. LSD-C simulates numerous events to replicate demographic dynamics; cases including risk of dying, having a child, migrating, getting a job, etc. The model is also dynamic and runs continuously, meaning that characteristics of individuals are modified in “real time”. For example, the probability of migrating from one region to another (within Canada) varies by age, sex, language knowledge and use at home, religion, visible minority status, immigration status, education, and labour force participation. During the simulation, if a person moves to another region, probabilities of events are recalculated accordingly.
10 This microsimulation model is built along a framework developed for the study of super-diversity in many countries
including Canada, the United States, and 28 countries of the European Union (Bélanger, Sabourin, Marois, et al. 2018).
11 Super-diversity is a concept coined by Vertovec (2007) and refers to this emerging demographic regime of increasing
ethnocultural diversity.
12 See Bélanger, Sabourin, Vézina, et al. (2018) for more technical documentation of the microsimulation.
13 LSD-C’s point of departure is 2011 and its starting population is based on the 2011 National Household Survey
All demographic parameters (mortality, fertility, immigration, emigration) in LSD-C are set according to Statistics Canada’s most recent population projections (Statistics Canada 2015). The
LSD-C baseline scenario more or less replicates the medium-growth (M1) scenario of Statistics
Canada. LSD-C goes beyond age and sex projections, further describing the population by education, labour force participation, immigration, language skills, and other facets. In LSD-C, a literacy score between 0 and 500 is assigned to every simulated person aged 25 to 64. This is based on the parameters of the simplified regression models described above; therefore, the assigned score depends on all variables included in the regression models. During the simulation, assigned literacy scores are updated whenever any of these characteristics14 undergo changes (such as age, education level, labour force participation status, length of stay in Canada).
Describing all projection modules of LSD-C would be beyond the scope of this paper. For more information on the content of the LSD-C model, base population, and data sources and methods used to model events that these projections take into account, please consult the publication “The Canadian microsimulation model (LSD-C): Content, modules, and some preliminary results” by Bélanger, Sabourin, Vézina, et al. (2018).
Hypotheses and Scenarios
Scenarios are designed to, first, test the impact that differing assumptions have on projected average literacy levels among the Canadian working-age population. These stylised scenarios were developed to illustrate the theoretical upper and lower limits of the influence that immigration or education has on the projected outcome (average literacy level). Second, a set of “what-if” type scenarios were designed to assess the impacts of changing characteristics among the simulated
14 Characteristics such as age, province of residence, education level, labour force participation status, length of stay
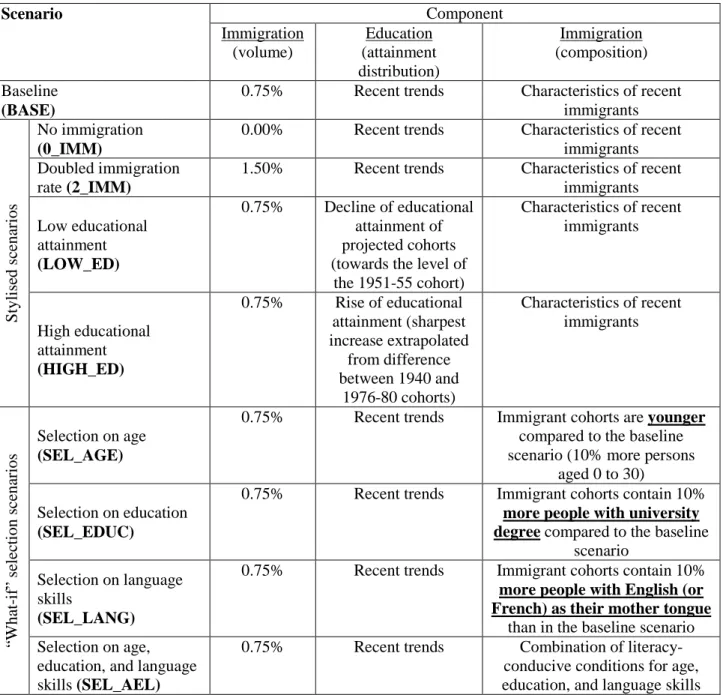
immigrant cohorts between 2012 and 2061. These scenarios simulate plausible changes to the points-based immigrant selection system. Table 1 sums up the underlying hypotheses for all of the different scenarios.
[Table 1]
In the baseline scenario, the immigration rate is set to 0.75% of the population per year. This rate corresponds to the average annual rate observed over the last 25 years, which translates into approximately 250,000 immigrants per year at the beginning of the projection, and grows to 406,000 immigrants per year by the end in 2061. The baseline scenario assumes that the educational attainment of young adults’ cohorts will continue to rise between 2011 and 2026, and then remain constant after 2026. The rise in education observed in recent decades was indeed too substantial to be maintained for three more decades, i.e. between 2026 and 2061. Finally, the baseline scenario assumes that all immigrant cohorts from 2012 to 2061 have the same characteristics as recent immigrants from 2011, i.e. immigrants who arrived in Canada between 2006 and 2011.
Four stylised scenarios were designed to investigate the extent to which changes in immigration rates and educational attainment can impact projected literacy level. The first two are contrasting immigration volumes. In the first one (0_IMM), immigration rates are set to zero, and in the second one (2_IMM), immigration rates are set at 1.5%, which is twice as many immigrants as in the baseline scenario. These scenarios are highly unrealistic, but they can help illustrate the relationship between immigration and literacy levels. In other words, they can help measure the sensitivity of assumptions on future immigration level on the projected average literacy level. The second pair of scenarios were designed to show two different education futures. In the low education scenario, the education module parameters are modified to assign the educational
attainment of baby boomers (those born in 1951-55) to the projected young adults. The educational attainment of these cohorts is significantly lower than succeeding cohorts born in the 1960’s, 70’s, and so on. At the other end, the high education scenario intensifies observed, improving trends in terms of educational attainment of cohorts. Specifically, this scenario (HIGH_ED) extrapolates from the trends using two extreme points: educational attainment of the cohorts born in 1940 and before, and the 1976-80 cohort.
Four “what-if” scenarios were designed to assess the impact of changing characteristics on the simulated immigrant cohorts between 2012 and 2061. In these four scenarios, the simulated immigrant cohort distributions are slightly modified to reflect a plausible change in Canada’s immigrant selection policies. Under the scenario SEL_AGE, the distribution of simulated immigrants contains 10% more persons aged 0 to 30 years old. Under the scenario SEL_EDUC, the distribution of simulated immigrants has 10% more people with a university degree than the baseline scenario, and under the scenario SEL_LANG, the distribution has 10% more individuals with English (or French) as their mother tongue than in 2011. Finally, the fourth scenario (SEL_AEL) combines all three selection measures (on age, education, and language skills). Under these four selection scenarios, immigration volume is kept at the baseline level.
Results
Descriptive statistics
Figure 1 presents descriptive statistics of how average literacy scores differ between native- and foreign-born Canadians. The figure also illustrates the distribution as it plots the scores of the 5th, 25th, 50th (median score), 75th, and 95th percentiles.
Overall, the average literacy score is 25 points higher among native-born Canadians. Distributions are similar, but we observed a slightly wider distribution at the lower end (between the 5th and the 25th percentile) among foreign-born Canadians. When the scores are broken down by age groups and education level, we observe that age seems to be negatively linked with literacy proficiency. In contrast, literacy proficiency increases with the education level. For any given age or education category, the average and median scores are always higher among the native-born Canadians. For foreign-born Canadians who are university graduates we observe that the average literacy score is slightly lower, but close to the average literacy score of the general native-born population. At the lowest education level, we observe that the score distribution is wider among the foreign-born, which can partly be explained by the country of origin and immigration category variables.
Age at arrival seems to have an important effect on foreign-born literacy proficiency. The average score and distributions of immigrants who arrived in Canada before 15 years old (all other characteristics of age, education, etc. combined) are indeed very close to the general native-born population. On the other hand, we do not observe significant variations between the average scores (and distribution) by duration of stay. We were expecting to notice a positive gradient between literacy proficiency and length of stay in Canada. Such a relationship might not appear in these descriptive statistics due to selection and composition effects of specific immigrant cohorts. Nonetheless, these results are in line with Xenogiani (2017), who shows that age at arrival has a significant and stronger effect on foreign-born literacy proficiency than duration of stay.
Regression analyses
Using multivariate regression analyses, we go beyond the descriptive analyses by isolating the net effect of each variable (age, sex, education, etc.). Table 2 presents the regression coefficients
from both the complete and simplified regression models. Results show that human capital variables – education above all – are by far the main drivers of literacy skills. This relationship is stronger for immigrants than for the native-born. In fact, the literacy skills of immigrants with a high level of education are more than 30% higher on average than immigrants with a low level of education, compared to 24% for native-born. To a lesser extent, the language spoken at home is also a significant predictor of literacy proficiency. Compared to individuals having English as his/her mother tongue, the literacy skills of Canadians whose mother tongue and language spoken at home is neither French or English are lower by 10.5% among native-born (mainly Aboriginal persons) and 6.6% among foreign-born. In the simplified models, education and linguistic variables are also significant predictors of literacy skills proficiency. In fact, coefficients are stronger as they capture part of the effects from the omitted variables.
[Table 2]
Results also show that literacy skills decline with age. Compared to the 25-34 year olds, the literacy scores of older individuals (aged 55-64 years) is lower by 3.7% among native-born and 4.3% among foreign-born. This age gradient is stronger in the simplified regression models. Females seem to achieve lower score than males, but this gender difference is significant among the native-born population only (1.9%) in the complete model. The coefficients indicate that there are no statistically significant differences in literacy proficiency between the provinces or between urban and rural areas.
In the complete models, we see that life-wide factors (use of literacy skills in everyday life) are different, to a statistically significant extent, from zero at the 5% level. This result suggests that literacy skills seem to have the “use it or lose it” dimension put forward in Reder’s
Practice-Engagement Theory (1994). As for the mother’s education variable, regression coefficients show significant impacts on literacy scores, of similar strength for both foreign- and native-born Canadians.
Finally, some of the immigrant characteristics, namely immigration category and country of diploma, are also significant predictors of literacy proficiency. Results show that sponsored family immigrants, as well as refugees, have lower literacy proficiency (4.5% and 6.4%, respectively) than economically-selected immigrants (through the Canadian points-based selection system). Other things being equal, literacy skills of immigrants with a Canadian diploma are 6.3% higher on average than immigrants with highest level of education completed in a poor country. Neither age at immigration, length of stay in Canada or country of birth are statistically significant variables to explain literacy scores of immigrants once the model controls for other immigration variables, namely country of highest diploma and immigration category.
In the simplified models, both the age at immigration and the length of stay in Canada remain insignificant dimensions. However, the country of birth becomes significant as it probably captures some of the effect of immigration category (omitted variable). Omitting immigration category limits the explanatory power of the simplified model; however, this limitation is mitigated by the fact that the effect of other variables, such as country of birth, is augmented. Finally, a Canadian diploma is significantly correlated with higher literacy proficiency, and of similar strength to what is observed in the complete model.
Even though the simplified regression models do not include all significant variables in the complete model – notably the social capital variable and the life-wide factors – the predictive power of the model is not substantially affected. In fact, the adjusted R² is four to five points lower for the
native- and the foreign-born, respectively. More importantly, the value and significance level of coefficients from the simplified models are quite close to those of the complete models.
Literacy projection results: stylised scenarios
Figure 2 illustrates the overall projected literacy proficiency of the working-age population under these different scenarios. Under the baseline scenario (BASE), projected literacy proficiency would slightly decline over the next 50 years as the positive effect of increasing education is completely overtaken by the effect of increasingly large immigration intakes. More precisely, the average working-age population skill level slightly increases during the first decade and peaks at 269.8 in 2026. Then, it slowly decreases to 267.8 in 2061. Overall, the average literacy score would decline by 0.5% over the 2011-2061 period.
[Figure 2]
The stylised immigration scenarios demonstrate the extent to which the migratory component impacts overall projected proficiency. At the projection horizon, the literacy score of 25-64-year-old Canadians averages at 262 if immigration rates are set at 1.5% (2_IMM), while the no-immigration scenario (0_IMM) leads to an average score of 280 in 2061. In these two scenarios the projected population (aged 25 to 64 years) in 2061 varies substantially; projections reach 12.0 million and 39.4 million, which respectively presents a 36.4% decrease and a 108.9% increase from the initial 2011 level. By contrast, projected average literacy changes less dramatically (less sensitive): the projected average literacy increases by 3.9% under the no-immigration scenario (0_IMM) and decreases by 2.7% under the 2_IMM scenario.
In regards to the education scenarios, the projections results are less divergent than in the immigration scenarios. In the scenario that projects a more optimistic education trend than currently
observed (HIGH_ED), the average literacy proficiency score increases above 272 in 2031, stabilises until 2046 and then slightly decreases to 271,7 in 2061. At the opposite end, projected scores fall throughout the whole low educational attainment scenario (LOW_ED). The decline is rapid between 2016 and 2046, which then decelerates between 2046 and 2061. Under this scenario, the projected score in 2061 is equal to 262.8.
While the education scenarios influence the projected literacy level, these scenarios have nearly no effect on the projected population in 2061. Both stylised education scenarios project a working-age population of about 23.5 million Canadians in 2061, similar to the baseline scenario. This means a 24% increase above the 2011 level. However, projected average literacy decreases by 2.4% under the low educational attainment scenario (LOW_ED) and increases by 1.0% under the high educational attainment scenario (HIGH_ED). To sum up, both education and immigration influence the projected literacy level of the working-age population; and differing immigration levels dramatically change the projected population growth.
Literacy projection results: “what-if” selection scenarios
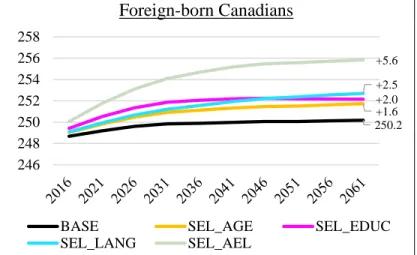
Figure 3 illustrates the overall projected literacy proficiency of the foreign-born population under the different “what-if” scenarios. In the baseline scenario (BASE), projected literacy proficiency slightly increases over the next 50 years since recent immigrant cohorts are more educated than long-established, foreign-born Canadians. More precisely, the average literacy level increases over the whole projection period and reaches 250.2 in 2061.
[Figure 3]
If Canada’s immigrants were admitted at a younger age (SEL_AGE), the projected literacy score in 2061 increases by 1.6 points compared to the baseline scenario (BASE). If the proportion
of immigrants holding a university degree increases by 10% (SEL_EDUC), the projected score increases by 2.0 points at projection horizon. Thirdly, if the proportion of immigrants speaking either of the official languages would increase by 10%, literacy skill scores of the foreign-born population would be increased by 2.5 points. Finally, under the scenario where all three selection measures (age, education, and language skills) are combined, the projected literacy of the working-age foreign-born population reaches 255.8 in 2061, which is 5.6 points higher than the projected score in the baseline scenario.
Table 3 summarizes the projection results generated by the “what-if” selection scenarios. The table shows the variation in the average score of the total working-age population between 2011 and 2061, including all immigration statuses. In the scenario where all three selection measures (on age, education, and language skills) are combined (SEL_AEL), the projected score no longer declines, but increases by 0.4%, reaching 270 in 2061. For the scenario where the simulated immigrant cohorts (2012-2061) have 10% more individuals with English (or French) as their mother tongue than in 2011 (SEL_LANG), the projected literacy decline among the total working-age population is almost mitigated. Indeed, the average literacy score declines by only 0.1% between 2011 and 2061.
[Table 3]
The underlying assumptions of the “what-if” selection scenarios are very close the those of the baseline scenario. In the selection scenarios, the characteristics of only a small proportion of the foreign-born population are modified, with foreign-born Canadians themselves accounting for only a fraction of the total working-age population. Moreover, under these selection scenarios the total immigration volume remains at the baseline level. Nevertheless, when boosting the human
capital composition of future immigrants by (merely) 10%, the projected average score no longer declines, but instead slightly increases by 0.4%, reaching 270 in 2061 (SEL_AEL). Such a rise in the average projected literacy is equivalent to 20% of the rise seen in the no-immigration scenario (0_IMM). To obtain similar results (an average score of 270 in 2061), we would have to reduce immigration to Canada by tens of thousands of newcomers every year: around 50 thousand less immigrants than baseline in 2012 and more than 75 thousand less in 2061, equalling a total of more than 3.2 million over the 50-year projection period. Overall, these results illustrate the relative impact that plausible changes to immigrant selection policies have on the average literacy skills of Canada’s working-age population.
Limits
The current analysis hints at the forces that underlie skill gain and loss in adulthood. However, the results are cross-sectional, and the literacy projections are derived from these regression analyses. To provide further insight, it would be valuable to develop a dynamic projection module for literacy skills proficiency, which could simulate individual skill trajectories. However, the longitudinal data needed for these parameter estimations do not exist.
In the version of the model used for this study, the projected variations in literacy scores are constrained by the regression model coefficients. The model does not replicate the variation observed in the PIAAC survey data. It would be possible to simulate this variation by randomly choosing a value within the confidence interval of the regression coefficients. However, the projection outcomes would not be substantially different. Indeed, for the sake of testing the extent to which different socio-demographic characteristics influence the future literacy skills, the methodology described in this paper is practical and generates pertinent results.
The microsimulation model imputes a literacy score to individuals based on many characteristics, with literacy scores varying by: age, sex, province of residence, education, language, labour force activity status, age at immigration, length of stay in Canada, country of birth, and country of highest diploma. The projection methodology used in this paper contains far more dimensions than traditional cohort-component projection models. Nonetheless, we are aware that the model omits other pertinent variables such as life-wide factors and immigration category. As discussed in the multivariate regression results section, this limitation is partially mitigated by the remaining variables that capture some of the omitted variable effects.
Discussion and conclusion
Recent labour market transformations toward knowledge-based economies have made basic literacy skills crucial to ensuring both individual and societal well-being. Yet few studies have looked at the determinants of these skills and how projected sociodemographic changes, in the context of increasing ethnocultural diversity, are likely to affect the literacy skills of the working-age population.
The factors linked with literacy proficiency among the working-age population are multiple. Nonetheless, in Canada (and elsewhere), education is the main source of one’s literacy proficiency. Even though the acquisition of literacy skills and learning in general can happen in many different contexts and at each moment throughout the life course, school remains critical to literacy skill formation. Other determinants play significant roles as well, such as the quality of exposure to social capital in early childhood (measured in our study through the mother’s education level).
The factors linked with literacy proficiency are similar among both the foreign- and the native-born populations. For example, we observe an important age effect of similar strength among both groups. Plus, the labour force status and the practice of literacy activities in everyday life (the life-wide factors) have similar effects on the literacy proficiency score of both foreign- and native-born Canadians. However, the average proficiency level of immigrants is significantly lower than the Canadian-born population, ceteris paribus. In fact, the immigrants constitute a sub-group quite heterogeneous in many ways when it comes to literacy skills. Our results precisely show that there are significant differences among immigrants according to the category of admission, as well as according to the country where they were born and educated. Literacy skills of immigrants with a Canadian diploma are roughly 6% higher on average than immigrants with education completed in a developing country. These results are consistent with the scientific literature showing that the quality of education and educational institutions varies across countries and in turn impacts individuals’ literacy skills and the economic returns of these skills (Hanushek and Wößmann 2007; Hanushek et al. 2015; Sweetman 2004). A study found strong evidence that foreign-born Canadians who obtained some or all of their education in Canada are more similar in many respects to the native-born Canadians than to foreign-educated immigrants in terms of literacy skills and labour market outcomes (Bonikowska et al. 2010). Lastly, language skills play a significant role on literacy proficiency. The linguistic dimension comes second, after education, in terms of explanatory power for immigrant literacy proficiency. The literacy skills of foreign-born Canadians whose mother tongue and language spoken at home is neither English nor French are significantly lower than English- and/or French-speaking immigrants.
This skill gap between foreign- and native-born Canadians has important implications on the literacy skills of the future Canadian working-age population. Indeed, the Canadian
demographic context is also characterised by high immigration rates15 which fuel population growth without significantly reducing the pace of demographic aging (Beaujot and Kerr 2015). But other processes affecting literacy levels are currently underway and will likely continue to keep up going in the coming decades. For example, the educational attainment of Canadians is increasing, and the economy focused aspects of Canadian immigration policy is grounded on a points-based selection system which facilitates the entry of high-educated immigrants.
The projection results show how all these socio-demographic changes are likely to impact the overall literacy skill levels of the working-age population. In the baseline scenario, the microsimulation model projects that the sum of these changes would lead to a small negative impact on the average literacy skills. Using differing stylised scenarios, the effects of migration and specifically immigration volume are measured, revealing changes to the projected average literacy scores. The no-immigration scenario (0_IMM) shows how the increasing levels of education completely overtake the sole impact of demographic aging on the projected literacy level. This no-immigration scenario shows an average skill increase among the working-age population thanks to the increasing education level of the younger cohorts joining the labour force.
Immigration may have direct and indirect positive effects on the average skill level of the Canadian working-age population. The projection results shown in Figure 3 explain an interesting and important feature of Canadian immigrant selection policies: their design is already “literacy-oriented”. Under the baseline scenario, the projected literacy proficiency, for the foreign-born
15 Canada’s official immigration plans for 2017-2018 targets 300,000 new permanent residents per year, which
represents a historic high compared to prior years (Immigration, Refugees and Citizenship Canada Departmental Plan 2017 – 2018 retrieved at http://www.cic.gc.ca/english/resources/publications/dp/2017-2018/dp.asp on March 9, 2017). In view of the total Canadian population estimates of January 1, 2017 at 36.5 million, this target corresponds to an immigration rate of 0.82%, which is higher than the baseline scenario (BASE) rate. Among the G7 countries, Canada has the highest immigration rate; in fact, most of these countries have an immigration rate below 0.50%.
population itself, is projected to increase. A potential positive indirect effect is seen under the stylised scenario where immigration volume is doubled (2_IMM). Doubling the number of immigrants does not draw down the average literacy as much as the no-immigration scenario (0_IMM) raises it by 2061. Part of such a non-linear effect of immigration volume on literacy skill can be explained by the fact that second generation Canadians obtain higher education levels on average than natives. Our microsimulation takes such an education differential into account16. Through their children born in Canada (thus categorized as native-born Canadians in this paper), foreign-born Canadians indirectly fuel the increasing educational attainment trends among the total native-born Canadian.
Nonetheless, efforts should be put in place to close the skill gap between foreign- and native-born Canadians. After all, this is about the well-being of all Canadians since people with greater literacy proficiency are more likely to take part in civic activities, more trusting of others, better paid, and less likely to be unemployed. Immigrant integration and selection policies already implemented certainly have a positive effect on closing this skill gap. But there is room for improvement as this gap is twice and even three times larger in Canada than in Australia or New Zealand (Xenogiani 2017), both countries having similar selection systems and immigration rates compared to Canada.
16 In LSD-C education coefficients not only vary by generation status but also by sex, region of residence, visible
References
Augustine, J. M., and D. V. Negraia. 2018. Can Increased Educational Attainment Among Lower-Educated Mothers Reduce Inequalities in Children's Skill Development?
Demography 55(1):59-82, https://doi.org/10.1007/s13524-017-0637-4.
Barone, C., and H. G. van de Werfhorst. 2011. Education, cognitive skills and earnings in comparative perspective. International Sociology
26(4):483-502, https://doi.org/10.1177/0268580910393045.
Beaujot, R., and D. Kerr. 2015. Population Change in Canada. Toronto: Oxford University Press.
Bélanger, A., P. Sabourin, G. Marois, J. Van Hook, and S. Vézina. 2018. A framework for the prospective analysis of super-diversity. (WP-18-008). Laxenburg: International Institute for Applied Systems Analysis.
Bélanger, A., P. Sabourin, S. Vézina, G. Marois, K. D'Ovidio, D. Pelletier, and O. Lafontaine. 2018. "The Canadian microsimulation model (LSD-C): Content, modules, and some preliminary results." In. Montréal: Institut national de la recherche scientifique. Working Paper n° 2018-01. http://espace.inrs.ca/6830/.
Bonikowska, A., D. A. Green, and W. C. Riddell. 2010. Immigrant Skills and Immigrant Outcomes under a Selection System: The Canadian Experience. Paper presented at the Conference on the Economics of Immigration 2010. Ottawa.
Carey, D. 2014. Overcoming Skills Shortages in Canada. OECD Economics Department Working Papers (No. 1143). Paris: OECD
Publishing, https://doi.org/http://dx.doi.org/10.1787/5jz123fgkxjl-en.
Citizenship and Immigration Canada. 2017. Six selection factors – Federal skilled workers (Express Entry). accessed 20 April 2018. https://www.canada.ca/en/immigration-
refugees-citizenship/services/immigrate-canada/express-entry/become- candidate/eligibility/federal-skilled-workers/six-selection-factors-federal-skilled-workers.html.
Coleman, D. 2006. Immigration and Ethnic Change in Low-Fertility Countries: A Third Demographic Transition. Population and Development Review 32(3):401-446, https://doi.org/10.1111/j.1728-4457.2006.00131.x.
Coulombe, S., J.-F. Tremblay, and S. Marchand. 2004. Literacy scores, human capital and growth across fourteen OECD countries. Ottawa: Statistique Canada.
Desjardins, R. 2003a. Determinants of Economic and Social Outcomes from a Life-Wide Learning Perspective in Canada. Education economics 11(1):11-38.
———. 2003b. Determinants of literacy proficiency : a lifelong-lifewide learning perspective.
International Journal of Educational Research 39:205-245.
Green, A. G., and D. Green. 2004. The goals of Canada’s immigration policy: A historical perspective. Canadian Journal of Urban Research, 13(1):102-139.
Green, D., and W. C. Riddell. 2007. Literacy and the Labour Market: The Generation of Literacy and Its Impact on Earnings for Native Born Canadians. (Catalogue no. 89-552-MIE — No.18). Ottawa: Statistics Canada.
Green, D., and C. Worswick. 2017. Canadian economics research on immigration through the lens of theories of justice. Canadian Journal of Economics 50(5):1262-1303.
Hanushek, E. A., G. Schwerdt, S. Wiederhold, and L. Wößmann. 2015. Returns to skills around the world: Evidence from PIAAC. European Economic Review
Hanushek, E. A., and L. Woessmann. 2008. The Role of Cognitive Skills in Economic Development. Journal of Economic Literature
46(3):607-668, https://doi.org/10.1257/jel.46.3.607.
Hanushek, E. A., and L. Wößmann. 2007. The Role of Education Quality in Economic Growth. World Bank Policy Research Working Paper (WPS4122). Washington D.C.: World Bank. Keslair, F. 2017. How much will the literacy level of the working-age population change from
now to 2022? Paris: OECD Publishing.
Levy, F. 2010. How Technology Changes Demands for Human Skills. OECD Education Working Papers (No. 45). Paris: OECD
Publishing, https://doi.org/10.1787/5kmhds6czqzq-en.
Lutz, W. 2013. Demographic Metabolism: A Predictive Theory of Socioeconomic Change.
Population and Development Review 38(s1):283-301, https://doi.org/10.1111/j.1728-4457.2013.00564.x.
McIntosh, S., and A. Vignoles. 2001. Measuring and assessing the impact of basic skills on labour market outcomes. Oxford Economic Papers 53(3):453-481.
OECD. 2016. Skills Matter: Further Results from the Survey of Adult Skills. OECD Skills Studies. Paris: OECD
Publishing, https://doi.org/http://dx.doi.org/10.1787/9789264258051-en. ———. 2017. Survey of Adult Skills (PIAAC). http://www.oecd.org/skills/piaac/.
Papademetriou, D. G., and M. Sumption. 2011. Rethinking Points Systems and Employer-Selected Immigration. Washington, DC: Migration Policy Institute.
Reder, S. 1994. Practice engagement theory: A sociocultural approach to literacy across languages and cultures, in Literacy across languages and cultures, edited by B. M. Ferdman, R.-M. Weber and A. G. Ramirez. Albany NY: State University of New York Press, p. 33-74.
Statistics Canada. 2013. Skills in Canada: First Results from the Programme for the International Assessment of Adult Competencies (PIAAC). (Catalogue no. 89-555-X). Ottawa:
Statistics Canada.
———. 2015. Population Projections for Canada (2013 to 2063), Provinces and Territories (2013 to 2038). (Catalogue no. 91-520-X). Ottawa: Statistics Canada.
———. 2017a. Population growth: Migratory increase overtakes natural increase. accessed 20 April 2018. https://www.statcan.gc.ca/pub/11-630-x/11-630-x2014001-eng.htm. ———. 2017b. Program for the International Assessment of Adult Competencies
(PIAAC). http://www23.statcan.gc.ca/imdb/p2SV.pl?Function=getSurvey&Id=132269. Sweetman, A. 2004. Immigrant Source Country Educational Quality and Canadian Labour
Market Outcomes. Analytical Studies Branch Research Paper Series (Catalogue no. 11F0019MIE — No. 234). Ottawa: Statistics Canada.
Vertovec, S. 2007. Super-diversity and its implications. Ethnic and Racial Studies 30(6):1024-1054, https://doi.org/10.1080/01419870701599465.
Xenogiani, T. 2017. Why are immigrants less proficient in literacy than native-born adults? Paris: OECD Publishing.
TABLE 1. Summary of projection scenario assumptions for the future immigration rate and educational attainment of projected cohorts
Scenario Component Immigration (volume) Education (attainment distribution) Immigration (composition) Baseline (BASE)
0.75% Recent trends Characteristics of recent
immigrants S ty li sed s ce n ar io s No immigration (0_IMM)
0.00% Recent trends Characteristics of recent
immigrants Doubled immigration
rate (2_IMM)
1.50% Recent trends Characteristics of recent
immigrants Low educational attainment (LOW_ED) 0.75% Decline of educational attainment of projected cohorts (towards the level of
the 1951-55 cohort) Characteristics of recent immigrants High educational attainment (HIGH_ED) 0.75% Rise of educational attainment (sharpest increase extrapolated from difference between 1940 and 1976-80 cohorts) Characteristics of recent immigrants “W h at -if ” sel ect io n sc en ar io s Selection on age (SEL_AGE)
0.75% Recent trends Immigrant cohorts are younger
compared to the baseline scenario (10% more persons
aged 0 to 30) Selection on education
(SEL_EDUC)
0.75% Recent trends Immigrant cohorts contain 10%
more people with university degree compared to the baseline
scenario Selection on language
skills
(SEL_LANG)
0.75% Recent trends Immigrant cohorts contain 10%
more people with English (or French) as their mother tongue
than in the baseline scenario Selection on age,
education, and language skills (SEL_AEL)
0.75% Recent trends Combination of
literacy-conducive conditions for age, education, and language skills
TABLE 2. Estimated coefficients from linear regressions with log of literacy score as the dependent variable, stratified by immigration status, complete and simplified models, 25-64 years old, Canada, PIAAC 2012
Variables
Complete Model Simplified Model
Native-born Foreign-born Native-born Foreign-born β ln(Literacy score) Sociodemographic variables
Sex Male (Ref. Cat)
Female -0.019* -0.011 -0.008 -0.007
Age group
25-34 years old (Ref. Cat.)
35-44 years old -0.012 -0.005 -0.014 -0.011
45-54 years old -0.032* -0.054* -0.040* -0.066* 55-64 years old -0.037* -0.043* -0.056* -0.056*
Province of residence
Ontario (Ref. Cat.)
Quebec -0.010 -0.016 -0.016 -0.019
British Columbia -0.008 -0.019 0.002 -0.012
Alberta -0.001 0.028 0.002 0.021
Manitoba & Saskatchewan -0.017 -0.034 -0.019* -0.029 Atlantic Provinces -0.030* 0.029 -0.038* 0.055* Urban/Rural Urban (Ref. Cat.)
Rural -0.003 0.041
Human capital variables Highest level of
education
High school diploma and other post-secondary (Ref. Cat.)
Less than high school diploma -0.153* -0.210* -0.187* -0.246* University diploma 0.089* 0.109* 0.119* 0.150* Mother tongue
and language spoken at home
Mother tongue: English (Ref. Cat.)
Mother tongue: French -0.025* -0.036 -0.032* -0.037
Mother tongue: Other /Home language: EN or FR -0.013 -0.025 -0.021 -0.044*
Mother tongue: Other /Home language: Other -0.105* -0.066* -0.122* -0.097* Socioeconomic variables and life-wide factors
Mother's level of education
Less than high school diploma (Ref. Cat.)
High school diploma and other post-secondary 0.027* 0.034*
University diploma 0.036* 0.058*
Missing -0.061* -0.022
Literacy activities at home
Weekly or daily (Ref. Cat.)
Less than once a week -0.040* -0.036*
Labour force status and literacy skills use at work
Active - Weekly or daily (Ref. Cat.)
Active - Less than once a week -0.057* -0.051*
Inactive -0.073* -0.068* -0.020*† -0.040*†
Immigration and integration variables Age at
immigration
Before 15 years old (Ref. Cat.)
At 15 years or older -0.025 -0.025
Length of stay in Canada
15 years or more (Ref. Cat.)
0-4 years -0.021 -0.021
5-9 years -0.016 -0.010
10-14 years -0.025 -0.018
Immigration category
Points-based system (Ref. Cat.)
Sponsored Family -0.045*
Resettled Refugee -0.064*
Other Immigration 0.004
Variables
Complete Model Simplified Model
Native-born Foreign-born Native-born Foreign-born Poor country -0.033 -0.065* Country of highest diploma
Canada (Ref. Cat.)
Rich country -0.032
Poor country -0.063* -0.062*
Constant 5.698* 5.708* 5.668* 5.703*
Sample size (n) 16,132 3,463 16,132 3,463
Adjusted R² 0.339 0.385 0.291 0.345
TABLE 3. Projected average literacy proficiency score variation between 2011 and 2061, according to different immigrant selection scenarios, 25-64 years old, Canada
Scenario Literacy score variation
2011-2061 Baseline (BASE) -0.5% Selection on age (SEL_AGE) -0.3% Selection on education (SEL_EDUC) -0.2%
Selection on language skills
(SEL_LANG) -0.1%
Selection on age, education, and language skills
FIGURE 1. Average literacy scores and scores at the 5th, 25th, 50th (median), 75th, and 95th percentiles of population aged 25 to 64 years old by immigration status and other selected characteristics, Canada, 2012 279.7 254.4 291.9 286.2 274.3 266.5 228.2 275.1 312.2 265.8 260.2 245.2 246.8 190.5 243.6 278.3 277.8 248.2 250.0 254.6 253.5 255.1 0 100 200 300 400 500 Native-born Canadians Foreign-born Canadians 25-34 years old 35-44 years old 45-54 years old 55-64 years old Less than HSD (high school diploma) HSD and other post-secondary University diploma 25-34 years old 35-44 years old 45-54 years old 55-64 years old Less than HSD (high school diploma) HSD and other post-secondary University diploma Before 15 years old At 15 years or older 0-4 years 5-9 years 10-14 years 15 years or more A g e gr o up H ig h es t le v el of e duc at ion A g e gr o up H ig h es t le v el of e duc at ion A g e at im m ig ra ti on L en g th o f s ta y in C an ad a T OT AL NAT IVE -B O R N C ANADI AN S F O R E IGN-B O R N C ANADI AN S Literacy scale Average Score
FIGURE 2. Projected average literacy proficiency score, according to different stylised scenarios with respect to immigration (left) and education (right), 25-64 years old, 2016-2061, Canada
Immigration scenarios Education scenarios
255 260 265 270 275 280 285
BASE 0_IMM 2_IMM
255 260 265 270 275 280 285
FIGURE 3. Projected average literacy proficiency score of the foreign-born population, according to different “what-if” scenarios with respect to immigrant selection, 25-64 years old, 2016-2061, Canada Foreign-born Canadians 250.2 +1.6 +2.0 +2.5 +5.6 246 248 250 252 254 256 258
BASE SEL_AGE SEL_EDUC