Publisher’s version / Version de l'éditeur:
Journal of Applied Polymer Science, 77, June 8, pp. 1782-1793, 2000
READ THESE TERMS AND CONDITIONS CAREFULLY BEFORE USING THIS WEBSITE. https://nrc-publications.canada.ca/eng/copyright
Vous avez des questions? Nous pouvons vous aider. Pour communiquer directement avec un auteur, consultez la première page de la revue dans laquelle son article a été publié afin de trouver ses coordonnées. Si vous n’arrivez pas à les repérer, communiquez avec nous à PublicationsArchive-ArchivesPublications@nrc-cnrc.gc.ca.
Questions? Contact the NRC Publications Archive team at
PublicationsArchive-ArchivesPublications@nrc-cnrc.gc.ca. If you wish to email the authors directly, please see the first page of the publication for their contact information.
Archives des publications du CNRC
This publication could be one of several versions: author’s original, accepted manuscript or the publisher’s version. / La version de cette publication peut être l’une des suivantes : la version prépublication de l’auteur, la version acceptée du manuscrit ou la version de l’éditeur.
For the publisher’s version, please access the DOI link below./ Pour consulter la version de l’éditeur, utilisez le lien DOI ci-dessous.
https://doi.org/10.1002/1097-4628(20000822)77:8<1782::AID-APP15>3.0.CO;2-5
Access and use of this website and the material on it are subject to the Terms and Conditions set forth at
Solvent and pH resistance of surface crosslinked
chitosan/poly(acrylonitrile) composite nanofiltration membranes
Musale, Deepak A.; Kumar, Ashwani
https://publications-cnrc.canada.ca/fra/droits
L’accès à ce site Web et l’utilisation de son contenu sont assujettis aux conditions présentées dans le site LISEZ CES CONDITIONS ATTENTIVEMENT AVANT D’UTILISER CE SITE WEB.
NRC Publications Record / Notice d'Archives des publications de CNRC:
https://nrc-publications.canada.ca/eng/view/object/?id=7061facc-aa35-4de0-aa8f-b850f2ee933b https://publications-cnrc.canada.ca/fra/voir/objet/?id=7061facc-aa35-4de0-aa8f-b850f2ee933bPoly(acrylonitrile) Composite Nanofiltration Membranes
DEEPAK A. MUSALE, ASHWANI KUMAR
Institute for Chemical Process and Environmental Technology, National Research Council Canada, M-12, Montreal Road, Ottawa, ON, K1A 0R6, Canada
Received 12 May 1999; accepted 20 November 1999
ABSTRACT: The resistance of novel surface crosslinked Chitosan/poly(acrylonitrile) (PAN) composite nanofiltration (NF) membranes to pH and organic solvents was studied with respect to the effects of crosslinking parameters, namely, glutaraldehyde concentration and crosslinking time. The pH resistance was determined by permeation of aqueous acidic (pH 2.5) and basic (pH 11) solutions as well as swelling studies in the pH range of 2.5–11. The solvent resistance was determined by swelling, immersion, and permeation studies with several industrially important organic solvents, namely meth-anol, ethmeth-anol, iso-propmeth-anol, methyl ethyl ketone, ethyl acetate and hexane. It was observed that the crosslinked composite membranes maintain the permeate fluxes for test solvents for 2 h of continuous operation without any significant change in flux. SEM studies on membrane samples after immersion as well as permeation with the above-mentioned solvents indicated that the membrane morphology was maintained. The results are explained in terms of solvent–membrane polar and hydrophobic interac-tions, using solubility parameters of membrane and solvents and dielectric constants of solvents. Pure water flux and polyethylene glycol transmission data indicated that at pH 2.5 and 11, the membrane stability increased with increasing glutaraldehyde concentration and was much better at pH 11 than at pH 2.5. All surface crosslinked membranes showed reduced swelling between pH 4 –10.© 2000 John Wiley & Sons, Inc. J Appl Polym Sci 77: 1782–1793, 2000
Key words: poly(acrylonitrile); chitosan; nanofiltration; composite membranes; sol-vent resistance; nonaqueous
INTRODUCTION
Industries utilizing solvents and generating sol-vent laden waste streams are increasingly inter-ested in waste minimization, solvent recovery and treatment of waste streams. In many instances, stringent environmental regulations and greater willingness of environmental agencies to enforce the law1 drives this approach. These industries include petrochemical, food, biotechnology, fine chemicals, pharmaceuticals, paints and coatings,
electronics, and others. Conventional technolo-gies such as incineration, distillation, steam stripping, biological treatment and activated car-bon adsorption have been successful for minimi-zation of solvent waste or solvent recovery in cer-tain cases.1 However, due to higher energy con-sumption in some of these processes, there is a great potential for new technologies such as mem-brane-based separations.
Membrane separation technology has proven to be very successful in processing aqueous streams. However, use of membrane-based sepa-ration schemes for processing nonaqueous streams has not been widespread. Many such schemes are still in a developmental stage. One of
Contract grant sponsor NRCC; contract grant number 41999
Journal of Applied Polymer Science, Vol. 77, 1782–1793 (2000) © 2000 John Wiley & Sons, Inc.
the main reasons for this is the lack of commercial membranes and modules that could withstand organic solvents for a reasonable time without decline in performance. Membranes made from ceramics and specialized polymers such as poly-imides are available for selected applications; however, these are very expensive and generally not available in the lower molecular weight cutoff (nanofiltration) range.2Therefore, there is an im-mediate need for research in developing new eco-nomical solvent resistant nanofiltration mem-branes. Published literature3,4on development of polymeric membranes and studies on their sol-vent resistance is lacking partly due to its indus-trial importance. There are some studies on per-meation of either pure solvents or solutions in organic solvents using commercial mem-branes.5–12
Polymeric membranes after contact with or-ganic solvent may result in one of the following:13 (a) no chemical effect; (b) little swelling, mem-brane may be compatible for short-term use; (c) extensive swelling and slow dissolution of mem-branes; (d) complete dissolution or disintegration of membranes; or (e) the relaxation of polymer chains due to plasticization in solvent results in swelling with subsequent pore size reduction.
Therefore, it is of interest to study the forma-tion of NF membranes that would offer resistance to swelling with a wider range of industrially important organic solvents. To achieve this goal, the selection of polymers and the membrane for-mation method is very important. Nanofiltration (NF) membranes are generally composite in na-ture, with an ultrafiltration (UF) membrane as a substrate and a thin layer of another polymer as a selective barrier. Poly(acrylonitrile) (PAN) is one of the versatile polymers that is widely used for making membranes, and offers good resis-tance to a wide range of solvents. Chitosan, a natural hydrophilic biopolymer, also possesses excellent solvent resistance. However, formation of homogeneous NF membranes is not feasible with either of these polymers.
Therefore, a composite NF membrane with PAN UF membrane as a substrate with a thin layer of Chitosan could offer resistance to a wider range of solvents. Additionally, a hydrophilic sur-face of these membranes would be desirable for protein separation. Proteins are known to reduce permeate fluxes due to adsorption on membranes by hydrophobic interactions.14
The aim of the present study was to investigate effects of surface crosslinking of Chitosan/PAN
composite NF membranes on their resistance to pH and industrially important solvents. Because Chitosan is soluble below pH 6.5, the main objec-tive of crosslinking was to ameliorate pH stability below pH 6.5, reduce the swelling with polar sol-vents such as alcohols, and increase the affinity and hence permeation rates for nonpolar solvents such as hydrocarbons. The effects of crosslinking parameters, namely glutaraldehyde concentra-tion and crosslinking time (CT) on solvent perme-ation and pH stability were also investigated.
EXPERIMENTAL
Materials
Poly(acrylonitrile) (PAN) and Chitosan were of the same characteristics and purity as reported previously.15 Methanol (MeOH), iso-propanol (IPA), methyl ethyl ketone (MEK), ethyl acetate (EtOAc), and hexane (a mixture of C6 isomers) were procured from BDH, Canada, while ethanol (EtOH) was obtained from Commercial Alcohols Ltd, Canada. Glutaraldehyde was obtained from Aldrich, Milwaukee, WI, while all other reagents were obtained from Anachemia, Canada, and used as received. Reverse osmosis-treated water with a conductivity of 531024 S m21 was used for membrane preparation, pH stability, and swelling studies.
Preparation of Surface Crosslinked Chitosan/PAN Composite NF membranes (PANCHINF)
The details of the preparation of Chitosan/PAN composite NF membranes and subsequent sur-face crosslinking have been reported previous-ly.16,17In brief, the Chitosan solution was coated on surface-dried PAN ultrafiltration base mem-brane. After drying and treating with aqueous (aq.) alkali, these membranes were surface crosslinked for 0.5 and 1 h each with 0.08, 0.2, and 0.5% w/w glutaraldehyde solution. The NF characteristics of these membranes such as pure water flux, molecular weight cutoffs, rejection of salts, and sugars were reported previously.16,17
pH Stability
The pH stability of these membranes was deter-mined from the change in pure water flux and polyethylene glycol (PEG, MW 600 Da) transmis-sion measured before and after the filtration of aq. acidic (pH 2.5) or basic (pH 11) solution for 1 h.
The pH stability was also determined by mea-suring swelling18(S) [%S 5 (W
w2 Wd/Wd)100] of
these membranes in the pH range of 2.5–12 under static conditions, where Wd and Ww are the weights of dry and wet membrane samples, re-spectively. The wet weight, Ww,was obtained by incubating membranes at 25°C for 24 h in water adjusted to desired pH with 2 N HCl or NaOH, and gentle blotting by tissue paper before weigh-ing.
Solvent Resistance Static Swelling
The solvent resistance was determined from swelling studies of dried membranes in test sol-vents, measured at 22°C after 24 h under static conditions. For this study, membranes were dried by solvent exchange with 50% aq. IPA, IPA and hexane for 0.5 h with each solvent in that se-quence, followed by vacuum drying for 24 h at 40°C. The percentage swelling was then calcu-lated in a similar way to that of pH swelling study.
Immersion Studies
The solvent resistance was also determined from the change in pure water flux measured before and after immersing membranes in test solvents for 20 h at 22°C. In case of alcohols, the sequence of solvent immersion was: 50% aq. alcohol (0.5 h), corresponding pure alcohol (20 h), 50% aq. alcohol (0.5 h) and water. In the case of MEK, EtOAc, and hexane, the sequence was: 50% aq. IPA (0.5 h), IPA (0.5 h), MEK, EtOAc, or hexane (20 h), IPA (0.5 h), 50% aq. IPA (0.5 h) and water. The stirred cell assembly (Amicon, 1.3 3 1023m2, 600 rpm) was used for measuring pure water flux at 480 kPa and 25°C.
Solvent Permeation
The results of swelling and immersion studies were supported by measuring actual permeation rates of solvents through PANCHINF membranes as a function of time. To avoid the damage to pore structure of membranes due to higher difference in surface tension of water and test solvents, they were immersed in solvents with decreasing sur-face tension, prior to testing. In the case of alco-hols (MeOH, EtOH, IPA), membranes were first immersed in 50% aq. alcohol and then twice in corresponding pure alcohol for 0.5 h in each
sol-vent before placing the membrane in test cell. In the case of MEK, EtOAc, and hexane, the immer-sion sequence was 50% aq. IPA, IPA, and then twice in the test solvent for 0.5 h in each solvent. This was followed by measuring the solvent flux every 30 min up to 2 h at a temperature, pressure and crossflow velocity values of 2360.3°C, 830 kPa, and 0.93 m s21, respectively. The solvent fluxes were measured after pressurizing mem-branes at 900 kPa for 20 min, to minimize the effects of membrane compaction. The membrane test setup shown in Figure 1 was used for solvent permeation. The materials of construction such as piping and fittings were chosen to be resistant to the test solvents. A diaphragm pump with PTFE (Teflon) diaphragm was used to pump the feed solution. Permeate vials were covered with alu-minum foil to avoid the solvent losses due to evap-oration at ambient conditions.
Membrane Morphology
The effect of solvent treatment on membrane morphology was investigated by taking Scanning Electron Micrographs (SEM) of the surfaces of membrane samples after static swelling and sol-vent permeation tests. The samples after solsol-vent permeation were also investigated for morpholog-ical changes in their cross sections. The scanning conditions and equipment were same as used pre-viously.15
RESULTS AND DISCUSSION
pH Stability
Because Chitosan is soluble in acidic solutions (pH ,6.5) due to protonation of —NH2 groups, the surface crosslinking of PANCHINF mem-Figure 1 Schematic of membrane test setup for sol-vent permeation.
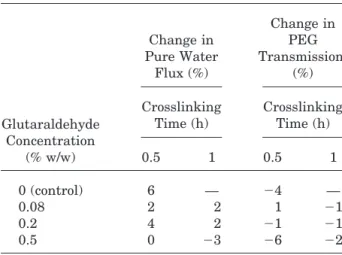
branes is expected to reduce the number of —NH2 groups of Chitosan and hence reduce the solubil-ity below pH 6.5. Although PAN membranes are stable19up to pH 10, composite membrane forma-tion with Chitosan and subsequent surface crosslinking might improve the pH stability of composite membranes. Therefore, the pH stabil-ity was also investigated in basic solution (pH 11). Tables I and II show effects of glutaraldehyde concentration and CT on the change in pure water flux and PEG transmission after aq. acidic (pH 2.5) and basic (pH 11) solution treatment, respec-tively. The PEG with MW 600 Da was chosen as a test solute because most of the membranes crosslinked under present crosslinking conditions had molecular weight cutoff of about 600 Da.16,17 Both flux and PEG transmission values in Tables I and II are the average of two data sets with the standard deviation of 5 and 6% in case of fluxes and PEG transmission respectively.
It is clear from Table I that the changes in both pure water flux and PEG transmission after aq. acidic solution treatment decrease with increas-ing glutaraldehyde concentration at all CTs, indi-cating the higher stability at 0.5% glutaraldehyde concentration. This behavior is attributed to the increased crosslink density of Chitosan with less number of —NH2 groups of Chitosan remaining for protonation, and hence dissolution, with in-creasing glutaraldehyde concentration. For the similar reasons changes in both flux and PEG transmission decreased at 1 h CT.
In general, Table II shows similar trends of changes in flux as well as PEG transmission as that observed in the case of pH 2.5 solution treat-ment (Table I). However, at pH 11, changes with glutaraldehyde concentration are not significant,
and changes in flux are about an order of magni-tude smaller than those for pH 2.5. The slight changes in membrane performance after aq. basic solution treatment may be due to Chitosan swell-ing that is higher at lower glutaraldehyde concen-tration (lower crosslink density) and decreases with increasing glutaraldehyde concentration. The data from Tables I and II clearly indicates that the PANCHINF membranes are more stable at pH 11 than at pH 2.5 after crosslinking.
The typical data for swelling of PANCHINF membranes as a function of pH at different glutar-aldehyde concentrations are shown in Figure 2(a) and (b) for CT of 0.5 and 1 h, respectively. It is apparent from Figure 2(a) and (b) that the swelling is higher at pH 2.5 and 12 among the pH range studied, while it is relatively constant between pH 4 –10. The higher swelling at pH 2.5 may be due to protonation of —NH2groups, while at pH 12 it may be due to —NH2
group formation from the residual —NH2 groups of Chitosan or slight hydrolysis of PAN and, hence, more water absorption in both cases. As expected, crosslinking has improved the pH stability below pH 6.5 up to pH 4; however, these membranes still could not be recommended for use below pH 4 and above pH 10.
Solvent Resistance
The four classes of organic solvents, namely alco-hols, ketones, esters, and aliphatic hydrocarbons, which are commonly used in many chemical pro-cess industries, were selected for testing the re-sistance of PANCHINF membranes. The solvents selected from each class are listed with their rel-evant physical properties in Table III. It can be seen from Table III that the molecular weight
Table II Membrane Stability at pH 11
Glutaraldehyde Concentration (% w/w) Change in Pure Water Flux (%) Change in PEG Transmission (%) Crosslinking Time (h) Crosslinking Time (h) 0.5 1 0.5 1 0 (control) 6 — 24 — 0.08 2 2 1 21 0.2 4 2 21 21 0.5 0 23 26 22
Table I Membrane Stability at pH 2.5
Glutaraldehyde Concentration (% w/w) Change in Pure Water Flux (%) Change in PEG Transmission (%) Crosslinking Time (h) Crosslinking Time (h) 0.5 1 0.5 1 0 (control) 194 — 91 — 0.08 134 111 12 3 0.2 98 56 3 22 0.5 29 44 210 215
increases in the order: MeOH , EtOH , IPA , MEK , EtOAc ' hexane, while solubility pa-rameter (d) and dielectric constant (e) show the opposite trend.
Swelling Studies
The swelling data of PANCHINF membranes in various solvents as a function of glutaraldehyde concentration are shown in Figure 3(a) and (b) for CT of 0.5 and 1 h, respectively. Each data point presented is the average of four replicates, and the corresponding average standard deviation for each solvent is also shown in Figure 3(a) and (b). It is apparent from Figure 3(a) and (b) that the swelling with each solvent is marginally lower at 0.2% glutaraldehyde; otherwise, it is independent of glutaraldehyde concentration. Figure 3(a) shows that swelling in the control membrane is lower than that in crosslinked membranes for each solvent. The slight increase in swelling after crosslinking may be due to an increase in hydro-phobicity of membranes, caused by insertion of nonpolar 5CH—(CH2)3—CH5 links between Chitosan chains, resulting in increased affinity with organic solvents.
However, further crosslinking results in pore size reduction and then formation of defects at 0.5 % glutaraldehyde.16Therefore, swelling (solvent holding capacity) initially decreases and again increases at 0.5% glutaraldehyde for both 0.5 [Fig. 3(a)] and 1 h [Fig. 3(b)] CT. Although there appears to be a trend in swelling with glutaralde-hyde concentration, the overall change is not sig-nificant. However, there appears to be a trend among solvents studied, and is discussed below.
The top selective layer of Chitosan has polar hydroxy groups; hence, membrane–solvent polar Figure 2 Effect of pH on swelling of membranes
crosslinked with 0 (}), 0.08 (■), 0.2 (Œ), and 0.5% (3) glutaraldehyde for CT of (a) 0.5 and (b) 1 h.
Table III Relevant Physical Properties of Solvents22
Solvent Molecular Weight (g/mol) Absolute Viscosity at 25°C (cP) Hildebrand Solubility Parameter (d) (cal/cm3)1/2 Dielectric Constant («) at 20°C Alcohols Methanol 32 0.6 14.5 32.6 Ethanol 46 1.08 13.4 24.3 Iso-propanol 60 2 11.5 18.3 Ketones
Methyl ethyl ketone 72 0.41 9.3 15.4
Esters
Ethyl acetate 88 0.45 9.1 6.02
Aliphatic hydrocarbons
interactions are more likely to govern the mem-brane swelling, and can be related to dielectric constant of solvents. Thus, the swelling is least in the case of nonpolar hexane (e 5 1.9), while it is higher for relatively polar alcohols (e 5 18.3–32.6) at both CTs. The swelling with MEK (e 5 15.4) and EtOAc (e 5 6.02) is between that with hexane and alcohols. This clearly indicates that swelling of membranes strongly depends on membrane– solvent polar interactions. Farnand et al.6 have also emphasized the importance of dielectric con-stant of solvent on the performance of cellulose acetate reverse-osmosis membranes for separa-tion of inorganic salts from water, methanol, and ethanol solutions.
The trend in swelling of membranes with var-ious solvents can also be correlated to solubility parameters of solvent (ds) and membrane (dm).
Solubility parameters for various solvents are re-ported in Table III, while that of Chitosan was calculated using group contribution to molar at-traction constant (F) and molar volume of Chi-tosan, as explained in Appendix. The dm of Chi-tosan is likely to increase after crosslinking due to contribution from glutaraldehyde moieties; how-ever, for discussion of results, dmof uncrosslinked Chitosan was used. The swelling of substrate ma-terial in composite membranes is also an impor-tant factor that determines the membrane perfor-mance. The difference between solubility param-eters of membrane and solvent (Dd) was calculated for Chitosan (d 5 10.16, Appendix) and PAN (d 5 12.5, ref. 20), and are shown in Table IV. In general, more swelling would be expected for a membrane–solvent combination with a smaller Dd value. It is clear from Table IV that DdChitosan is smaller for IPA, MEK, and EtOAc; therefore, these solvents are likely to have more affinity with Chitosan than MeOH, EtOH, and hexane. On the other hand, DdPANvalues indicate that alcohols are likely to have more affinity with PAN. Therefore, trends in swelling in Figure 3(a) and (b) indicate that contribution of PAN swelling could be higher in total swelling in the case of alcohols, whereas in the case of MEK and EtOAc, Chitosan is likely to swell more than PAN.
The importance of solubility parameters in membrane–solvent interactions has also been em-phasized by Nomura et al.5 while studying the permeation of cyclohexane through various mem-branes.
Immersion Studies
The typical data for change in pure water flux of membranes after immersion in various test sol-vents is shown in Table V. It is observed from Table V that there are no definite trends in change in water fluxes with glutaraldehyde
con-Table IV Difference (Dd) in Solubility Parameters of Chitosan and PAN with Various Solvents
Solvent DdChitosan(dS-dChitosan) DdPAN(dS-dPAN)
MeOH 4.3 2.0 EtOH 3.2 0.9 IPA 1.3 21.0 MEK 20.9 23.2 EtOAc 21.1 23.4 Hexane 22.9 25.2
Figure 3 Effect of glutaraldehyde concentration on swelling of membranes in MeOH (}), EtOH (■), IPA (Œ), MEK (3), EtOAc (*), and hexane (F) for CT of (a) 0.5 and (b) 1 h.
centrations or CTs. However, it is important to note that there is no significant change in pure water flux after immersion in a test solvent with any of the membranes. It can be inferred from this observation that membranes do maintain their physical and chemical structure after im-mersion in solvents. To get corroborative support, changes in membrane morphology after immer-sion in solvents were studied using scanning elec-tron microscopy. Figure 4(a) and (b) show scan-ning electron micrographs of surfaces of represen-tative PANCHINF membrane before and after immersion in solvent (MEK), respectively. It is apparent that there is no significant change in the membrane morphology after immersing in sol-vent. A similar observation was made with mem-branes formed at all other glutaraldehyde concen-trations and CTs, for each solvent. This observa-tion supports the conclusion that membrane integrity was maintained even after immersing them in solvents for an appreciable time of 20 h.
Solvent Permeation
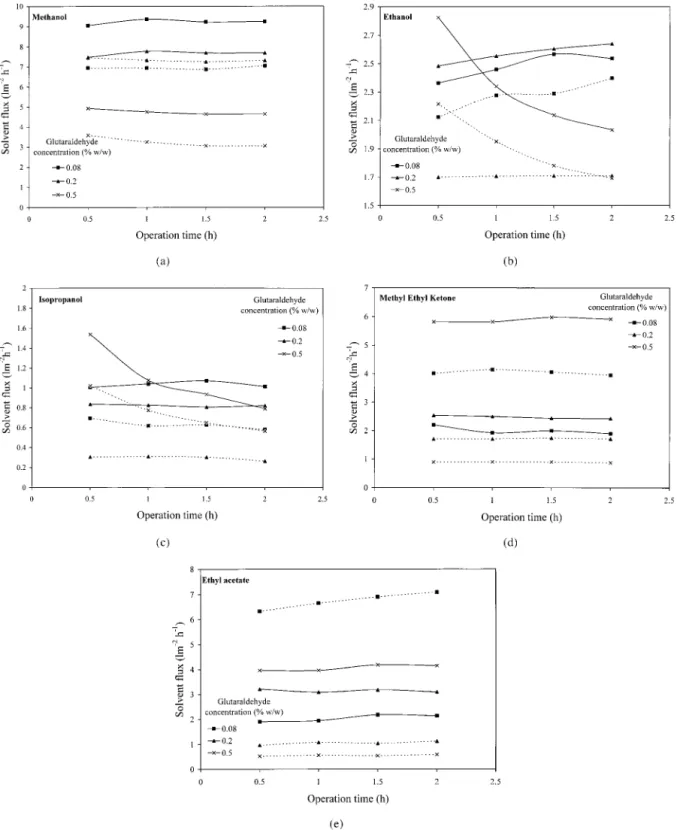
Based on the results of static swelling and immer-sion studies, actual solvent permeation rates were measured as a function of operation time to investigate the solvent resistance of membranes. The solvent fluxes as a function of operation time are shown in Figure 5(a)–(e) for membranes crosslinked with different glutaraldehyde concen-trations and CTs, for permeation of MeOH, EtOH, IPA, MEK, and EtOAc, respectively. The values
presented are an average of two data sets with the corresponding standard deviation of 14, 9, 12, 9, and 14%.
Alcohols
Figures 5(a)–(c) show that solvent flux decreases in the order: MeOH . EtOH . IPA. This may be due to the combined effects of an increase in mo-lecular weight, viscosity, hydrophobicity, and a decrease in the dielectric constant of alcohol (Ta-ble III) in that order. Another important observa-tion from Figure 5(a)–(c) is that the magnitude of highest flux decreases with an increase in hydro-phobicity of solvent as well as membranes. The increase in membrane hydrophobicity with in-creasing glutaraldehyde concentration in the case of PANCHINF membranes has been reported pre-viously.16Thus, the solvent– glutaraldehyde con-centration pairs for the highest flux are—MeOH: 0.08%, EtOH: 0.2%, and IPA: 0.5%. This observa-tion also supports the fact that solvent flux strongly depends on membrane–solvent polar and hydrophobic interactions.
As can be seen from Figure 5(a), the MeOH flux decreases with increasing glutaraldehyde concen-tration as well as CT. This may be attributed to a decrease in pore size and an increase in hydro-phobicity of membranes with increasing glutaral-dehyde concentration or CT.16An increase in hy-drophobicity of membranes results in reduced po-lar interactions, and hence, reduced affinity with MeOH. The MeOH fluxes in this study are of
Table V Change in Pure Water Flux (%) after Immersion in Solvent
Glutaraldehyde Concentration
(% w/w) Methanol Ethanol Iso-propanol
Methyl Ethyl
Ketone Ethyl Acetate Hexane Control 0 0 4 5 2 1 1 Crosslinking Time: 0.5 h 0.08 24 4 11 21 22 1 0.2 12 8 11 1 23 2 0.5 25 24 4 21 21 21 Crosslinking Time: 1 h 0.08 10 25 214 23 22 4 0.2 9 8 3 2 21 1 0.5 8 12 25 21 23 21
similar magnitudes to those observed by Raman et al.10for six commercial NF membranes under similar pressure and temperature conditions.
In the case of EtOH [Fig. 5(b)] and IPA [Fig. 5(c)], the solvent flux decreases with time for membranes crosslinked with 0.5% glutaralde-hyde, the decrease being more in IPA than EtOH. This indicates strong hydrophobic interactions between relatively hydrophobic alcohols and membranes with maximum hydrophobicity16 in the present study. This may result in the loosen-ing of the membrane structure and a subsequent change in pore geometry of the selective Chitosan layer. To verify this possibility, scanning electron
micrographs of membranes after EtOH and IPA permeation were taken, and are shown in Figure 6(a) and (b) for surfaces and 6(c) and (d) for cross sections, respectively. It is seen from Figure 6(a) and (b) that in the case of both EtOH and IPA permeation, the roughness of membrane surface has increased compared to that of the virgin membrane [Fig. 4(a)]. This observation clearly supports the above conclusion of a change in the surface morphology/pore geometry in the case of EtOH and IPA permeation, which in turn, may be due to lower Dd values for these two solvents. It may be recalled that in static immersion studies with these solvents, there was no change in sur-face morphology. Therefore, changes in sursur-face roughness observed in permeation experiments may be due to dynamic conditions of experiment, namely, the crossflow of solvent under applied pressure. Because DdPAN values are smaller for both EtOH and IPA (Table IV), there is a slight change in swelling in the asymmetric layer of the PAN substrate, and this can be observed in Fig-ure 6(c) and (d). These observations are consistent with relatively higher swelling observed in these alcohols [Fig. 3(a) and (b)].
It was also observed that the change in solvent flux from 0.5 to 1 h CT was higher for both EtOH and IPA than for MeOH. This indicates that hy-drophobicity of both solvents as well as mem-branes does play an important role in the perme-ation performance of membranes.
MEK and EtOAc
Although molecular weights of MEK and EtOAc are higher and dielectric constants are lower than that of EtOH (Table III), the MEK and EtOAc fluxes [Fig. 5(d) and (e)] are similar to that of EtOH [Fig. 5(b)]. This may be attributed to the lower viscosities of both MEK and EtOAc than that of EtOH (Table III). The solvent flux for both MEK and EtOAc increases with increasing glu-taraldehyde concentration at 0.5 h CT, while the opposite trend is observed at 1 h CT. It was re-ported that at 0.5 h CT, the hydrophobicity of membranes increased with increasing glutaralde-hyde concentration,16and both MEK and EtOAc are relatively more hydrophobic (less polar) than alcohols (Table III). Therefore, stronger affinity through membrane–solvent hydrophobic interac-tions leads to higher permeation of these solvents. The SEM studies showed no significant changes in either surface morphology or cross-sectional characteristics of membranes samples after MEK
Figure 4 Scanning electron micrograph of surface of representative PANCHINF membranes (a) before and (b) after immersion in solvent (MEK).
or ETOAc permeation. This result is consistent with lower swelling in these two solvents com-pared to alcohols [Fig. 3(a) and (b)].
Hexane
Table III shows that molecular weight of hexane is similar to that of EtOAc and viscosity is lowest Figure 5 Effect of operation time on solvent flux for membranes crosslinked with 0.08
(■), 0.2 (Œ), and 0.5% (3) glutaraldehyde for CT of 0.5 h (solid lines) and 1 h (dashed lines), for (a) MeOH, (b) EtOH, (c) IPA, (d) MEK, and (e) EtOAc.
among the solvents studied. Based only on molec-ular exclusion mechanism, one would expect the permeation of hexane through membranes in the present study, which have the molecular weight cutoff of ;600 Da.16However, there was no sig-nificant permeation observable for hexane, even after the 2-h operation. This may be attributed to the lowest dielectric constant, maximum hydro-phobicity and higher Dd for hexane (Table IV). Although crosslinking increases hydrophobicity of the membranes, it seems that the increase is not adequate for nonpolar hexane, and hence, no permeation was observed.
The key observations from Fig. 5(a)–(e) are: (a) solvent flux remains almost constant with operation
for 2 h except for EtOH and IPA at 0.5% glutaral-dehyde concentration and both 0.5 and 1 h CTs; (b) the decrease in solvent flux at 1 h CT relative to that at 0.5 h CT is an inverse function of dielectric constant of solvent as shown in Figure 7, i.e., higher the dielectric constant of solvent, the lower the flux decrease. This behavior also indicates the depen-dence of solvent permeation rates to solvent–mem-brane polar interactions.
Thus, swelling, immersion, and permeation studies with test solvents indicate that resistance of PANCHINF membranes to these solvents is excellent. It is also important to note that the membrane performance depends on the combined effects of solubility parameter, dielectric
con-Figure 6 Scanning electron micrographs of surfaces of (a) EtOH and (b) IPA perme-ated membranes samples, while (c) and (d) show the corresponding cross sections, for membranes crosslinked with 0.5% glutaraldehyde.
stant, and viscosity of solvents and the solubility parameter of membrane material.
This study has concluded that there is a poten-tial for PANCHINF membranes for permeation of some industrially important solvents or waste streams containing traces of solvents. However, for developing practical applications, longer term permeation data with solvents needs to be col-lected and evaluated.
CONCLUSIONS
The novel surface crosslinked Chitosan/PAN com-posite NF membranes were found to be more sta-ble at pH 11 than at pH 2.5 and the stability at
both pH values generally increased with increas-ing glutaraldehyde concentration. This was due to an increase in crosslinking, and hence, less of a number of —NH2 groups of Chitosan remained available for protonation and subsequent dissolu-tion at pH 2.5. At pH 11, the stability increased with glutaraldehyde concentration due to reduced swelling. Based on the swelling studies, the rec-ommended usage of these membranes was in the pH range of 4 –10.
The static swelling was least for nonpolar hex-ane, higher for alcohols, and in between for MEK and EtOAc. This trend indicated the strong de-pendence of membrane swelling on dielectric con-stant of solvents. The swelling was also found to depend on the difference between the solubility parameters of solvents and membranes. As ex-pected, the swelling was higher in the case of solvents having comparable solubility parameter to that of membrane.
The solvent immersion studies and membrane morphology indicated that these membranes do maintain their structure after contact with test solvents for appreciable time. In flow-through tests, solvent fluxes were maintained up to 2 h, which indicated excellent solvent resistance of these membranes.
Generally, the solvent flux decreased with in-creased glutaraldehyde concentration or cross-linking time (CT). This might be due to decrease in pore size and increase in hydrophobicity of membranes with increasing glutaraldehyde con-centration or CT. However, in the case of MEK
The Contributions of Different Groups to Molar Attraction Constant (F) are Tabulated Below20,21:
Group Molar Attraction Constant (F) [(MPa)1/2cm3mol21]
Chitosan–NH2 Chitosan–NHCOCH3 OCOOOCO 235 3 2 235 3 2 ONH2 464 Ring-6 248 248 OCH2O 269 269 OCHO 176 3 5 176 3 5 OOH 462 462 ONHO 368 .CAO 538 OCH3 303 Total (SF) 2497 3242
Therefore, actual total molar attraction constant (SF) for Chitosan 5 (2497 3 0.86) 1 (3242 3 0.14) 5 2601.3 (MPa)1/2cm3mol21Solubility parameter 5 SF/V 5 2601.3/125.1 5 20.8 (MPa)1/2
5 10.2 (cal/cm3)1/2
Figure 7 Effect of dielectric constant of solvent on flux decrease at 1 h CT relative to 0.5 h CT.
and EtOAc, the trends with glutaraldehyde con-centration were opposite for 0.5 h CT.
MeOH fluxes were the highest and IPA fluxes were the least among the solvents studied. In the case of alcohols, the solvent flux decreased in the order: MeOH . EtOH . IPA. This may be attrib-uted to the combined effect of increase in hydro-phobicity, viscosity, and molecular weight of alco-hol, in that order.
In the case of hexane, no measurable solvent flux was observed, despite its lowest viscosity and a mo-lecular size comparable to EtOAc. This may be at-tributed to the lowest dielectric constant, maximum hydrophobicity, and higher difference in solubility parameter of hexane with membrane.
The membrane performance for permeation of nonaqueous solvents is governed by membrane– solvent polar and hydrophobic interactions as well as by viscosity of solvents.
The results with test solvents indicate that these NF membranes have a potential for solvent recovery or treatment of waste streams contain-ing traces of these solvents and other components of small molecular weights.
The authors would like to thank Dr. S. S. Kulkarni, Medal LP, USA, and M. M. Dal-Cin for helpful discus-sions; G. Pleizier for SEM analysis, and S. Croteau for help with the experimental setup for solvent permeation.
APPENDIX
Calculation of Solubility Parameter of Chitosan
The repeat unit of Chitosan with the degree of deacetylation ;0.86 would be:
MW of repeat unit of Chitosan 5 (161 3 0.86) 1 (203 3 0.14) 5 166.88 g/mol.
Density of Chitosan (determined on actual Chi-tosan film by buoyancy technique), d 5 1.3339 g cm23at 25°C,
Molar volume of Chitosan repeat unit, V 5 MW/d 5 166.88/1.3339 5 125.1 cm3 mol21.
REFERENCES
1. Breton, M.; Frillici, P.; Palmer, S.; Spears, C.; Ari-enti, M.; Kravett, M.; Shayer, A.; Suprenant, N. Treatment Technologies for Solvent Containing Wastes; Noyes Data Corp.: Park Ridge, USA, 1988. 2. Linder, C.; Perry, M.; Nemas, M.; Katraro, R. U.S.
5,039,421 (1991).
3. Strathmann, H. Desalination 1978, 26, 85. 4. Yuk, S. H.; Cho, S. H.; Lee, H. B. Eur Polym J 1998,
34, 499.
5. Nomura, H.; Seno, M.; Takahashi, H.; Yamabe, T. J Membr Sci 1979, 5, 189.
6. Farnand, B. A.; Talbot, F. D. F.; Matsuura, T.; Sourirajan, S. Sep Sci Technol 1984, 19, 33. 7. Bitter, J. G. A.; Haan, J. P.; Rijkens, H. C. AIChE
Symp Ser 1989, 272, 85, 98.
8. Koseoglu, S. S.; Rhee, K. C.; Lucas, E. W. J Am Oil Chem Soc 1990, 67, 315.
9. Michaels, S. L.; Antoniou, C.; Goel, V.; Keating, P.; Kuriyel, R.; Michaels, A. S.; Pearl, S. R.; Reyes, G.; Rudolph, E.; Siwak, M. In Separations Technology: Pharmaceutical and Biotechnology Applications; Olson, W. P., Ed.; Interpharm Press, Inc.: Illinois, 1995.
10. Raman, L. P.; Cheryan, M.; Rajagopalan, R. J Am Oil Chem Soc 1996, 73, 219.
11. Lin, L.; Rhee, K. C.; Koseoglu, S. S. J Membr Sci 1997, 134, 101.
12. Subramanian, R.; Nakajima, M.; Kawakatsu, T. J Food Eng 1998, 38, 41.
13. Brock, T. D. Membrane Filtration: A User’s Guide and Reference Manual; Science Tech., Inc.: Wiscon-sin, 1983.
14. Musale, D. A.; Kulkarni, S. S. J Macromol Sci Rev Macromol Chem Phys 1998; 38, 615.
15. Musale, D. A.; Kumar, A.; Pleizier, G. J Membr Sci 1999, 154, 165.
16. Musale, D. A.; Kumar, A. Sep Purif Technol (Com-municated).
17. Kumar, A.; Musale, D. A. U.S. Pat. 09/236,519, (Allowed, March 2000).
18. Nam, S. Y.; Lee, Y. M. J Membr Sci 1997, 135, 161. 19. Kulkarni, S. S.; Funk, W. E.; Li, N. N. In Mem-brane Handbook; Ho, W. S. W.; Sirkar, K. K. Eds.; Van Nostrand Reinhold: New York, 1992.
20. Brandrup, J.; Immergut, E. H., Eds.; Polymer Handbook; John Wiley & Sons: New York, 1989. 21. Ahmad, H.; Yaseen, M. Polym Sci Eng 1979, 19,
858.
22. Smallwood, I. Solvent Recovery Handbook;