HAL Id: tel-02956401
https://tel.archives-ouvertes.fr/tel-02956401
Submitted on 2 Oct 2020HAL is a multi-disciplinary open access archive for the deposit and dissemination of sci-entific research documents, whether they are pub-lished or not. The documents may come from teaching and research institutions in France or abroad, or from public or private research centers.
L’archive ouverte pluridisciplinaire HAL, est destinée au dépôt et à la diffusion de documents scientifiques de niveau recherche, publiés ou non, émanant des établissements d’enseignement et de recherche français ou étrangers, des laboratoires publics ou privés.
Multi-scales study for the external sulfatic attack in
reinforced concrete structures
Mike Jabbour
To cite this version:
Mike Jabbour. Multi-scales study for the external sulfatic attack in reinforced concrete structures. Civil Engineering. Université Paris-Est, 2019. English. �NNT : 2019PESC2084�. �tel-02956401�
ECOLE DOCTORALE: SCIENCES, INGENIERIE ET ENVIRONNEMENT Thèse présentée pour obtenir le grade de
Docteur de l'Université Paris-Est
Spécialité : Génie Civil Par
Mike JABBOUR
Étude multi-échelle de l'attaque sulfatique Externe
dans les matériaux cimentaires et structures en
béton armé
Soutenance prévue le 25 Octobre 2019 devant le jury composé de:
Prof. Karim Aït-Mokhtar Rapporteur, ULR
Prof. Ahmed Loukili Rapporteur, ECN
Prof. Yves Berthaud Examinateur, UPMC
Prof. Gilles Escadeillas Examinateur, UTlse Dr. Marc Quiertant Conseiller d'étude, IFSTTAR Dr. Othman Omikrine-Metalssi Conseiller d'étude, IFSTTAR Dr. Véronique Baroghel-Bouny Directrice de thèse, IFSTTAR
2
Abstract
External Sulfate Attack (ESA) of cementitious materials has been studied worldwide for very long time. This phenomenon affects the long term durability of concrete structures which can be considered as a major threat. The lack of sufficient field data as well as the lack between lab and field data in the case of exposure to sulfates makes the ESA one of the least understood phenomenon affecting concrete structures. In fact, there is a big difficulty in determining the exact parameters influencing the performance of cementitious materials against this type of attack. In addition, the macroscopic and microscopic alterations caused by ESA-induced expansion are not well understood due to the complexity of the overall damage mechanism.
In this context, the present thesis work aims to study several cementitious materials (cement paste, mortar, concrete and reinforced concrete) exposed to different types of accelerated ESA in the objective of providing an experimental-based analysis of the mechanisms occurring at each material scale.
In the first part, two new testing methods were implemented and introduced where the penetration depths of free sulfate ions was measured on cement paste cylinders by drying method. Also, the changes in length caused by ESA-induced expansion were monitored on cement paste prisms by an optical-fiber based method. The results of the drying method showed that the penetration depths are highly comparable to the ones obtained by ICP-AES. On the other hand, the expansions measured by extensometer and extensometers and OF were very similar. These results confirmed that both new techniques are eligible to be used as alternatives to replace the traditional methods such as ICP-AES and extensometer. A physico-chemical model was proposed to qualitatively explain the visual damage suffered by cylinders exposed to semi-immersion and characterized by the formation of circumferential cracks.
In the second part, six mortar mixes were tested including three types of cement (CEM I, CEM III and CEM I + 30% fly ash called CEM II-V) and two w/c ratios (w/c =0.45 and w/c = 0.6). The results showed that the type of exposure does not influence the kinetics of ESA compared to the type of cement and w/c ratio that highly affected the performance of mortar samples during accelerated ESA. The visual inspections, changes in length, mass variations, compressive and tensile strengths variations and changes in the water accessible porosity all confirmed that CEM I samples made with w/c = 0.6 are not considered sulfate resistant. The evolution of ESA-induced expansion for CEM I mortar samples followed a three-stage process whereas the mass variations for the same mixes had a two -stage behavior. The good performance of CEM III and CEM II-V samples was attributed to the presence of mineral admixtures at specified proportions (64% slag and 30% fly ash respectively). By analyzing the variation of pore size distribution at the surface level of samples exposed to the different conditions, the formed crystals were found to be precipitated in capillary and gel pores.
3
Based on this, it was suggested that ettringite forms in larger voids before penetrating into smaller capillary and gel pores leading to expansion, hence deterioration of the material.
In the third part, the resistance of different concrete mixes was evaluated as requested by Perfdub national project. Two different shapes of concrete samples (prism or cylinder) were considered to investigate the role of this parameter. Evolution of the damage mechanism during ESA was assessed by periodically measuring main characteristics of the samples (mass, compressive strength, water accessible porosity and chloride diffusion coefficient) and by monitoring the axial and longitudinal ESA-induced expansions. The exposure conditions (renewal frequency of the solution, Vsolution/Vsample and pH of the solution) were found to play a main role in the damage
process. Also, the study highlighted that the shape of the sample considered in this research does not interfere in the kinetics of the ESA. The concrete samples mixed with CEM III with high level of slag replacement (60wt.-%) and CEM II-V (30% fly ash) considered as sulfate resistant, revealed good performance which was not the case for CEM I based samples.
The performance of structures during ESA was evaluated for the first time by studying the effects of the attack on the bond behavior between concrete and reinforcing steel bar. The bond strength decreased after several months of exposure to accelerated ESA which directly affected the overall strength of the RC structure. In addition, this part highlighted the presence of a mechanical role played by the reinforcing bar in decreasing the changes in length, hence the evolution of ESA-induced expansion.
Keywords: External Sulfate Attack (ESA), durability of concrete, cementitious materials,
accelerated ESA, drying method, ESA-induced expansion, pore size distribution, bond behavior.
4
Résumé
Bien qu’offrant de nombreux avantages, l’utilisation du béton en construction entraine plusieurs risques liés à la durabilité de l’ouvrage. En effet, les détériorations des structures en béton armé (BA) en présence d’agents agressifs minéraux, chimiques ou physiques peuvent être nombreuses et variées. Parmi celles induites par des réactions chimiques, l'Attaque Sulfatique Externe (ASE) se présente comme étant l’une des pathologies les plus complexes et reste insuffisamment maîtrisée. Cette réaction causée par un agent externe (le sulfate) peut conduire à des altérations importantes, à une chute des propriétés mécaniques et finalement à la destruction complète de l’ouvrage. Les dégradations liées à l'ASE résultent du phénomène d’expansion créé par l’attaque de la portlandite, les monosulfoaluminate et l’aluminate tricalcique (C3A) résiduel par les
ions de sulfates. Celle-ci provoque la formation de cristaux d’ettringite et/ou du gypse. Le projet de thèse intitulé « Étude multi-échelles de l’attaque sulfatique externe dans les structures en béton armé » vise à établir une meilleure compréhension, à l’échelle de différents matériaux cimentaires (pâte de ciment, mortier, béton et béton armé), des mécanismes physico-chimiques et des modifications macroscopiques et microscopiques liés à l'ASE.
A l’échelle de la pâte de ciment, le front de pénétration des ions sulfates libres a été suivi sur des cylindres par une nouvelle méthode de séchage. De plus, des déformations ont été suivies sur des prismes en appliquant une technique innovante de mesure par fibre optique (FO). Les fronts de pénétration observés par séchage ont été comparables à ceux obtenus par ICP-AES et les mesures d’expansion par FO ont montré des valeurs similaires à celles obtenues par extensomètre. Ces résultats ont permis de confirmer que les deux nouvelles techniques d'investigation peuvent être considérées comme étant des alternatives aux méthodes traditionnelles généralement utilisées dans la littérature. Finalement, dans cette partie, un modèle simplifié a été proposé pour prédire qualitativement le comportement macroscopique des cylindres en décrivant d'une manière qualitative le type d'endommagement caractérisé par la formation de fissures circonférentielles surtout dans la partie saturée de l'échantillon.
A partir des suivis menés sur les éprouvettes en mortier, il était évident que les ciments composés et surtout ceux contenant des laitiers et fumées de silice résistent mieux à l'ASE. D'autre part, la progression de l'attaque a été plus rapide dans les mortiers de type CEM I contenant un rapport E/C élevé (0.6). L'analyse par MIP a permis de suivre l'évolution de la microstructure des mortiers exposés aux attaques. La variation des distributions de la taille des pores a confirmé les conclusions précédentes en montrant que les plus grandes modifications ont eu lieu dans la microstructure des mortiers contenant du CEM I et un E/C= 0.6. L'étude a montré que l'ettringite est le produit expansif qui génère les altérations microstructurales en se formant, en premier lieu, dans les plus grands pores avant de précipiter dans les pores capillaires et les pores des C-S-H.
5
La présence de l'ettringite à la surface d'un échantillon de mortier endommagé par l'ASE a été qualitativement confirmée par observation MEB.
Le travail expérimental présenté dans la troisième partie s'intéresse à la mise au point d'un essai reproductible pour l'étude de l'ASE dans des conditions contrôlées. De plus, cette partie a permis d'étudier l'effet de la géométrie (prisme ou cylindre) de l'éprouvette et l'influence de modifier les conditions d'accélération de l'attaque (fréquence de renouvellement de la solution d'attaque, Vsolution/Véprouvette et effet du pH)
sur les cinétiques de la progression de l'ASE. Les suivis d'expansion axiale et longitudinale, masse, résistance en compression, porosité accessible à l'eau et le coefficient de diffusion des chlorures ont montré que les bétons CEM I résistent moins que les bétons CEM III et CEM II/B (CEM I + 30% CV) face à l'ASE. De plus, l'étude a mis en évidence que l'évolution de la détérioration induite par l'expansion n'est pas significativement influencée par la géométrie de l'éprouvette.
Cette thèse vise à améliorer la compréhension du comportement de l'ouvrage soumis à l’ASE en explorant, pour la première fois, les effets de l'ASE à l'échelle d’éléments structuraux. Les essais d'arrachement ont permis d'évaluer la dégradation de l'interface acier/béton et d'établir un lien direct entre l'ASE et la capacité d'adhérence entre l'armature et le béton. De plus, les suivis des expansions ont montré que l'armature peut jouer un rôle mécanique de limitation du gonflement.
Mots-clés : Attaque sulfatique externe (ASE), durabilité, matériaux cimentaires, méthode de séchage, expansion, distribution des tailles de pores, interface acier/béton.
6
Contents
Abstract ... 2 Résumé ... 4 Contents ... 6 Glossary ... 12 List of figures ... 14 List of tables ... 25 Introduction ... 26Chapter 1: Literature review... 31
1. Literature review ... 32
1.1. Introduction ... 32
1.2. Cement chemistry ... 32
1.2.1. Reaction products of Elite and alite ... 33
1.2.2. AFm and AFt phases ... 35
1.3. External sulfate attack ... 35
1.3.1. Physical and chemical sulfate attack mechanisms ... 37
1.3.2. Ettringite and gypsum formation ... 38
1.3.3. Different theories about the origins of expansion ... 43
1.3.3.1. Increase in solid volume ... 43
1.3.3.2. Topochemical reaction ... 43
1.3.3.3. Swelling of Aft colloidal particles ... 44
1.3.3.4. Crystal growth pressure ... 46
1.3.4. Type of exposure and transport processes ... 48
1.3.4.1. Fully saturated ... 48
1.3.4.2. Partially saturated and wet/dry cycles ... 49
1.3.5. Factors affecting ESA ... 50
1.3.5.1. Impact of mix design ... 50
7
1.3.5.1.2. Water to cement ratio (w/c) ... 52
1.3.5.2. Impact of exposure conditions ... 58
1.3.5.2.1. Type of cation ... 58
1.3.5.2.2. pH of the solution ... 60
1.3.5.2.3. Sulfate concentration and solution renewal ... 63
1.3.5.3. Size and geometry effects ... 65
1.3.5.4. Effect of curing time ... 67
1.3.6. Existing testing methods ... 69
1.4. Bond mechanism in reinforced concrete ... 76
1.4.1. Bond behavior ... 76
1.4.2. Concrete related factors influencing the bond strength... 78
1.4.2.1. Bond of deformed rebars ... 78
1.4.2.2. Concrete cover and bar spacing ... 78
1.4.2.3. Effect of mechanical properties of concrete (compressive strength and tensile strength) ... 79
1.4.3. Pull-out tests to characterize bond strength between steel and concrete ... 80
1.5. Conclusion ... 85
Chapter 2: Experimental work ... 88
2. Experimental work... 89
2.1. Introduction ... 89
2.2. Exposure conditions ... 92
2.3. Experimental work performed on cement paste samples ... 94
2.3.1. Materials ... 94
2.3.2. Exposure condition ... 97
2.3.3. Testing method ... 98
2.3.4. Optical-fiber based method for measurement of ESA-induced expansion ... 99
2.4. Experimental work performed on mortar samples ...100
2.4.1. Sample design ...100
8 2.4.3. Exposure conditions ...107 2.4.3.1. Full immersion ...107 2.4.3.2. Semi-immersion ...110 2.4.3.3. Drying/wetting cycles ...111 2.4.3.4. References ...114 2.4.4. Physical changes ...114
2.4.4.1. Length change (expansion) ...114
2.4.4.2. Mass measurement ...116
2.4.4.3. Mechanical properties ...117
2.4.5. Microstructural analysis ...118
2.4.5.1. Water accessible porosity test ...118
2.4.5.2. Mercury Intrusion Porosimetry ...119
2.4.5.3. Scanning Electron Microscopy ...120
2.5. Experimental work on reinforced concrete specimens ...122
2.5.1. Materials ...122
2.5.2. Cement ...122
2.5.3. Fine aggregate and coarse aggregate ...122
2.5.4. Steel reinforcement ...123
2.5.5. Mixes design and casting procedure ...123
2.5.6. Specimen design for pull-out test...125
2.5.7. Pull-out test ...126
2.5.8. Specimen for expansion monitoring ...129
2.5.9. Concrete sample for the monitoring of ESA induced compressive strength evolution ...131
Chapter 3: Experimental results and analyses ...132
3. Experimental results and analyses ...133
3.1. Cement paste samples ...134
3.1.1. Visual inspections ...134
9
3.1.3. Sulfate profiles ...138
3.1.4. ESA-induced expansion measurement using optical-fibers ...143
3.1.5. Summary and conclusions related to the study on ESA-induced behavior of cement paste ...146
3.2. Mortar samples ...147
3.2.1. Visual inspections ...147
3.2.1.1. CEM I samples ...147
3.2.1.2. Effect of w/c ratio ...151
3.2.1.3. Effect of exposure condition ...153
3.2.1.4. CEM III and CEM II/B samples ...153
3.2.1.5. Effect of type of cement ...155
3.2.1.6. Subconclusions ...156
3.2.2. Length changes ...157
3.2.2.1. Effect of w/c ratio ...157
3.2.2.2. Three-stages behavior ...158
3.2.2.3. Effect of cement type ...161
3.2.2.4. Subconclusions ...164
3.2.3. Mass variation ...165
3.2.3.1. Effect of w/c ratio ...165
3.2.3.2. Effect of type of cement ...170
3.2.3.3. Subconclusions ...173
3.2.4. Compressive strength ...174
3.2.4.1. Subconclusions ...180
3.2.5. Tensile strength (measured by 3 points bending test) ...181
3.2.6. Porosity ...185
3.2.6.1. Subconclusions ...188
3.2.7. Pore size distribution ...190
3.2.7.1. CEM I samples ...191
10
3.2.7.1.2. Semi-immersion and drying/wetting cycles ...196
3.2.7.2. Pore volumes measured by MIP and Water Accessible Porosity Test (WAPT) .201 3.2.7.3. Pore size distribution of CEM III and CEM II/B samples ...203
3.2.7.4. Subconclusions ...208
3.2.8. SEM Analysis ...209
3.2.9. Coupling between expansion and macroscopic behavior ...210
3.2.10. Coupling between expansion and WAPT ...211
3.2.11. Coupling between expansion and compressive strength ...212
3.2.12. Conclusions ...213
3.3. Reinforced concrete structures ...217
3.3.1. Expansion results ...217
3.3.2. Characterization of the bond-slip behavior by pull-out test ...222
Chapter 4: Effect of cement type, sample shape and exposure conditions on the extent of ESA development ...226
4. Effect of cement type, sample shape and exposure conditions on the extent of ESA development ...227
4.1. Introduction ...227
4.2. Experimental program ...228
4.2.1. Materials and mix proportions ...228
4.2.2. Samples geometries ...230
4.2.3. Acceleration method ...230
4.2.4. Expansion measurements ...231
4.2.5. Mass variation measurement ...234
4.2.6. Residual compressive strength measurement ...234
4.2.7. Water accessible porosity test ...235
4.2.8. Chloride migration test ...235
4.3. Experimental results ...236
4.3.1. Expansion of concrete samples ...236
4.3.1.1. Axial length change of C1-C4 concrete samples: Study of the effect of sample shape ...236
11
4.3.1.2. Longitudinal length change of C1-C4 concrete samples: Study of the effect of
sample shape ...239
4.3.1.3. Comparison of axial vs. longitudinal length change for the assessment of ESA-induced expansion ...242
4.3.1.4. ESA-induced length change of all concrete mixes: Study of the effect of the mix ...243
4.3.2. Mass variation ...244
4.3.3. Compressive strength ...247
4.3.4. Water Accessible Porosity (WAP) ...250
4.3.5. Diffusion coefficient of chloride ions ...252
4.4. Discussion of the results ...253
4.4.1. Effect of cement type and C3A content and w/c ratio ...253
4.4.2. Effect of the shape ...255
4.4.3. Effect of mineral additions ...256
4.4.4. Effect of solution renewal and Vsolution/Vsample ratio ...257
4.4.5. Effect of pH ...258 4.5. Conclusion ...260 Conclusion ...262 Perspectives ...267 References ...269 Appendices ...283
Appendix A. Materials Technical sheets ...284
Appendix B. Sulfate profiles ...286
Appendix C. Visual inspections on mortar samples equipped with pins ...288
Appendix D. Visual inspections on mortar samples after 6 months of accelerated ESA 290 Appendix E. Expansion results for RC specimens ...292
12
Glossary
C CaO A Al2O3 S SiO2 H H2O F Fe2O3 M MgO K K2O S SO3C3A 3CaO. Al2O3 Tricalcium aluminate
C2S 2CaO. SiO2 Dicalcium silicate
C3S 3CaO. SiO2 Tricalcium silicate
C4AF 4CaO. Al2O3. Fe2O3 Tetracalcium aluminoferrite
(Ferrite)
C-S-H CaO. SiO2. H2O Calcium silicate hydrate
CH Ca(OH)2 Calcium hydroxide
(Portlandite)
AFm (C3A.C𝑆.H12=Ca4(SO4)(OH)12.
5(H2O)) Monosulfate aluminate
AFt (C3A.3C𝑆.H32=Ca6Al2(SO4)3(OH)12.
26(H2O))
Alumino ferrite trisubstituted-ettringite
FA Fly Ash
Na2SO4 Sodium sulfate (Thenardite)
Na2SO4.
10H2O Mirabilite
NaCl Halite
Mg(OH)2 Brucite
13
PC Portland Cement
SCM Supplementary Cementitious Material
SRPC Sulfate Resisting Portland Cement
SF Silica Fume
w/c ratio Mass ratio of water to cement
Clinker Partially fused nodular product from cement manufacturing
Friedel's salt C3A(CaCl2)H10 Hydrocalumite
Gypsum (C𝑆H2 = CaSO4.2H2O) Calcium sulfate hydrate
Na2SO4 Sodium sulfate (Thenardite)
Limestone CaCO3 Calcium carbonate
Mineral
admixture Ground mineral added to cement
Pozzolan Natural or industrial siliceous and/or aluminous material
Slag Glassy granular material from quenching of blast-furnace slag Investigation
techniques
MIP Mercury Intrusion Porosimetry ICP-AES Inductively Coupled Plasma
WAPT Water Accessible Porosity Test SEM Scanning Electron Microscopy
14
List of figures
Figure 1.1: Schematic representation of the structure of C-S-H [11] ... 34
Figure 1.2: (a) Structure of portlandite; (b) SEM image of portlandite crystals (hexagonal structure) [11] ... 34
Figure 1.3: Chemical mechanism during ESA [42] ... 38
Figure 1.5: Six steps of the accelerated sodium sulfate attack process at constant pH of 7 [58] ... 42
Figure 1.6: The mechanism of the topochemical reaction: first ettringite forms on the surface of the particle, second the crystals start to grow and finally when they extend beyond the surrounding solution, expansion stars [61] ... 44
Figure 1.7: Variation of the water gain with the volumetric expansion [34] ... 45
Figure 1.8: Volume increase of cement paste with ettringite content (obtained by X-ray diffraction) considering exposure to sodium sulfate or calcium sulfate [63] ... 45
Figure 1.9: The cylindrical pore where the crystal (ettringite) grows [65] ... 46
Figure 1.10: Precipitation of ettringite during ESA through large to small pores [73] ... 47
Figure 1.11: Affected depth by ESA and leaching [77] ... 49
Figure 1.12: Length changes of mortar samples exposed to Na2SO4 solution at20°C (series B) and prepared with (a) cement 7 and (b) cement 14 [97] ... 51
Figure 1.13: Influence of w/c on the performance of cement paste exposed to sodium sulfate attack [100] ... 52
Figure 1.14: Relationship between the compressive strength and drying/wetting cycles obtained using SVM model for the three mortar mixes M65, M50 and M28 [103] ... 53
Figure 1.15: Sulfate profiles measured using ICP-AES, after 1 year of exposure to the sulfate solution [2] ... 54
Figure 1.16: Degradation of cement paste with w/c = 0.6 by ESA: (a) after 2 months and (b-c) after 3 months of exposure to sulfate solution [2]... 55
Figure 1.17: Degradation of cement paste with w/c = 0.45 by ESA: (a) after 2 months, (b) after 6 months and (c-d) after 8 months of exposure to sulfate solution [2] ... 56
Figure 1.18: Expansion behavior of several types of cement during ESA [70] ... 57
Figure 1.19: Length changes of CEM I mortar bars exposed to different sulfate solutions [71] ... 59
Figure 1.20: Visual appearance after 1 year of exposure of CEM I mortar bars exposed to (A) high MgSO4, (B) low MgSO4 and (C) mixture solution [71] ... 59
Figure 1.21: Length changes of CEM III/B mortar bars exposed to different sulfate solutions [71] . 60 Figure 1.22: Visual appearance after 1 year of exposure of CEM III/B mortar bars exposed to (A) high MgSO4, (B) low MgSO4 and (C) mixture solution [71]... 60
15
Figure 1.23: The effect of controlled pH on the resistance of cement paste against ESA [108] ... 61 Figure 1.24: Profiles for gypsum, ettringite, portlandite and calcite concentrations obtained from DRX observations [41]... 62 Figure 1.25: Effect of the sulfate concentration in the attack solution (sodium sulfate solution) considering a) penetration of sulfate and b) sample expansion [3] ... 63 Figure 1.26: Equilibrium of the hydrated cement phases in the SO4-Ca-Al system at 25°C [113] ... 64 Figure 1.27: Depths reached by portlandite, ettringite and gypsum after an accelerated ESA
performed at pH = 7 and with solution renewal [114] ... 65 Figure 1.28: ESA-induced expansion of mortar samples with different geometry [115]... 65 Figure 1.29: Absolute radius expansion vs. longitudinal expansion of the different mortar samples. Hollow geometries (C30, C40 and C50); prisms (PRI) and cylinders (CYL) [116] ... 66 Figure 1.30: ESA-induced deformation of mortar samples immersed after different curing durations [118] ... 67 Figure 1.31: Comparison of the sulfate profiles after two months of immersion of a CEM I (OCP) submitted to early age exposure or exposed after one year of curing [20] ... 68 Figure 1.32: Comparison of observed damage of OCP samples after two months of sulfate exposure: (a) immersion in attack solution at early age exposure and (b) immersion when sample is mature [20] ... 68 Figure 1.33: The large dispersion of the ESA-induced expansion results between the different participating laboratories , after [119] ... 70 Figure 1.34: Expansion of the mortar prisms with different w/c exposed to ESA under wet/dry cycles [128] ... 73 Figure 1.35: Accelerated test in [129]: (a) the squared mold used during the combined sulfate attack; (b) schematic representation of the combined attack and (c) top view of the squared mold ... 74 Figure 1.36: a) Chemical adhesion between steel and surrounding concrete, b) Bond stress – slip [A-B] [135] ... 76 Figure 1.37: a) Slipping of reinforcement steel, b) Bond stress – slip in the case of friction [B=D] [135] ... 77 Figure 1.38: a) Degradation mechanism and cracks formation, b) Bond stress – slip [B-C] [135] .... 77 Figure 1.39: Different types of tests used to measure the bond strength between steel and concrete [161] ... 80 Figure 1.40: Example of concrete splitting failure [162] ... 81 Figure 1.41: The RILEM-CEB RC6 pull-out test set up [163, 165] ... 81 Figure 1.42: Geometry of the RC cubic specimen recommended for the RILEM-CEB RC6 pull-out test [163, 165] ... 82
16
Figure 1.43: Different pull-out test set ups: Rehm [166]; RILEM-CEB [163]; Losberg [168]; Rehm
and Eligehausen [169]; Eligehausen and Bertero [146]; Tassios [170] ... 82
Figure 1.44: Effect of corrosion on bond stress (MPa)-displacement behavior [171] ... 83
Figure 2.1: The two stages process of expansion during external sodium sulfate attack [58] ... 91
Figure 2.2: ESA-induced deformation of concrete samples recorded for 3 different sulfate concentration while maintaining a constant pH (pH= 7) [115] ... 93
Figure 2.3: The cylindrical samples obtained after casting [20]... 95
Figure 2.4: The rotation device used to treat the cylinders and avoid bleeding [20] ... 96
Figure 2.5: The identical two slices obtained after cutting [20] ... 96
Figure 2.6: The slices coated and protected by epoxy resin while being placed in contact with the sulfate solution ... 97
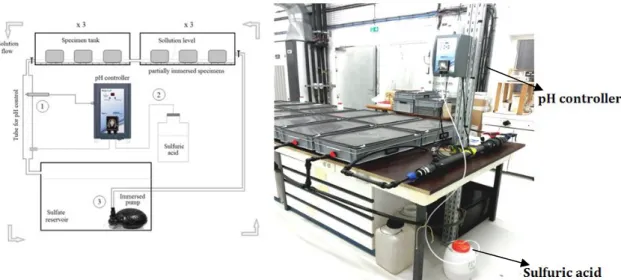
Figure 2.7: Schematic representation of the setting used for the attack (left) and a photo of the pH-control device developed and used for this study (right) ... 97
Figure 2.8: The two stages of preparation of the cement paste sample and the measurement of the penetration depth: a) Sample removed from bath, b) Sample cut in half before placing it in a climatic chamber at 50% RH and T = 20°C, c) White precipitation measured with a stainless steel ruler ... 98
Figure 2.9: Metallic moulds equipped with optical fibers and used to cast the testing samples ... 99
Figure 2.10: Geometry of the cement paste sample equipped with an optical fiber ... 99
Figure 2.11: Grain size distribution of Palvadeau sand 0/4 given by the manufacturer ... 101
Figure 2.12: Surface texture of some mortar samples affected by the type of formwork ... 103
Figure 2.13: Moist cure of mortar prisms by immersion in large tanks filled with tap water ... 103
Figure 2.14: The three exposure set-ups considered to accelerate ESA ... 104
Figure 2.15: The space specifically prepared at Ifsttar to carry out the accelerated tests (full immersion, semi- immersion and drying/wetting cycles) ... 104
Figure 2.16: The setting prepared for drying/wetting cycles ... 106
Figure 2.17: pH variation during 52 weeks of exposure to ESA ... 107
Figure 2.18: Half of the mortar sample (2 x 2 x 16 cm3) considered for 2D calculations by the FE Method ... 108
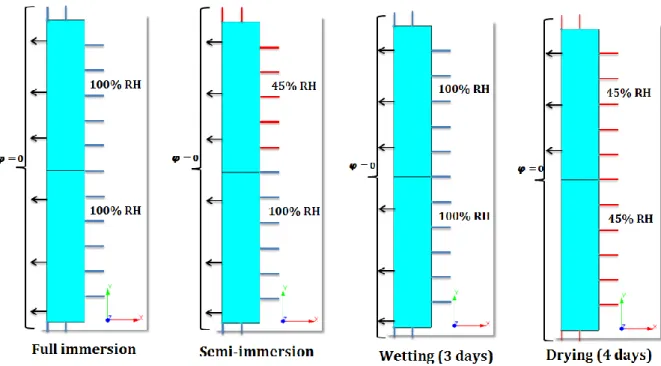
Figure 2.19: Flux boundary conditions considered for the FE analysis of all exposure conditions.. 109
Figure 2.20: Degree of saturation profile of mortar samples: a) initial state and b) after being exposed to full immersion. The blue color refers to the highest degree of saturation of 1 ... 110
Figure 2.21: Variations in the degree of saturation profiles of mortar samples after 5 days of exposure to semi-immersion in the 15 g/L Na2So4 solution. The red color refers to a high degree of saturation whereas the blue color refers to a low degree of saturation ... 111
17
Figure 2.22: The four locations A, B, C and D used to obtain the changes in the relative humidity
during drying/wetting cycles ... 112
Figure 2.23: Changes in relative humidity as a function of exposure time obtained at point A, B, C and D after one month of drying/wetting cycles ... 113
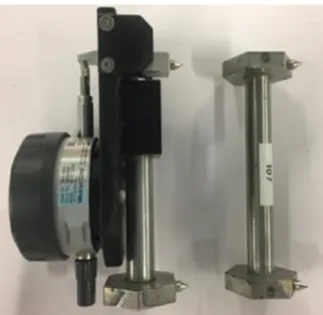
Figure 2.24: The extensometer and calibration section used to measure the variation in length ... 115
Figure 2.25: The mortar prism with a pair of pins fixed on one of the sides ... 115
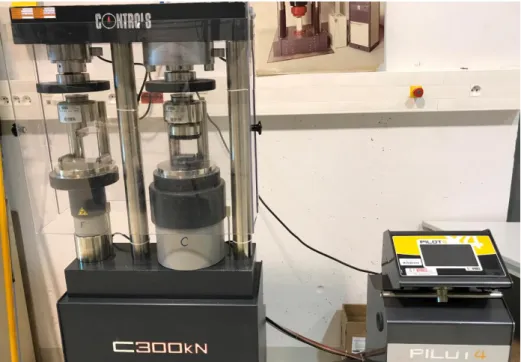
Figure 2.26: The device used to determine the resistance to compression and flexion for mortar prisms ... 117
Figure 2.27: Water accessible porosity test ... 118
Figure 2.28: Micromeritics Auto-Pore II Porosimeter used to perform MIP at Ifsttar ... 120
Figure 2.29: Scanning Electron Microscopy (SEM Quanta 400) device ... 121
Figure 2.30: The formwork used to prepare the 18 × 12.5 × 10 cm3 RC prisms (specimen for expansion measurement) ... 124
Figure 2.31: The formwork used to prepare the 6 × 12.5 × 10 cm3 RC prisms (specimens for pull-out tests) ... 124
Figure 2.32: The cardboards moulds used to cast the concrete cylinders ... 125
Figure 2.33: Geometry of the pull-out test specimens ... 125
Figure 2.34: Detail of a wood formwork for pull-out specimen with the rebar extending by about 40 mm for measuring the slip of the rebar ... 126
Figure 2.35: The pull-out specimen wood formwork with the rebar extending by about 100 cm for gripping the specimen in the testing machine ... 126
Figure 2.36: Illustration of the set-up developed at Ifsttar used to perform the pull-out test ... 127
Figure 2.37: Photograph of the set-up developed at Ifsttar used to perform the pull-out test ... 128
Figure 2.38: LVDT attached to the free end of the rebar for slippage of rebar measurement... 128
Figure 2.39: Geometry of the specimens used for expansion monitoring for both concrete mixes .. 129
Figure 2.40: The position of the three faces with respect to the steel reinforcement ... 129
Figure 2.41: Instrumentation of face 1 (F1) (left) and generating lines F1-a, F1-b and F1-c used to monitor expansion (right) ... 130
Figure 2.42: Instrumentation of face 2 (F2) (left) and the generating lines F2-a, F2-b, F2-c and F2-d used to monitor expansion (right) ... 130
Figure 2.43: Instrumentation of face 3(F3) (left) and generating lines F3-a and F3-b used to monitor expansion (right) ... 130
Figure 3.1: Degradation of cement paste with w/c = 0.6 due to ESA: a) after 3 months, b) after 5 months, c) after 6 months, d) front view (after 6months) , e) side view (after 6months) ... 135
18
Figure 3.2: (a) Deformation predicted by the model, (b) and (c) visual appearances of the cement
paste cylindrical samples after 3 months of exposure to ESA ... 137
Figure 3.3: ISO-values of the displacement after 3 months of exposure to ESA ... 137
Figure 3.4: a) White precipitation obtained by drying method after 15 days of exposure to ESA, b) Zoom on the penetration depth observed after 15 days (photo treated by increasing contrasts) .. 140
Figure 3.5: a) White precipitation obtained by drying method after 45 days of exposure to ESA, b) Zoom on the penetration depth observed after 45 days (photo treated by increasing contrasts) .. 140
Figure 3.6: a) White precipitation obtained by drying method after 4 months of exposure to ESA, b) Zoom on the penetration depth observed after 4 months (photo treated by increasing contrasts)141 Figure 3.7: Sulfate profiles measured by ICP-AES, for different exposure duration to ESA [20]... 142
Figure 3.8: Penetration depth of sulfate ions measured by ICP-AES and drying method after 6 months of semi-immersion in the Na2SO4 solution ... 143
Figure 3.9: Evolution of ESA-induced expansion measured by extensometer ... 144
Figure 3.10: Mass variation of the prisms exposed to ESA ... 144
Figure 3.11: Evolution of ESA-induced expansion measured by OF ... 145
Figure 3.12: Comparison of ESA-induced expansion measured by OF or by extensometer ... 145
Figure 3.13: Visual appearance of M I-0.45 prisms after 12 months of exposure: a) full immersion, b) semi-immersion, c) drying/wetting cycles ... 148
Figure 3.14: Visual appearance of M I-0.6 prisms after 12 months of full immersion a) top view of prisms, b) front view of prisms ... 148
Figure 3.15: Visual appearance of M I-0.6prisms after 12 months of semi-immersion a) prisms after removing the crystals growing on the surface, b) front view of drying portions, c) front view of immersed portions ... 150
Figure 3.16: Visual appearance of M I-0.6 samples after 12 months of drying/wetting cycles, a) top view of samples b) front view of samples ... 150
Figure 3.17: Visual appearance of M I-0.6 and M I-0.45 prisms after 12 months of full immersion in the Na2SO4 solution ... 152
Figure 3.18: Visual appearance of M I-0.6 and M I-0.45 prisms after 12 months of semi-immersion in the Na2SO4 solution ... 152
Figure 3.19: Visual appearance of M I-0.6 and M I-0.45 prisms after 12 months of drying/wetting cycles in the Na2SO4 ... 152
Figure 3.20: Macroscopic degradation suffered by M I-0.6 prisms during the three exposure conditions ... 153
Figure 3.21: Visual appearance of M III-0.45 prisms after 12 months of full immersion and 12 months of semi-immersion ... 154
19
Figure 3.22: Visual appearance of M III-0.6 prisms after 12 months of full immersion and 12 months of semi-immersion ... 154 Figure 3.23: Visual appearance of M II/B-0.45 prisms after 12 months of full immersion and 12 months of semi-immersion ... 154 Figure 3.24: Visual appearance of M II/B-0.6 prisms after 12 months of full immersion and 12 months of semi-immersion ... 155 Figure 3.25: Visual appearance of mortar prisms mixed with the same w/c = 0.6 and three different types of cement (CEM I, CEM III and CEM II/B) ... 156 Figure 3.26: Stainless steel pins glued on faces 1 and 2 of the mortar prism ... 157 Figure 3.27: Expansion of M I-0.45 and M I-0.6 mortar samples due to ESA ... 158 Figure 3.28: Evolution of expansion of M I-0.45 and M I-0.6 mortar samples following the three-stage process ... 159 Figure 3.29: Evolution of expansion of M III-0.45 and M III-0.6 mortar samples following a two-stage process ... 160 Figure 3.30: Evolution of expansion of CEM II/B -0.45 and M II/B-0.6 mortar samples following a two-stage process ... 160 Figure 3.31: Expansion of CEM I, CEM III and CEM II/B mortar samples mixed with w/c = 0.6 and fully immersed in the Na2SO4 solution ... 161
Figure 3.32: Expansion of CEM I, CEM III and CEM II/B mortar samples mixed with w/c = 0.6 and partially immersed in the Na2SO4 solution ... 162
Figure 3.33: Expansion of CEM I, CEM III and CEM II/B mortar samples mixed with w/c = 0.45 and fully immersed in the Na2SO4 solution ... 163
Figure 3.34: Expansion of CEM I, CEM III and CEM II/B mortar samples mixed with w/c = 0.45 and partially immersed in the Na2SO4 solution ... 163
Figure 3.35: Two-stage process identified by Santhanam et al in the case of sodium sulfate attack [58] ... 165 Figure 3.36: Mass variation of M I-0.45 and M I-0.6 mortar samples ... 167 Figure 3.37: Relationship between expansion and mass variation for M I-0.6 mortar samples
exposed to three dfferent exposure conditions ... 168 Figure 3.38: Zoom on stage 1 ... 168 Figure 3.39: Mass variation of M III-0.45 and M III-0.6 mortar samples exposed to full immersion and semi-immersion ... 169 Figure 3.40: Mass variation of M II/B-0.45 and M II/B -0.6 mortar samples exposed to full
immersion and semi-immersion ... 169 Figure 3.41: Mass variation of CEM I, CEM III and M II/B mortar samples mixed with w/c = 0.45 and fully immersed in the Na2SO4 solution ... 171
20
Figure 3.42: Mass variation of CEM I, CEM III and CEM II/B mortar samples mixed with w/c = 0.6 and fully immersed in the Na2SO4 solution ... 171
Figure 3.43: Mass variation of CEM I, CEM III and CEM II/B mortar samples mixed with w/c = 0.45 and partially immersed in the Na2SO4 solution ... 172
Figure 3.44: Mass variation of CEM I, CEM III and CEM II/B mortar samples mixed with w/c = 0.6 and partially immersed in the Na2SO4 solution ... 172
Figure 3.45: Compressive strength of M I-0.45 mortar samples exposed to ESA and stored in water ... 176 Figure 3.46: Compressive strength of M I-0.6 mortar samples exposed to ESA and stored in water ... 176 Figure 3.47: Compressive strength of M III-0.45 mortar samples exposed to ESA and stored in water ... 177 Figure 3.48: Compressive strength of M III-0.6 mortar samples exposed to ESA and stored in water ... 177 Figure 3.49: Compressive strength of M II/B-0.45 mortar samples exposed to ESA and stored in water ... 178 Figure 3.50: Compressive strength of M II/B-0.6 mortar samples exposed to ESA and stored in water ... 178 Figure 3.51: Compressive strength of CEM I, CEM III and CEM II/B mortar samples mixed with w/c = 0.6 and fully immersed in the Na2SO4 solution ... 179
Figure 3.52: Compressive strength of CEM I, CEM III and CEM II/B mortar samples mixed with w/c = 0.6 partially immersed in the Na2SO4 solution ... 180 Figure 3.53: Tensile strength of M I-0.45 mortar samples exposed to ESA and stored in water ... 181 Figure 3.54: Tensile strength of M I-0.6 mortar samples exposed to ESA and stored in water ... 182 Figure 3.55: Tensile strength of M III-0.45 mortar samples exposed to ESA and stored in water ... 183 Figure 3.56: Tensile strength of M III-0.6 mortar samples exposed to ESA and stored in water ... 183 Figure 3.57: Tensile strength of M II/B-0.45 mortar samples exposed to ESA and stored in water 184 Figure 3.58: Tensile strength of M II/B-0.6 mortar samples exposed to ESA and stored in water .. 184 Figure 3.59: Tensile strength of M I-0.6, M III-0.6 and M II/B -0.6 mortar samples exposed to ESA under full immersion ... 185 Figure 3.60: Total porosity of M I-0.45 and M I-0.6 mortar samples due to ESA under three exposure conditions ... 186 Figure 3.61: Total porosity of M III-0.45 and M III-0.6 mortar samples due to ESA under two
exposure conditions ... 187 Figure 3.62: Total porosity of M II/B-0.45 and M II/B-0.6 mortar samples due to ESA under two exposure conditions ... 188
21
Figure 3.63: Total porosity of CEM I, CEM III and CEM II/B mortar samples mixed with w/c = 0.6 and fully immersed in the Na2SO4 solution ... 189
Figure 3.64: Relationship between porosity and compressive strength for M I-0.6 mortar samples exposed to ESA (full immersion, semi-immersion and drying/wetting cycles) ... 190 Figure 3.65: Pore classification in hydrated cement paste [224] ... 191 Figure 3.66: Pore size distribution of M I-0.6 mortar samples exposed to ESA (full immersion) ... 192 Figure 3.67: Variation of the pore volume of M I-0.6 mortar samples exposed to ESA (full
immersion) in different pore ranges ... 193 Figure 3.68: Pore size distribution of M I-0.45 mortar samples exposed to ESA (full immersion) .. 194 Figure 3.69: Variation of the pore volume of M I-0.45 mortar samples exposed to ESA (full
immersion) in different pore ranges ... 194 Figure 3.70: Pore size distribution of M I-0.45 and M I-0.6 mortar samples exposed to ESA
(full immersion) before (initial) and after (final) ESA... 195 Figure 3.71: Variation of the pore volume of M I-0.45 and M I-0.6 mortar samples exposed to ESA (full immersion) in different pore ranges before and after ESA ... 196 Figure 3.72: Pore size distribution of M I-0.45 and M I-0.6 mortar samples exposed to ESA (semi-immersion) before and after ESA... 197 Figure 3.73: Variation of pore volume of M I-0.45 and M I-0.6 mortar samples exposed to ESA (semi immersion) in different pore ranges ... 198 Figure 3.74: Pore size distribution of M I-0.45 and M I-0.6 mortar samples exposed to ESA ... 199 (drying/wetting cycles) ... 199 Figure 3.75: Variation of pore volume of M I-0.45 and M I-0.6 mortar samples exposed to ESA (drying/wetting cycles) in different ranges ... 199 Figure 3.76: Variation of the pore volume in different pore ranges of M I-0.6 mortar samples
exposed to three exposure conditions ... 200 Figure 3.77: Pore size distribution of M III-0.45 mortar samples exposed to ESA (full immersion and semi-immersion) before and after ESA ... 205 Figure 3.78: Pore size distribution of M III-0.6 mortar samples exposed to ESA (full immersion and semi-immersion) before and after ESA ... 205 Figure 3.79: Pore size distribution of M II/B-0.45 mortar samples exposed to ESA (full immersion and semi-immersion) before and after ESA ... 206 Figure 3.80: Pore size distribution of M II/B-0.6 mortar samples exposed to ESA (full immersion and semi-immersion) before and after ESA ... 206 Figure 3.81: Variation of the pore volume in different pore ranges of M I-0.6, M III-0.6 and M II/B-0.6 mortar samples exposed to ESA (full immersion) before and after ESA ... 207
22
Figure 3.82: Variation of pore volume in different pore ranges of CEM I, CEM III and CEM II/B mortar samples exposed to ESA (semi-immersion) before and after ESA ... 208 Figure 3.83: a) SEM images showing sound cement matrix, b) SEM images coupled with EDS
showing cement matrix of the mortar sample exposed ESA after 12 months of full immersion ... 209 Figure 3.84: Correlation between the evolution of expansion and the macroscopic degradation of M I-0.6 mortar samples exposed to ESA ... 211 Figure 3.85: Correlation between the evolution of both expansion and total porosity (WAPT) of M I-0.6 mortar samples ... 212 Figure 3.86: Correlation between the evolution of both expansion and compressive strength of M I-0.6 mortar samples ... 213 Figure 3.87: Longitudinal expansion of RC I-0.45 and RC I-0.55 specimens measured near the longitudinal rebar ... 219 Figure 3.88: Longitudinal expansion of RC I-0.45 and RC I-0.55 specimens measured far from the longitudinal rebar ... 219 Figure 3.89: Longitudinal expansion near (black is an average value) or far (blue lines) from rebar for specimen RC I-0.45 ... 220 Figure 3.90: Longitudinal expansion near (black is an average value) or far (red lines) from rebar for specimen RC I-0.55 ... 220 Figure 3.91: Comparison of transverse expansion (blue lines) with longitudinal expansion measured far from the rebar (red lines) of specimen RC I-0.45 ... 221 Figure 3.92: Comparison of transverse expansion (blue lines) with longitudinal expansion measured from the rebar (red lines) of specimen RC I-0.55 ... 221 Figure 3.93: Concrete splitting before exposure to accelerated ESA ... 224 Figure 3.94: Concrete splitting after 8 months of exposure to accelerated ESA ... 224 Figure 3.95: Bond force-slip curves for RC specimens before ESA and after ESA ... 225 Figure 3.96: Corrected bond force-slip curves for RC specimens before and after ESA ... 225 Figure 4.1: Concrete samples during the pre-saturation cycle ... 230 Figure 4.2: Cylinder equipped for length change measurements [231] ... 232 Figure 4.3: Prism equipped for length change measurements: a) pins for longitudinal expansion measurement and b) discs for axial expansion measurement ... 233 Figure 4.4: Comparator used to measure the axial expansion ... 233 Figure 4.5: Setup of compressive strength test ... 234 Figure 4.6: Axial expansion of concrete prisms as a function of the immersion time in the Na2SO4
solution ... 237 Figure 4.7: Axial expansion of concrete cylinders as a function of the immersion time in the Na2SO4
23
Figure 4.8: Axial expansion of concrete prisms (red) and concrete cylinders (black) as a function of the immersion time in the Na2SO4 solution ... 239
Figure 4.9: Longitudinal expansion of concrete prisms as a function of the immersion time in the Na2SO4 solution ... 241
Figure 4.10: Longitudinal expansion of concrete cylinders as a function of the immersion time in the Na2SO4 solution ... 241
Figure 4.11: Axial expansion (straight line) and longitudinal expansion (dotted line) of concrete prisms for mixes C1, C2, C3 and C4 as a function of the immersion time in the Na2SO4 solution ... 242
Figure 4.12: Longitudinal expansion of concrete prisms for concrete mixes C1, C2, C3, C4, C5, C6 and C7 as a function of the immersion time in the Na2SO4 solution ... 243
Figure 4.13: Expansion (longitudinal and axial) per shape as a function of the immersion time in the Na2SO4 solution after 16 weeks of exposure ... 244
Figure 4.14: Mass variation of concrete prisms as a function of the immersion time in the Na2SO4
solution ... 245 Figure 4.15: Mass variation of concrete cylinders as a function of the immersion time in the Na2SO4
solution ... 245 Figure 4.16: Distribution of the different cement phases in a CEM I (OPC) cement paste sample before and after 2 months of ESA. Anhydrous (anhydrous silicon); Other (C3A, C4AF, calcium
carboaluminate…) [20] ... 246 Figure 4.17: Longitudinal expansion of C1 and C5 concrete prisms as a function of mass variation after 16 weeks of ESA ... 247 Figure 4.18: Compressive strength of concrete mixes before and after 16 weeks of immersion in the Na2SO4 solution ... 248
Figure 4.19: Water Accessible Porosity of concrete mixes (C1, C2, C3 and C4) before and after 16 weeks of immersion in the Na2SO4 solution ... 251
Figure 4.20: Coefficient of diffusion of Cl- of all concrete mixes before and after immersion in the
Na2SO4 solution ... 253
Figure 4.21: Longitudinal expansion as a function of concrete mixes (C1, C2, C3 and C4) and
samples shape (prism or cylinder) at the end of accelerated attack ... 255 Figure 4.22: Mass variation as a function of concrete mixes (C1, C2, C3 and C4) and sample shape (prism or cylinder) at the end of the accelerated attack ... 256 Figure 4.23: Longitudinal expansion as a function of immersion time in the Na2SO4 solution for
samples (C5, C6 and C7) measured at Ifsttar and at LMDC ... 258 Figure 4.24: Longitudinal expansion as a function of immersion time in the Na2SO4 solution for
samples C1 and C5 measured at Ifsttar and at Armines ... 259 Appendix Figure A.1: CEM I 52.5 N CE CP2 NF technical data sheet ... 284
24
Appendix Figure A.2: Technical sheet of the sand used to cast mortar samples and reinforced concrete specimens ... 285 Appendix Figure B.1: a) White precipitation obtained by drying method after 1 month of exposure to ESA, b) Zoom on the penetration depth observed after 1 month (photo treated by increasing contrasts) ... 286 Appendix Figure B.2: a) White precipitation obtained by drying method after 5 months of exposure to ESA, b) Zoom on the penetration depth observed after 5 months (photo treated by increasing contrasts) ... 286 Appendix Figure B.3: a) White precipitation obtained by drying method after 6 months of exposure to ESA, b) Zoom on the penetration depth observed after 6 months (photo treated by increasing contrasts) ... 287 Appendix Figure C.1: a) Visual appearance of M I-0.6 prisms equipped with pins after 12 months of immersion, b) Visual appearance of M I-0.45 prisms equipped with pins after 12 months of
immersion ... 288 Appendix Figure C.2: a) Visual appearance of M I-0.6 prisms equipped with pins after 12 months of semi-immersion, b) Visual appearance of M I-0.45 prisms equipped with pins after 12 months of semi-immersion ... 288 Appendix Figure C.3: a) Visual appearance of M I-0.6 prisms equipped with pins after 12 months of drying/wetting cycles, b) Visual appearance of M I-0.45 prisms equipped with pins after 12 months of drying/wetting cycles ... 289 Appendix Figure D.1: a) Visual appearance of M I-0.6 mortar samples after 6 months of full
immersion, b) Visual appearance of M I-0.45 mortar samples after 6 months of full immersion .... 290 Appendix Figure D.2: a) Visual appearance of M I-0.6 mortar samples after 6 months of semi-immersion, b) Visual appearance of M I-0.45 mortar samples after 6 months of semi-immersion 290 Appendix Figure D.3: a) Visual appearance of M I-0.6 mortar samples after 6 months of
drying/wetting cycles, b) Visual appearance of M I-0.45 mortar samples after 6 months of
drying/wetting cycles ... 291 Appendix Figure E.1: Transverse expansions F1c and F3b of RC I-0.45 and RC I-0.55 specimens ... 292 Appendix Figure E.2: Transverse expansions F2a and F2b of RC I-0.45 and RC I-0.55 specimens ... 293
25
List of tables
Table 1.1: Gypsum and ettringite formation as a function of sulfate concentration [20]... 63 Table 2.1: The exposure classes corresponding to aggressive chemical environments as proposed by NF EN 206-CN [183]... 92 Table 2.2: Exposure conditions (sodium sulfate concentration and pH) found in some of the
previous studies related to ESA [20] ... 94 Table 2.3: Composition of cement CEM I 52.5 N CE CP2 NF provided by the manufacturer ... 94 Table 2.4: Main cement clinker phases calculated by Bogue method based on the information given in Table 2.3 ... 95 Table 2.5: Mixes used to prepare mortar samples ... 100 Table 2.6: Mix designs of one batch of mortar (Kg/m3) ... 101
Table 2.7: Composition of the cement materials CEM I and CEM III provided by the manufacturer ... 102 Table 2.8: Summary of the bath numbers, exposure conditions and sample mixes used during the experimental work performed on mortar samples ... 105 Table 2.9: Samples designed to measure expansion ... 114 Table 2.10: Concrete mix proportions ... 123 Table 3.1: Porosity measured by MIP and WAPT for M I-0.45 samples ... 201 Table 3.2: Porosity measured by MIP and WAPT for M I-0.6 samples ... 201 Table 3.3: Results of mechanical tests ... 223 Table 4.1: Concrete mix proportions (Kg/m3) ... 228
Table 4.2: Composition and characteristics of the cements ... 229 Table 4.3: Conditions used in the accelerated sulfate attack... 231 Table 4.4: Compressive strength of concrete mixes before and after ESA ... 248 Table 4.5: Water Accessible Porosity of concrete mixes before and after ESA ... 250 Table 4.6: Coefficient of diffusion of Cl- of all concrete mixes before and after ESA ... 252
26
Introduction
Concrete structures are highly exposed to different types of destructive processes attributed to the presence of aggressive agents in the surrounding environment. This can involve the exposure to external sulfate attack (ESA) considered as a main threat to the durability of structures. The attack can be defined as a series of chemical reactions that occur in a cement-based material between sulfate ions, having penetrated into the matrix by a transport process, and cement hydrates and residual anhydrous cement especially C3A acting as a source of aluminates in the material. As a result, ESA seems to
be caused by two processes. The first is physical where the transfer of sulfate ions from the outer solution into the porous media of the cement matrix is coupled with leaching of calcium ions to the outside. This process is highly influenced by the transfer parameters like porosity and permeability of the matrix. On the other hand, the second process is chemical and depends more on the chemical composition of the cementitious material. This one includes the overall chemical reactions that occur inside the material between hydrates components, residual anhydrous compounds and sulfate ions that penetrated through the pores. The coexistence of two main processes makes it imminent to analyze both the physical and chemical aspects of ESA.
The degradation mechanism caused by ESA includes expansion of pores/cracks caused by the formation of expansive products (ettringite and/or gypsum), changes in the microstructure, formation of microcracks, strength loss and visible deformation of the concrete structures. The main changes in the microstructural behavior of cementitious materials exposed to ESA are attributed to the formation of ettringite and/or gypsum both in capillary pores and smaller gel pores. During the early phases of the attack, ettringite crystals precipitate in the large voids without leading to serious swelling. As ESA progresses inside the material, the crystals penetrate into smaller capillary and gel pores leading to excessive ESA-induced expansion and significant damage. Based on this, it seems interesting to evaluate the damage mechanism associated to ESA by implementing macroscopic and microscopic evaluation methods.
The progress of ESA is influenced by several parameters existing in the material itself including the chemical composition of the cement, mainly the tricalcium aluminate (C3A)
content, presence of mineral additions and the water to cement (w/c) ratio. Other variables related to exterior surrounding conditions like pH of the solution, temperature and type of cations associated to sulfate ions can also have an impact on the progress of the attack and the transport process. Overall, the physico-chemical aspects of ESA and their destructive impacts on the microstructure and durability of cementitious materials have been elaborated in different extensive studies. However, there is a lack of experimental investigations covering both the macroscopic and microscopic behaviors of cementitious materials during ESA while taking into consideration the influence of the exposure condition, type of cement and w/c ratio.
27
On the other hand, the presence of a reliable and relevant accelerated testing method performed inside a laboratory in order to evaluate the resistance of cementitious materials against ESA is still missing.
Moreover, the complicated chemical and physical aspects of ESA make it difficult to find a rapid and practical in-situ diagnosis of an actual state of a concrete structure exposed to ESA.
Among the issues discussed in the research community, there is the question of accelerated test applied on cementitious samples in laboratory conditions. Because of the slow ESA process occurring in the field and requiring many years, the solution for understanding and analyzing the reaction mechanisms is to accelerate sulfate ingress into the cement matrix by: (i) using high concentrations to accelerate the transport process, (ii) maintaining a constant pH for the sulfate solution with a periodic renewal in order to increase the rate of sulfate attack, (iii) storing at high temperatures (e.g. > 30°C) to promote the reaction kinetics and (iv) reducing the curing time of the tested samples to increase the porous material, hence accelerating the transport process of sulfate ions. However, all these existing protocols are criticized for being non-representative of the overall mechanisms occurring during ESA including both the chemical and physical aspects of the attack.
In addition, one of the topics not elaborated in literature is the effect of ESA on reinforced concrete structures especially the bond behavior between concrete and reinforcing steel. It is believed that ESA can seriously damage the concrete cover by decreasing the bond capacity between concrete and reinforcing steel bar, hence leading to the failure of the totality of the structure. However, the understanding of this entire phenomenon remains incomplete and unclear.
Considering the presented above and all the issues associated to ESA, this thesis work presents a multi-material-scale experimental study that helps in elaborating a full characterization of the macroscopic and microscopic behaviors associated to the exposure of cement-based materials to ESA. As a result, several key main objectives are developed and classified according the type of the tested material:
- At the scale of the cement paste sample, the evaluation of the performance against ESA includes two newly developed techniques. The first aims for measuring the penetration depth of sulfate ions after drying via easy and rapid visual observation. The second method consists on measuring the length changes caused by ESA-induced expansion using an optical-fiber based method.
28
- At the scale of mortar sample, three different types of exposure conditions (full immersion, semi-immersion and drying/wetting cycles) are applied and compared. In addition, the physico-mechanical aspects of ESA are studied on different types of mortar mixes by performing a series of macroscopic investigations including visual observations, length changes, mass variations, changes in compressive and tensile strengths and changes in water accessible porosity. In parallel, the microstructural behavior is evaluated by referring to the changes in pore volumes in different pore ranges based on MIP (Mercury Intrusion Porosimetry) results.
Also, the microstructures of a sound and affected mortar samples are compared by SEM (Scanning Electron Microscopy) technique before and after exposure to ESA.
- At the scale of concrete sample, a study is performed in accordance with Perfdub national project to evaluate the performance of different types of concrete mixes against ESA while investigating the effects of cement type, sample shape and exposure condition on the extent of ESA development. The investigations include axial and longitudinal length change measurements and mass variations. Also, the changes in compressive strength, water accessible porosity and diffusion coefficient of chloride ions are recorded before and after the exposure to ESA. On the other hand, the influence of increasing the renewal frequency of the attacking solution and the ratio of Vsolution/Vsample on the kinetics of ESA-induced expansion and the acceleration of the
degradation process is well presented in this part.
- At the scale of reinforced concrete specimens, the relationship between the evolution of the ESA-induced expansion and the location of the reinforcing steel bar embedded inside the specimen is discussed. Moreover, the effect of ESA on the bond behavior between reinforcing steel and surrounding concrete is studied by performing a series of pull-out direct tests before and after exposure to ESA.
Based on this, the present dissertation includes four main chapters. After the introduction, a literature review on ESA is presented in chapter 1 including an overview on previous studies and experimentations performed in order to explain the damage mechanism generated by ESA-induced expansion and determine the main products causing the damage inside the material.
Also, the literature review presents some of the previous approaches used to evaluate the performance of cement-based materials against ESA. These approaches were based on developing an accelerated testing methodology inside laboratories in order to monitor the macroscopic and microscopic behaviors within a reasonable period of time. The conclusions of this literature review have highlighted the lack of researches on this topic of ESA and justify the approach to be followed to perform a large experimental study campaign to meet the objectives previously described.
The second chapter introduces the experimental programs applied in this work including the materials used to fabricate cement paste, mortar, concrete and reinforced concrete specimens.
29
The casting and curing strategies are all explained and the accelerated ESA testing methods developed inside the laboratories are well presented. Contrary to mortar specimens and reinforced concrete structures, cement paste and concrete specimens were exposed to an accelerated ESA while maintaining a constant pH of the solution and controlled temperature. Three accelerated tests were proposed and compared by exposing mortar specimens to full immersion, semi-immersion and drying/wetting cycles using a high concentration (15 g/L) sodium sulfate solution.
The experimental procedures include the investigation techniques that helped in monitoring the behavior of the specimens against ESA. For cement paste samples, the penetration depth of sulfate ions and visual deterioration were monitored. In addition, a new technique was implemented to follow the ESA-induced expansion using an optical-fiber based method. For mortar specimens, the investigations included visual inspections of the macroscopic damage, measurements of the physical changes in length and mass and evaluation of the mechanical properties.
Moreover, the Water Accessible Porosity (WAPT) was obtained by hydrostatic weighing and the microstructure changes were evaluated using Mercury Intrusion Porosimetry (MIP) and SEM technique.
The performance of concrete against ESA was evaluated as part of the Perfdub study by monitoring the changes in length, mass, compressive strength, porosity (WAPT) and coefficient of diffusion of Cl-.
On the other hand, the studies on reinforced concrete specimens included expansion measurements and mechanical testing to evaluate the effects of ESA on the bond behavior between reinforcing steel and concrete using direct pull-out tests.
The experimental results are given and analyzed in chapter 3 for cement paste, mortar and reinforced concrete specimens tested. The macroscopic behavior of the cylindrical cement paste samples (length = 5cm and diameter = 10cm) during ESA was discussed and explained by applying an existing model to illustrate the swelling and the cracks appearance occurring during exposure to semi-immersion. The results obtained with the newly proposed method to detect the penetration depth of sulfate ions by drying at 50% RH and T = 20°C were presented at specific time intervals and compared to penetration depths obtained by ICP-AES (Inductively Coupled Plasma). Moreover, the ESA-induced expansion measured by implementing an optical-fiber in the cement paste prisms (3 x 4 x 16 cm3) was compared to values obtained by extensometer. At the end, a
subjective evaluation was given including the advantages, disadvantages and possible future perspectives for both drying technique and optical-fiber based method.
The performance of mortar samples (4 x 4 x 16 cm3) was studied during ESA based on
the overall results obtained after recording the variations in expansion, mass, compressive strength, tensile strength and porosity (WAPT).
30
A comparison was made between the three exposure conditions (full immersion, semi-immersion and drying/wetting cycles) while discussing the effects of the mortar mix on the response against ESA especially the influence of the type of cement and w/c ratio. The progression of the damage process experienced by mortar samples during ESA was analyzed by associating the evolution of expansion to surface deterioration, decrease in mass, loss of mechanical strength and changes in total porosity. The microstructure was characterized at the surface level via MIP results based on the pore size distribution and pore volume variations which helped in determining the zone of initiation of expansion. The study on the reinforced concrete specimens included length measurements recorded on 18 x 10 x 12.5 cm3 prisms; direct pull-out tests performed using 6 x 10 x
12.5 cm3 specimens and compressive strength results using concrete cylinders
(diameter = 11cm and length 22cm).
The relationship between the ESA-induced expansion and the position/location of the reinforcing bar embedded inside the specimen was described. On the other hand, the impact of ESA progression on the bond capacities between the reinforcing steel and surrounded concrete was discussed based on the direct pull-out test.
The tests performed on concrete prisms (7 x 7 x 28 cm3) and concrete cylinders
(diameter = 11cm and length = 22cm) as part of the national Perfdub study are presented in chapter 4.
The damage evolution of different types of concrete mixes including various cement types experienced during ESA was evaluated and compared by monitoring the changes in length, mass, compressive strength, WAPT porosity and coefficient of diffusion of chloride.
A previously selected and defined acceleration protocol by Perfdub was applied in this experimental study but with few modifications introduced at Ifsttar. In fact, the ratio of the Vsolution/Vsample was increased from 1 to 3 and the sodium sulfate solution was renewed twice/month instead of once/month. The influence of these modifications on the kinetics of ESA and the acceleration of the damage process are discussed in this chapter.
Finally, this dissertation ends with a summary of the conclusions and perspectives for further studies in the future.
31
32
1. Literature review
1.1. Introduction
External sulfate attack (ESA) is defined as a deterioration phenomenon of cement-based materials exposed to external sources of sulfate. The presence of high sulfate content in the material can lead to serious damage and loss of mechanical strength [1]. The attack includes a series of physical and chemical interactions between the sulfate ions and the hardened cement pastes. The attack results from the reaction between sulfate ions penetrating into the material and tricalcium aluminate (C3A) present in the cement
paste. The main physics of ESA such as the degradation of the cement-based material and the mechanism of expansion have been widely discussed and analyzed in previous studies [2–5].
In this chapter, the current state of art of research studies related to ESA is presented and explained based on a literature review. The different mechanisms surrounding this phenomenon as well as the parameters influencing the attack are discussed. Moreover, a synthesis of the existing lab testing methods to accelerate the sulfate ingress are listed and analyzed to justify the objectives of the experimental program designed to conduct the present research. Considering that one of the aspects considered in the experimental study deals with the impact of ESA on the concrete/rebar interface behavior from a mechanical point of view, a literature review concerning the bond of steel with concrete in reinforced structures (RC) is also presented.
1.2. Cement chemistry
Concrete is a composite material consisting of at least cement as binder, sand, water and aggregates. When in contact with water, cement hardens and forms a cohesive binder [6]. However, in accordance with the models for sustainable development, the cement industry tries to devise the best strategy to decrease energy consumption as well as CO2 emissions in construction [6]. One of the simplest plans is to partially replace
conventional Portland cement by industrial products or by products (such as fly ash) or/and to improve the durability of RC structures. This strategy is very dependent on the overall performance of hardened concrete that can be seriously affected by chemical attacks such as ESA. However, the evaluation of the resistance of an existing or a new structure against any type of chemical attack usually requires many years before the release of appropriate results. Due to this, accelerated tests are used for laboratory investigation that involves smaller samples exposed to more aggressive conditions. Portland cement, abbreviated as PC, contains calcium silicate phases (C2S and C3S),
calcium aluminate (C3A) and calcium aluminate ferrite (C4AF) with a small quantity of
gypsum. Both calcium silicates belite (C2S) and calcium silicates alite (C3S) are
![Figure 1.7: Variation of the water gain with the volumetric expansion [34]](https://thumb-eu.123doks.com/thumbv2/123doknet/14594900.730421/47.892.280.617.120.408/figure-variation-water-gain-volumetric-expansion.webp)
![Figure 1.19: Length changes of CEM I mortar bars exposed to different sulfate solutions [71]](https://thumb-eu.123doks.com/thumbv2/123doknet/14594900.730421/61.892.173.723.130.461/figure-length-changes-mortar-exposed-different-sulfate-solutions.webp)
![Figure 1.27: Depths reached by portlandite, ettringite and gypsum after an accelerated ESA performed at pH = 7 and with solution renewal [114]](https://thumb-eu.123doks.com/thumbv2/123doknet/14594900.730421/67.892.231.668.110.399/figure-depths-reached-portlandite-ettringite-accelerated-performed-solution.webp)
![Figure 1.33: The large dispersion of the ESA-induced expansion results between the different participating laboratories , after [119]](https://thumb-eu.123doks.com/thumbv2/123doknet/14594900.730421/72.892.202.691.116.453/figure-dispersion-induced-expansion-results-different-participating-laboratories.webp)
![Figure 1.37: a) Slipping of reinforcement steel, b) Bond stress – slip in the case of friction [B=D] [135]](https://thumb-eu.123doks.com/thumbv2/123doknet/14594900.730421/79.892.154.750.145.345/figure-slipping-reinforcement-steel-bond-stress-slip-friction.webp)
![Figure 2.1: The two stages process of expansion during external sodium sulfate attack [58]](https://thumb-eu.123doks.com/thumbv2/123doknet/14594900.730421/93.892.239.659.716.1023/figure-stages-process-expansion-external-sodium-sulfate-attack.webp)