https://doi.org/10.4224/23002718
READ THESE TERMS AND CONDITIONS CAREFULLY BEFORE USING THIS WEBSITE.
https://nrc-publications.canada.ca/eng/copyright
Vous avez des questions? Nous pouvons vous aider. Pour communiquer directement avec un auteur, consultez la première page de la revue dans laquelle son article a été publié afin de trouver ses coordonnées. Si vous n’arrivez pas à les repérer, communiquez avec nous à PublicationsArchive-ArchivesPublications@nrc-cnrc.gc.ca.
Questions? Contact the NRC Publications Archive team at
PublicationsArchive-ArchivesPublications@nrc-cnrc.gc.ca. If you wish to email the authors directly, please see the first page of the publication for their contact information.
Archives des publications du CNRC
For the publisher’s version, please access the DOI link below./ Pour consulter la version de l’éditeur, utilisez le lien DOI ci-dessous.
Access and use of this website and the material on it are subject to the Terms and Conditions set forth at
Determination of the radiation chemical yield (G) for the Fricke
chemical dosimetry system in photon and electron beams
McEwen, Malcolm; Gamal, Islam El; Mainegra-Hing, Ernesto; Cojocaru,
Claudiu
https://publications-cnrc.canada.ca/fra/droits
L’accès à ce site Web et l’utilisation de son contenu sont assujettis aux conditions présentées dans le site
LISEZ CES CONDITIONS ATTENTIVEMENT AVANT D’UTILISER CE SITE WEB.
NRC Publications Record / Notice d'Archives des publications de CNRC: https://nrc-publications.canada.ca/eng/view/object/?id=631dca53-568a-4769-9f5c-70519bcdd6c4 https://publications-cnrc.canada.ca/fra/voir/objet/?id=631dca53-568a-4769-9f5c-70519bcdd6c4
Measurement Science and Standards
Determination of the radiation
chemical yield (G) for the Fricke
chemical dosimetry system in
photon and electron beams
Malcolm McEwen, Islam El Gamal, Ernesto
Mainegra-Hing and Claudiu Cojocaru
Ionizing Radiation Standards
Report PIRS-1980 November 2014
1
Determination of the radiation chemical yield (G) for the Fricke
chemical dosimetry system in photon and electron beams
Report NRC-PIRS-1980
November 2014
Malcolm McEwen, Islam El Gamal, Ernesto Mainegra-Hing and Claudiu Cojocaru Ionizing Radiation Standards,
National Research Council Canada, Ottawa, Canada
ABSTRACT
Historical data for the Fricke G-value in photon and electron beams are reviewed and the results of recent measurements carried by the Ionizing Radiation Standards group at the
National Research Council are reported. Good repeatability was obtained for G(Fe3+) in a Co-60
beam compared to the previously–obtained value at the NRC (agreement within the combined standard uncertainty for results obtained more than ten years apart). The first data reported in decades have been obtained for kV x-rays beams, and these show a significantly higher value than given in the literature. Measurements for two kV x-ray beams at NRC (different effective energies and kerma rates) were consistent within their combined standard uncertainties
Based on the Co-60 and kV x-ray results, a value for G(Fe3+) for the mean energy of
Ir-192 was determined to be 1.589 ± 0.009 μmol J-1 (at a reference temperature of 25 °C) and this
will be used in the development of a Fricke-based standard of absorbed dose to water for HDR brachytherapy. The G-value for high energy electron beams (> 15 MeV) was measured to be 1.620 ± 0.006 μmol J-1 (@ 25 °C), which was found to be consistent with literature values and also
with NRC data for high-energy photon beams. This electron beam G-value is required to develop an absorbed dose to water standard for megavoltage (linac) electron beams.
1200 Montreal Road 1200, Chemin de Montréal
2
© Crown Copyright, 2014
The copyright of reports is owned by the National Research Council. Reports may be reproduced in whole without prior approval. However,
reproduction of parts of a report requires the written approval of NRC. The content may be referenced (using the title and report number) in any
subsequent publications.
The description of any specific equipment within an NRC report does not imply that NRC approves, recommends, or endorses that product, or
the manufacturer, supplier or users of any instruments, or that NRC guarantees or predicts in any way the performance of similar equipment.
3 1. INTRODUCTION
In a chemical dosimeter, the absorbed dose is determined from some quantitative change in an appropriate material and any well-characterized chemical reaction may serve as the basis for the dosimeter. Chemical dosimeter systems were developed as early as 1927 and a wide range of systems have been studied. The ferrous sulphate dosimeter (Fricke and Hart, 1966) is the most widely used and longest-established dosimetry system. The reaction mechanism is the oxidation of ferrous (Fe2+) to ferric (Fe3+) ions, in aerated, dilute sulphuric acid. The oxidation
proceeds via a number of reactions involving hydroxyl radicals, hydroperoxy (HO2) radicals
and hydrogen peroxide. The ferric ion formation is directly proportional to energy absorbed as long as some oxygen remains in the solution, hence the requirement for aeration. All the reactions are fast (< 1 minute) and there is therefore no after-effect under usual γ- or electron irradiations. The concentration of ferric ions may be determined by titration but absorption spectroscopy is generally a more convenient technique as irradiation causes a change in the optical density of the solution. The absorption spectrum for the Fricke solution has two peaks in the UV region, at wavelengths of 304 nm and 224 nm. The normal dose range is 10 Gy to 350 Gy and for accuracy one requires a minimum dose of 20 Gy. For a recent review of the Fricke dosimeter system the reader is referred to McEwen and Ross (2009) and for a detailed description of the system and procedures employed in the Ionizing Radiation Standards group at NRC see the report by Olzanski et al (2002).
To realise dose one requires what is referred to as the G-value, a factor that relates production of a chemical species to the energy absorbed. The relationship between the absorbed dose to the Fricke solution and the G-value is given by:
� =
∆ ���[�∙ 3+ ∙�∙ ] (1)
Where ΔODnet is the net change in the optical density of the Fricke solution due to irradiation,
G(Fe3+) is the radiation yield of Fe3+ ions, ρ is the density of the Fricke solution and ε and d
relate to the spectrophotometer readout system.
This document reviews the historical data for the Fricke G-value in photon and electron beams and reports values obtained in recent years by the Ionizing Radiation Standards group at the National Research Council.
2. HISTORICAL DATA 2.1. Photon beams
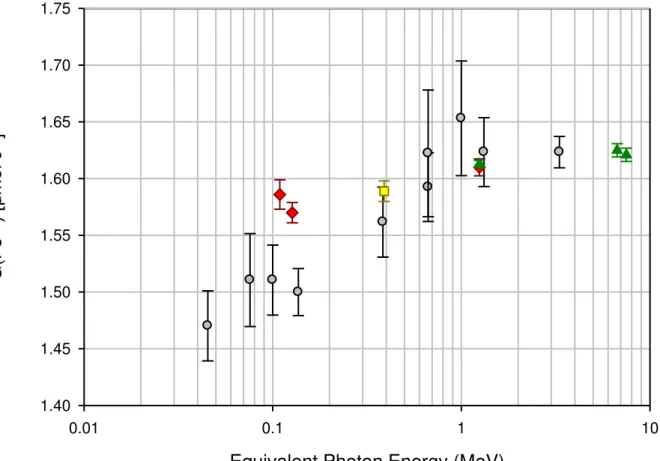
Figure 1 shows a semi-log plot of historical G-value results versus equivalent photon energy, collected by Klassen et al (1999). There is a clear decrease of G-value with decreasing equivalent photon energy while at higher energies the G-value seems to be relatively independent of beam
4
quality (ICRU 14, 1969). The decrease in G-value with decreasing equivalent photon energy or equivalently, increasing linear energy transfer, LET, can be attributed to increased intra-track interactions due to the more densely ionizing high LET radiation, resulting in recombination of the radiolysis products of water needed to oxidize the ferrous ions. High dose rates would also be expected to decrease the G-value by the same mechanisms as high LET radiation. Investigations into the effects of the dose rates of photons showed that the G-value was constant at instantaneous dose rates below 107 Gy min-1 (ICRU 34, 1982). The summary for photon beams
is that that there is accurate data for Co-60 and high-energy (MV) x-ray beams but that data in the kV energy range has large uncertainties and the results are decades-old.
Equivalent Photon Energy (MeV)
0.01 0.1 1 10
G
(Fe
3+) [µ
mo
l J
-1]
1.40 1.45 1.50 1.55 1.60 1.65 1.70 1.755 2.2 Electron beams
The data given in Figure 1 for photon beams relies on an absorbed dose or air kerma standard to provide the reference (DF in equation (1)). However, for high-energy electron beams there is
another route to the G-value determination: if electrons of known energy and fluence rate are fully stopped in Fricke solution then the radiation energy deposited by the electrons can be calculated. Although the energy will not be deposited uniformly, being a liquid, the
solution will respond with an average value of ODequivalent to the energy being
deposited uniformly throughout the volume. This approach was used by Feist (1982) and currently represents the primary standard for electron beam dosimetry at the Swiss standards laboratory, METAS (Vörös et al, 2012). The technique relies on an electron beam with a known energy and beam current being totally absorbed by an amount of Fricke solution. The accelerator in the cases of both PTB and METAS is a microtron (electron cyclotron) and the integrated absorbed dose to the Fricke solution, DF, is given by:
� =
� � (2)where Ee is the individual electron energy, N is the total number of electrons absorbed in the
Fricke solution and m is the mass of solution. The product of correction factors, fT, takes account
of bremsstrahlung losses, bremsstrahlung re-absorption, backscattering of primary electrons and energy losses in the accelerator exit window and entrance wall of the Fricke vessel. There will be significant dose variations within the Fricke solution due to the geometry of the incident beam and the shape of the depth-dose curve and the dose obtained by equation (2) is therefore not dose at a point but a mean, integrated dose (assuming good mixing of the Fricke solution).
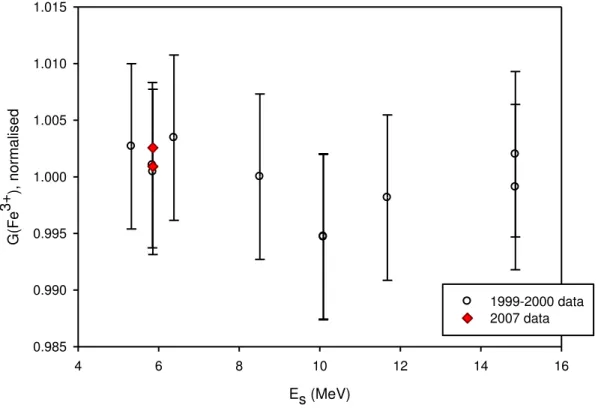
Equation (2) can be substituted into equation (1) and re-arranged to give the G-value. Stucki and Vörös (2007) determined the relative G-value at seven electron beam qualities for nominal energies 5.5 MeV to 15 MeV (R50,w = 1.75 g cm-2 to 5.67 g cm-2). The energy spectrum
from the microtron has a FWHM of approximately 35 keV so the electron beams can be considered to be mono-energetic. The results are shown in Figure 2 for two sets of measurements, several years apart.
6 Es (MeV) 4 6 8 10 12 14 16 G(F e 3+ ), norm alised 0.985 0.990 0.995 1.000 1.005 1.010 1.015 1999-2000 data 2007 data
Figure 2. Determination of relative G(Fe3+) for Fricke solution at METAS. The data are normalized to the
mean of the 1999-2000 data. The energy, Es, is that of electrons entering the Fricke solution (i.e. taking
account of energy losses upstream of the Fricke vessel). Uncertainty bars are given as one standard uncertainty.
The uncertainties are assumed to be uncorrelated and, as can be seen, there is no significant variation in the G-value with energy. Vörös and Stucki (2007) used EGSnrc to
calculate the energy losses due to backscatter, bremsstrahlung, etc and found that the correction ranged from 2.7 % at 5 MeV to 8.2 % at 22 MeV. The result in Figure 2 implies that the
corrections for energy losses and bremsstrahlung are consistent for the different volumes of Fricke used at the different energies.
3. NEW MEASUREMENTS AT NRC 3.1. Requirements for new data
The determination of new G-value data at NRC was driven by two projects: i) development of a primary standard for high energy electron beams, ii) development of a primary standard for Ir-192 HDR brachytherapy.
The enabler for these measurements was the transfer of the technique used for the calibration of ionization chambers used at METAS. This technique involves the use of polyethylene (PE) bags
7
to hold the Fricke solution, rather than the traditional quartz or glass vials. A thin PMMA holder is used to position the bag in the beam with the required accuracy, as shown in Figure 3.
Figure 3. Schematic of the PMMA holder used for G-value measurements. Blue denotes the Fricke containing PE bag whilst the PMMA walls are shown in grey. The design is nominally identical to that used at METAS.
Greater care is required in the readout protocol due to the potential leaching of contaminants from the plastic bag but results from METAS have shown that this is not an insurmountable problem.
3.2 Measurement of optical density
A modified Cary 400 spectrophotometer (Olszanski et al, 2002) is used to measure the optical density. The sample compartment containing the cuvettes is maintained at 25.00 ± 0.01 °C and compressed nitrogen (100 cm3 s-1) is used for purging O
2 and ozone, to limit contamination of
the spectrophotometer’s optics. A custom program allows the readout process to be automated. During readout the sample compartment can hold two cuvettes, an empty sample compartment and a standard absorbance filter. A 30 % transmittance metal-on-quartz standard absorbance filter (NIST SRM-2031) is used with an expected absorbance reading at 303 nm of 0.355 optical density units. The role of the filter is to verify the reliability of the absorbance readings, given the potential effects of baseline drift or misalignment of the sample compartment with the optical components of the spectrophotometer. For some of the investigations outlined below, readings were also taken at 224 nm but these were only used as a check on the 303 nm results and all results refer only to spectrophotometer measurements at the longer wavelength.
8
Equation 1 shows that if the optical density is measured, the denominator in the equation, [� ∙ 3+ ∙ � ∙ ], can be evaluated by rearranging the equation as follows:
[�∙ 3+ ∙�∙ ]
=
∆ �� � � (3)The equation is shown this way to highlight the fact that if the readout procedure and Fricke solution composition used throughout does not change (i.e., from calibration to use), the evaluation of the product [� ∙ 3+ ∙ � ∙ ] is sufficient and makes this work independent of the value of the density of the Fricke solution, the molar linear absorption coefficient and optical path length of the cuvettes used in the calculation. Although this is the approach routinely used at NRC, the G-value will also be reported, as this is more relevant to the wider Fricke dosimetry community.
3.3. Requirements for Ir-192 brachytherapy
In developing a primary standard for Ir-192 based on the Fricke dosimeter one requires the G-value. To overcome the need to use a separate absorbed dose to water standard at the mean Ir-192 energy (which would be somewhat self-defeating) the approach taken was to interpolate from known G-value determinations at other photon energies. The average photon energy emitted by an Ir-192 source is 0.38 MeV, which lies in a region of Figure 1 exhibiting a log-linear relation. A minimum of two points in the energy range 0.1 MeV to 1.25 MeV would be required. This approach to obtain the Fricke G-value is entirely analogous to the method used to determine an air kerma calibration coefficient for the reference standard ion chamber (Goetsch et al, 1991; Mainegra-Hing and Rogers, 2006).
One could choose to simply use the historical data shown in Figure 1 but a review of that collation indicates that, i) the data was acquired over many years using different formulations of Fricke solution and different read-out procedures, and ii) the dose (kerma) standards used are not necessarily consistent and difficult to re-evaluate. To provide an accurate and self-consistent determination of G(Fe3+) for Ir-192 energies it was decided to base the interpolation solely on measurements made at the NRC using Canadian national standards of absorbed dose and air kerma. The two beams chosen were Co-60 and 250 kV x-rays and the respective standards were a water calorimeter (Ross et al, 2000) and a free air chamber (Mainegra-Hing, 2011). Since the latter provides an air-kerma measurement, a kerma-to-dose conversion factor is required to yield the absorbed dose to Fricke and this was obtained through Monte Carlo simulations (see below).
9 3.4 Measurements in kV x-rays
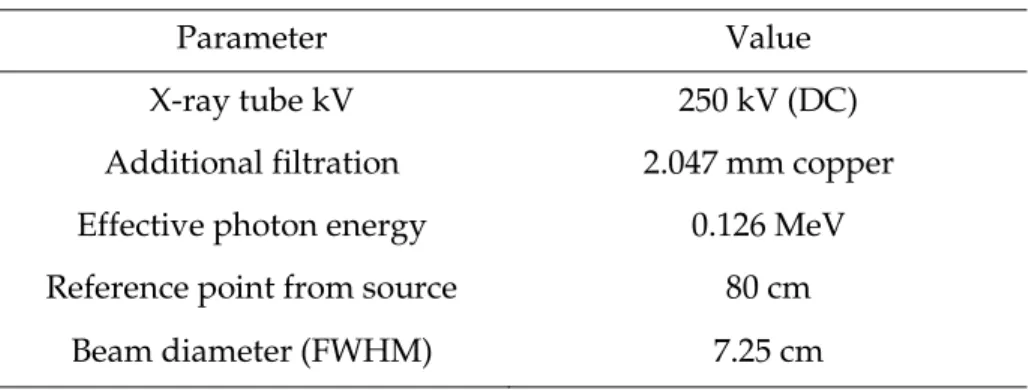
The details of the x-ray irradiation setup are as follows:
Table 1: Experimental parameters for x-ray irradiations
Parameter Value
X-ray tube kV 250 kV (DC) Additional filtration 2.047 mm copper Effective photon energy 0.126 MeV Reference point from source 80 cm
Beam diameter (FWHM) 7.25 cm
The air-kerma rate was evaluated at the start of each irradiation day using the NRC primary standard free air chamber. A polyethylene bag containing 4.23-4.28 g of Fricke was placed in the PMMA holder, as shown Figure 3, with its centre positioned at the reference point. The irradiations were carried out free in-air (i.e., no additional backscatter) as previous work (Mainegra-Hing, 2011) had demonstrated the ability to accurately model the irradiation room. An air-kerma to dose conversion factor was derived from a detailed EGSnrc simulation of the complete geometry (x-ray tube, filters, Fricke holder, etc) to determine the absorbed dose to the Fricke solution. The biggest challenge in this experiment is to deliver a sufficient dose to provide adequate precision of the net optical density. Common standards (ASTM, 2013) limit the dose to above 20 Gy, but careful cleaning and adoption of a rigorous control procedure meant that this limit could be reduced to around 10 Gy. Even so, the irradiation time was significant, around 1.67 hours per irradiation. The ambient room temperature during the irradiation was measured and used to convert the optical density readings to the reference temperature. For each irradiation day a control bag was filled with Fricke solution for the same amount of time as irradiations and read out without being irradiated at the beginning and end of the day. The average optical density reading for the control bags of each day was subtracted from the irradiated optical density readings conducted on the same day to determine the net change in optical density due to the radiation alone. The time-evolution of the background signal is generally linear with time (and small) for Fricke stored in glass or quartz vessels. However, the time-evolution of the background signal due to the polyethylene bags was harder to predict and it was therefore found that the most reliable method to correct for the impact of contaminants leaching from the PE bag was ensure that control and irradiated samples were kept in the bags for the same amount of time.The experiment was repeated for the same target dose of 11 Gy for different bags over multiple days.
10
The absorbed dose to the Fricke solution, DF, was obtained from the relation:
� = �
����[
���������
]
(4)where ����� is the measured air-kerma from the primary standard free-air chamber and the quantity in parentheses is the dose-to-kerma ratio calculated using Monte Carlo simulations. Different user codes of the EGSnrc MC simulation toolkit (V4-r2-4-0) (Kawrakow et al, 2013) were used for these calculations. Default MC transport parameters were used with a 1 keV transport energy cut-off for both photons and electrons. Detailed geometrical models of the experimental setup for these measurements were built by means of the EGSnrc C++ library egs++. The COMET MRX-320 x-ray tube used for the irradiation of the Fricke solution was simulated with a previously validated BEAMnrc model (Rogers et al, 2013), taking advantage of the directional bremsstrahlung splitting (DBS) technique (Kawrakow et al, 2004) for efficient x-ray tube simulations. This BEAMnrc model was used as a source of particles for the subsequent calculations of the dose to Fricke and the air-kerma at a given distance from the source. The EGSnrc user-code cavity allowed the estimation of the dose to a 4.25 g Fricke solution at 80 cm from the x-ray tube including the details of the PMMA bag and holder as shown in Figure 3. The potential effects of mechanical components surrounding the holder but not within the radiation field (and therefore not shown in Figure 3) were also investigated. The statistical one sigma uncertainty of the dose to Fricke was 0.01 % after 5 billion histories. The primary standard free-air chamber (FAC), was modelled with the egs_fac user code to efficiently estimate ���� at the measurement point of 80 cm from the x-ray source. After 414 million histories, the one sigma statistical uncertainty in the air-kerma was 0.06 %.
3.5 Measurements in Co-60
A similar procedure was adopted for the cobalt-60 irradiations, except for an in-phantom set-up. These irradiations were carried out even though the G-value for Co-60 has been determined previously at NRC (Klassen et al, 1999). However, those measurements used quartz vials to hold the Fricke solution. By using the same holder in both x-rays and Co-60 and making measurements close in time, potential systematic errors should be minimized. The centre of the bag was positioned at a water equivalent depth of 5.3 cm in a 30 cm × 30 cm × 30 cm water phantom. The SSD was 100 cm and the collimator of the Co-60 unit was set to produce a 10 x 10 cm field at the phantom surface. The doserate for the Co-60 unit was significantly higher than for the x-ray beam but for consistency of read-out, approximately the same dose was delivered to the Fricke solution. As for the x-ray measurements, irradiations were conducted over several days.
11
In this case the reference is the primary standard water calorimeter and therefore a conversion from absorbed dose to water to absorbed dose to Fricke solution is required before applying equation (3):
� = �
, ��
(5)where Pwall takes account of the holder material (significant for glass vials but small for
the holder in figure 3), kdd is the correction for the dose non uniformity over the Fricke solution
volume, and fw,f accounts for the difference in radiation absorption properties of the Fricke
solution and water. The size and construction of the holder, together with the composition of the Fricke solution mean that all the corrections for Co-60 are close to unity.
The entire process (measurements in both radiation beams) was repeated one year after the initial investigation to investigate long-term reproducibility and/or dependence on particular Fricke solution.
3.6 High-energy electron beams
The primary standard water calorimeter for high-energy electron beams is described by McEwen and Ross (2007). The design is based on the primary standard photon calorimeter (Ross et al, 2000) with some modifications to the geometry of the calorimeter vessel. Several NRC reference ion chambers were calibrated against the primary standard in 18 MeV and 22 MeV electron beams and these chambers were then used by Cojocaru et al (2011) to investigate the energy dependence of ion chamber calibration coefficients at lower electron energies (below 10 MeV), where perturbation corrections can be significant. This investigation relied on the data from Stucki and Vörös (2007), as shown in Figure 2, which indicated that the G-value for Fricke solution is independent of energy for all MeV electron beams. The comparison of Fricke and calibrated reference ion chambers at the highest energies available from the NRC Elekta linac allow a determination of the G-value (only the product εG for 18 MeV was presented by Cojocaru et al).
The operation and validation of the primary standard calorimeter and calibration of the reference ionization chambers is described by McEwen and DuSautoy (2009) and the details of the Fricke irradiations to determine the G-value are given by Cojoaru et al. However, the most relevant information is reproduced here for convenience.
As for the other irradiations described above, significant effort was put into assessing the cleanliness of the read-out system and the stability of the Fricke solution in time. Control measurements were performed with high purity water, samples of un-irradiated Fricke solution from the bulk storage and with samples of Fricke solution stored in the PE bags for a similar time to a typical irradiation (45 minutes to 180 minutes, depending on the dose delivered and the readout procedure). Irradiations were carried out using the Elekta Precise clinical linac at the NRC, which produces electron beams with nominal energies of 4 MeV, 8 MeV, 12 MeV, 18 MeV
12
and 22 MeV. The dosimeters were placed with their centre at the reference depth (as defined by the AAPM TG-51 protocol, Almond et al, 1999) in a 30 cm × 30 cm × 30 cm water phantom and doses in the range 6 Gy to 52 Gy were delivered to investigate signal-to-noise and any dose dependence. The volume of Fricke solution in each bag was similar to that used in the x-ray irradiations (~ 4 cm3). The irradiations were carried out over a period of five months to evaluate
the long-term repeatability of the system.
4. RESULTS AND DISCUSSION
4.1 G-value in photon beams
Tables 2 and 3 detail the results of the G-value obtained in this work at NRC for 250 kV x-rays and Co-60.
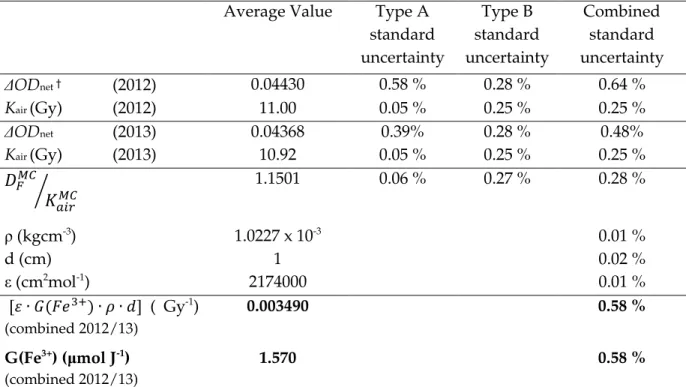
Table 2 Determination of G(Fe3+) for 250 kV x-ray beam from two separate sets of irradiations in
2012 and 2013 for a target delivered dose of 12 Gy. The data are derived from a total of 19 irradiations for 2012 and 20 irradiations for 2013. The EGSnrc MC simulation yielded an overall kerma-to-dose conversion factor as in equation 4, rather than individual components as indicated in equation (5).
Average Value Type A standard uncertainty Type B standard uncertainty Combined standard uncertainty ΔODnet † (2012) 0.04430 0.58 % 0.28 % 0.64 % Kair (Gy) (2012) 11.00 0.05 % 0.25 % 0.25 % ΔODnet (2013) 0.04368 0.39% 0.28 % 0.48% Kair (Gy) (2013) 10.92 0.05 % 0.25 % 0.25 %
�
�
���⁄
1.1501 0.06 % 0.27 % 0.28 % ρ (kgcm-3) 1.0227 x 10⁻³ 0.01 % d (cm) 1 0.02 % ε (cm2mol-1) 2174000 0.01 % [� ∙ 3+ ∙ � ∙ ] ( Gy-1) (combined 2012/13) 0.003490 0.58 % G(Fe3+) (μmol J-1) (combined 2012/13) 1.570 0.58 %The et opti al de sity is also corrected for irradiation and read-out temperature dependencies as described in Klassen et al and Olzanski et al. The reference temperature for both is 25 °C.
13
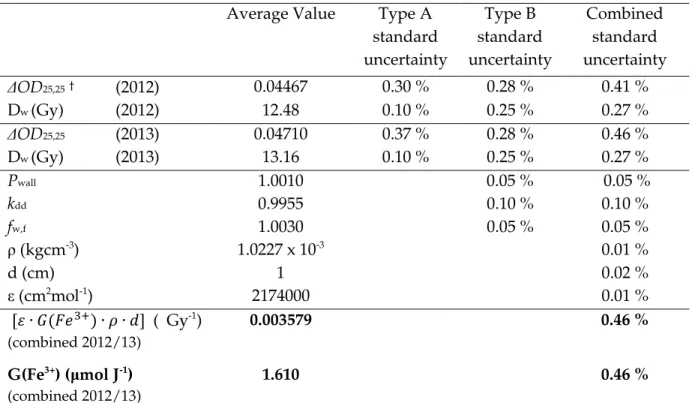
Table 3 Determination of G(Fe3+) at Co-60 energy from two separate sets of irradiations in 2012
and 2013, for a target dose of 13 Gy. The data are derived from a total of 13 irradiations for each set. In this case the correction factors required for equation (5) are shown explicitly.
Average Value Type A standard uncertainty Type B standard uncertainty Combined standard uncertainty ΔOD25,25† (2012) 0.04467 0.30 % 0.28 % 0.41 % Dw (Gy) (2012) 12.48 0.10 % 0.25 % 0.27 % ΔOD25,25 (2013) 0.04710 0.37 % 0.28 % 0.46 % Dw (Gy) (2013) 13.16 0.10 % 0.25 % 0.27 % Pwall 1.0010 0.05 % 0.05 % kdd 0.9955 0.10 % 0.10 % fw,f 1.0030 0.05 % 0.05 % ρ (kgcm-3) 1.0227 x 10⁻³ 0.01 % d (cm) 1 0.02 % ε (cm2mol-1) 2174000 0.01 % [� ∙ 3+ ∙ � ∙ ] ( Gy-1) (combined 2012/13) 0.003579 0.46 % G(Fe3+) (μmol J-1) (combined 2012/13) 1.610 0.46 %
Subscripts indicate the reference temperatures for the corrections for irradiation and read-out temperatures, which impact the optical density reading.
The value for the G-value for Co-60 is within the Type A standard uncertainties of the value given by Klassen et al (for measurements with the sealed water calorimeter, which is the NRC declared standard) of G(Fe3+) = (1.613 ± 0.005) μmol J-1. That we obtain the same result
more than ten years later with a different holder for the Fricke solution (polyethylene in this case compared to glass previously) gives us confidence that there are no significant systematic errors in the entire system. The Type B standard uncertainties for the readout in both Tables 2 and 3 are dominated by the variation in the background reading of un-irradiated Fricke solution.
A second irradiation was carried out in the 250 kVp x-ray beam using a different amount of added filtration. The irradiation geometry is identical but the mean photon energy is lower (and conversely, the mean air kerma rate is higher). This resulted in a value at E = 0.109 MeV of G(Fe3+) = (1.586 ± 0.013) μmol J-1. The larger uncertainty is primarily due to fewer irradiations
being carried out because of limited access to the x-ray facility. The absolute value of G(Fe3+) for
this lower energy is greater than that given in Table 2, when one would expect a lower value. However, the two data points agree at the level of the combined uncorrelated standard uncertainty (estimated to be 0.9 %).
14
Based on the results of our experiments at Co-60, 250 kVp X-ray, and the assumption based on historical data that the G-value and effective photon energy have a log-linear relationship in the region of interest, a G-value at Ir-192 was obtained. The linear interpolation based on our two standard beams resulted in 1.589 ± 0.009 µmol J-1, and is shown in Figure 4.
Alternatively the quantity [� ∙ 3+ ∙ � ∙ ] at the mean energy for Ir-192 has a value of (353.3 ± 2.2) x 10-5 Gy-1. The data for the second kV beam was not included due it being based on
fewer data points. A sensitivity analysis showed that adding the 109 keV point only changes the G-value by +0.2 %, due to the larger uncertainty on the lowest energy data point. By comparison, an interpolation based solely on the historical data in Figure 1 yielded a G-value at Ir-192 of 1.571 ± 0.013 µmol J-1. The larger number of points in the historical fit counteract the
larger uncertainty on each, resulting in an uncertainty in the Ir-192 value only 50% greater than the NRC-derived value. The possibility of revising the historical data through the use of updated key data and new Monte Carlo simulations was investigated, but it was concluded that there was insufficient information in the literature to give increased confidence in any re-evaluation compared to simply using the data as presented. Even so, it is at least reassuring that the two values for the G-value at the Ir-192 mean energy agree within the combined uncertainties.
15
Equivalent Photon Energy (MeV)
0.01 0.1 1 10
G(
Fe
3+) [µmol J
-1]
1.40 1.45 1.50 1.55 1.60 1.65 1.70 1.75Figure 4. Comparison of Fricke G-value obtained at the NRC for 250 kVp x-rays and Ir-192, compared to the historical data collated by Klassen et al. The key is as follows: gray circles – historical data from other researchers, green triangles – data obtained at NRC reported by Klassen et al, red diamonds – results from this work, yellow square – interpolated value for Ir-192. Uncertainty bars for literature values are as presented in Klassen et al, data for measurements at the NRC are given as one standard uncertainty.
16 4.2 G-value in electron beams
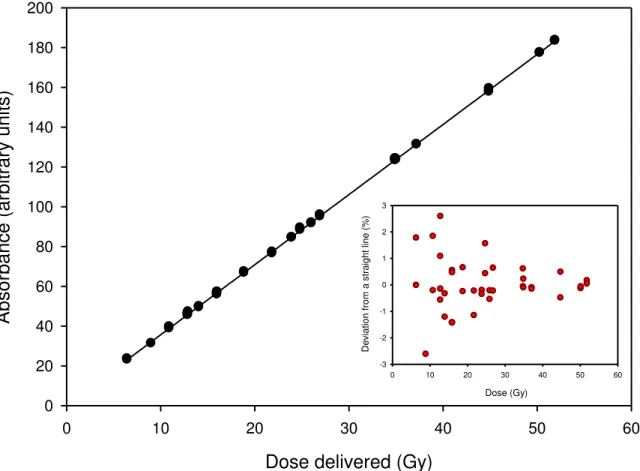
The results of the dose-dependency investigation for the 18 MeV electron beam are shown in Figure 5. There is no indication of any non-linearity and the standard uncertainty of the determination of the slope is estimated to be 0.2 %. Typical repeatability for dose delivered greater than 15 Gy is of the order of 0.8 %.
Dose delivered (Gy)
0 10 20 30 40 50 60
A
bsorbance
(ar
bit
rar
y
u
nit
s)
0 20 40 60 80 100 120 140 160 180 200 Dose (Gy) 0 10 20 30 40 50 60 De v iat ion f rom a strai gh t line (% ) -3 -2 -1 0 1 2 3Figure 5. Response of the system for the 18 MeV electron beam in the ~ 5–50 Gy dose range. In the inset,
the deviation from a straight line of individual data points (the residuals from the linear fit) is shown.
The results of the G-value determinations for the Fricke solution in the 18 MeV and 22 MeV beams are shown in Table 3.
17
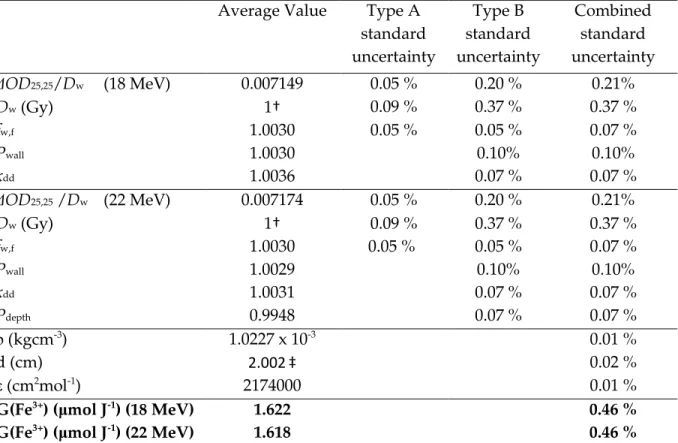
Table 4 Determination of G(Fe3+) in high-energy electron beams from irradiations carried out in
2009. The mean values for the absorbance are derived from typically 30 irradiations at each energy. As for Table 3, the correction factors required for equation (5) are shown explicitly.
Average Value Type A standard uncertainty Type B standard uncertainty Combined standard uncertainty ΔOD25,25/Dw (18 MeV) 0.007149 0.05 % 0.20 % 0.21% Dw (Gy) 1 0.09 % 0.37 % 0.37 % fw,f 1.0030 0.05 % 0.05 % 0.07 % Pwall 1.0030 0.10% 0.10% kdd 1.0036 0.07 % 0.07 % ΔOD25,25 /Dw (22 MeV) 0.007174 0.05 % 0.20 % 0.21% Dw (Gy) 1 0.09 % 0.37 % 0.37 % fw,f 1.0030 0.05 % 0.05 % 0.07 % Pwall 1.0029 0.10% 0.10% kdd 1.0031 0.07 % 0.07 % Pdepth 0.9948 0.07 % 0.07 % ρ (kgcm-3) 1.0227 x 10⁻³ 0.01 % d (cm) 2.002 0.02 % ε (cm2mol-1) 2174000 0.01 %
G(Fe3+) (μmol J-1) (18 MeV) 1.622 0.46 %
G(Fe3+) (μmol J-1) (22 MeV) 1.618 0.46 %
The a tual dose deli ered is i orporated i the slope alue reported i the ro a o e. The dose is listed separately here to indicate the uncertainties due to the primary standard and calibrated reference chamber separate from the dose delivery and Fricke measurement.
Note a differe t u ette as used for the ele tro ea easure e ts o pared to the photo ea measurements, where a 1 cm cuvette was employed.
It is interesting to note that correction for the difference in the radiation absorption properties of the water and Fricke, fw,f, was determined, through Monte Carlo based
calculations, to be independent of electron energy and also to be the same as that for Co-60. The correction for the perturbing effect of the polyethylene bag and the PMMA holder should be small, considering the small amount of material in the beam and the closeness in effective atomic number and density to that of water. Values for Pwall were taken from Monte Carlo
calculations carried out at METAS (Vörös and Stucki, 2007) and interpolated for the energies of the NRC Elekta linac. These same MC calculations showed that the effect of an air bubble present in the bag after sealing was below 0.1 % for all energies. No correction was applied for this effect but an uncertainty component is included in that given in Table 3 for Pwall. For the
determination of the beam non-uniformity correction, kdd, 2-D radial (perpendicular) beams
scans in a water phantom were combined with depth-ionization curves to plot the 3-D dose distribution within the Fricke volume. As expected, axial averaging due to the thickness of the dosimeter bag is small for all energies from the Elekta linac and negligible for the two beams
18
used here. The radial correction was found to be significant for low energy beams but was small for 18 MeV and 22 MeV. The correction, Pdepth, was required as it was found, in reviewing the
calibration of the reference ion chambers against the primary standard water calorimeter, that the measurement depth had been set incorrectly (for both chamber and calorimeter) for 22 MeV. Although the calibration is technically valid, it is not directly applicable to the Fricke irradiations, where the correct reference depth (dref = 0.6R50 – 0.1 cm) was used. A correction is
therefore required to take account of the difference in water-to-air stopping power ratios between the calibration depth and the Fricke irradiation depth. The difference in depth was small and therefore the uncertainty introduced by this correction factor is also small.
The 0.25% difference between the two G-values obtained for 18 MeV and 22 MeV is consistent with the non-correlated standard uncertainty, estimated to be 0.38 %, and is consistent with the lack of any energy dependence reported by Stucki and Vörös.
Unfortunately, the METAS group has not published data in the literature for the absolute value of G(Fe3+), only its relative variation with energy. Cottens et al (1981) report a value of G(Fe3+) =
1.604 μmol J-1 with a quoted uncertainty of around 0.5 % but for a much higher dose delivered
(~ 220 Gy). This represents a 1 % difference from the value reported here but is agreement at the combined one standard uncertainty level. This level of agreement is perhaps not unexpected considering the different standards used and the very different experimental setups.
Interestingly, the mean value of 1.620 μmol J-1 obtained in the NRC electron beams is also very
close to the G-value obtained by Klassen et al for 20 MV and 30 MV photon beams using the same type of calorimeter (1.623 μmol J-1).
4.3. Summary of G-values obtained at NRC
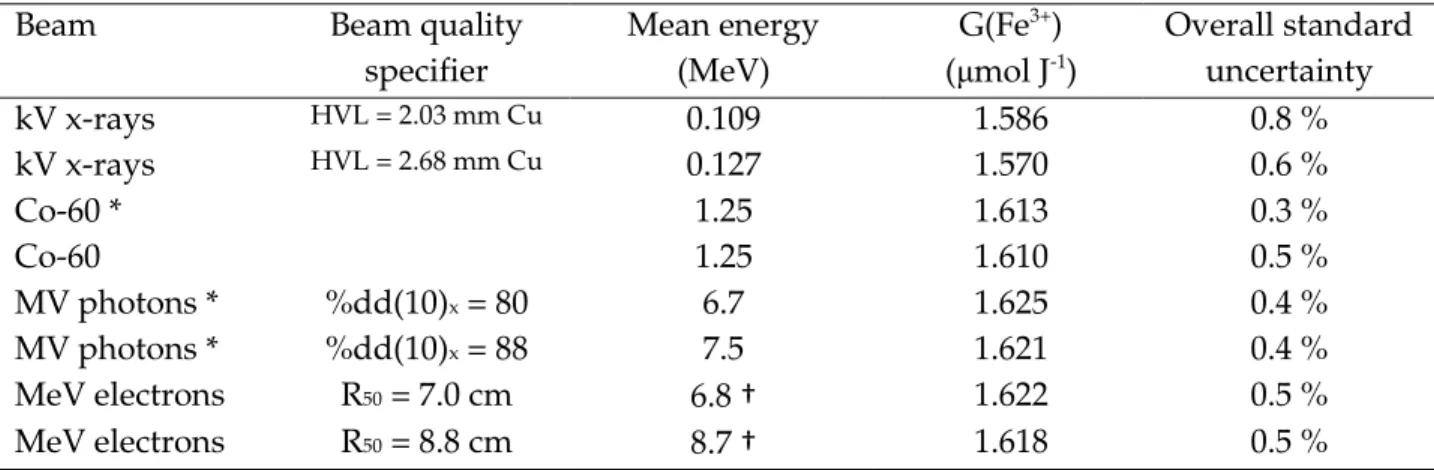
The data summarized in Table 5 is based on two standards – the NRC primary air kerma standard for medium-energy x-rays (free air chamber) and the NRC primary absorbed dose standard for Co-60, MV photon beams and MeV electron beams (sealed water calorimeter). Table 5. Summary of values of G(Fe3+) obtained at NRC. All results are this work, except those
indicated by *, which are from Klassen et al (1999). Beam Beam quality
specifier Mean energy (MeV) G(Fe3+) (μmol J-1) Overall standard uncertainty kV x-rays HVL = 2.03 mm Cu 0.109 1.586 0.8 % kV x-rays HVL = 2.68 mm Cu 0.127 1.570 0.6 % Co-60 * 1.25 1.613 0.3 % Co-60 1.25 1.610 0.5 % MV photons * %dd(10)x = 80 6.7 1.625 0.4 % MV photons * %dd(10)x = 88 7.5 1.621 0.4 % MeV electrons R50 = 7.0 cm 6.8 1.622 0.5 % MeV electrons R50 = 8.8 cm 8.7 1.618 0.5 %
19
It is noticeable that the overall standard uncertainty is smaller for the data reported by Klassen et al, and this is due to a) the simpler method to determine the dose delivered (direct comparison with the primary standard), and b) the reduced effect of contamination when using quartz holders for the Fricke solution. Even so, it is fair to state in summary that the G-value has been determined over a wider range of photon and electron energies with an average standard uncertainty of 0.5 %.
To aid the understanding of the variation in the G-value with beam, the data in Table 5 is recast in terms of the mean electron energy of the electrons interacting with the Fricke solution for each situation, and this is shown in Figure 6.
mean electron energy (keV)
101 102 103 104
G(Fe
3+)
mol
J
-1 1.54 1.56 1.58 1.60 1.62 1.64Figure 6. Variation in G(Fe3+) with mean electron energy at the interaction point (i.e., x-axis is the same as
that of Figure 2). Data for the photon beams is obtained from the relation given by Attix (1991) and the calculations of Anton et al (2013).
The data for the high energy linear accelerator beams would suggest that the linearity shown in Figure 2 extends down to at least 2 MeV. This is encouraging for the work of Cojocaru et al (2011), where measurements were made at electron beam energies of 4 MeV and 8 MeV with the assumption of the energy-independent G-value from Figure 2. A simple linear extrapolation of the kV and Co-60 beam data would suggest an intercept with the flat
high-20
energy response around an average electron energy of 1-1.5 MeV, which, according to Anton et al (2013), would correspond to a megavoltage linac beam of 6 MV or 8 MV. Determination of the G-value at this lower linac energy would therefore seem to be warranted.
5. CONCLUSION
Historical data for the Fricke G-value in photon and electron beams has been reviewed and the results of recent measurements carried by the Ionizing Radiation Standards group at the
National Research Council have been presented. Good repeatability was obtained for G(Fe3+) in
a Co-60 beam compared to the previously–obtained value at NRC. The first data reported in decades have been obtained for kV x-rays beams, and these show a significantly higher value than given in the literature. Based on the Co-60 and kV x-ray results, a value for G(Fe3+) for the
mean energy of Ir-192 was derived to be 1.589 ± 0.009 μmol J-1 and this will be used in the
development of Fricke-based standard of absorbed dose to water for HDR brachytherapy. The G-value for high energy electron beams (> 15 MeV) was measured to be 1.620 ± 0.006 μmol J-1,
which was found to be consistent with literature values and also with NRC data for high-energy photon beams. This electron G-value is required to develop an absorbed dose to water standard for megavoltage (linac) electron beams.
ACKNOWLEDGEMENTS
We would like to acknowledge the invaluable contribution of Gerhard Stucki, formerly of METAS, who demonstrated the feasibility of using the polyethylene bag holders during a 9-month sabbatical at NRC in 2009. Carl Ross, now retired from NRC, was instrumental in championing the idea of using what had become, for many in the radiation metrology
community, an obsolete dosimeter. Hong Shen and Brad Downton, of the IRS group, assisted with the irradiations in kV and Co-60 beams and David Marchington constructed the associated equipment required for irradiations in all beams.
21 References
Almond P, Biggs P J, Coursey B M, Hanson WF, Huq M S, Nath R and Rogers D W O, AAPM’s TG 51 protocol for clinical reference dosimetry of high energy photon and electron beams Report of AAPM Radiation Therapy Committee Task Group No. 51 , Med Phys. 26:1847 (1999)
American Society on Testing and Materials (ASTM), Standard practice for using the Fricke dosimetry system , E1026-13 (PA: West Conshohocken) (2013)
Anton M, Kapsch R-P, Krauss A, von Voigts-Rhetz P, Zink K and McEwen M, Difference in the relative response of the alanine dosimeter to megavoltage x-ray and electron beams , Phys. Med. Biol. 58, 3259 (2013)
Attix, F H, Introduction to Radiological Physics and Radiation Dosimetry , John Wiley and Sons: New York (1991)
Cojocaru C D, Stucki G, McEwen M R, Ross C K, Determination of absorbed dose to water in megavoltage electron beams using a calorimeter-Fricke hybrid system , in International
Symposium on Standards, Applications and Quality Assurance in Medical Radiation Dosimetry IAEA CN-182, Vienna: IAEA 99-111 (2011)
Cottens E, Janssens A, Eggermont G and Jaobs R, Absorbed dose calorimetry with a graphite calorimeter, and G-value determinations for the Fricke dose meter in high-energy electron beams In Proc. Symp. on Biomedical Dosimetry: Physical Aspects,
Instrumentation, Calibration (Vienna: IAEA) pp 189-211 (1981)
Feist H, Determination of the absorbed dose to water for high-energy photons and electrons by total absorption of electrons in ferrous sulphate solution , Phys. Med. Biol. 27 1435-47 (1982)
Fricke H and Hart E J 1966 Chemical dosimetry In Radiation dosimetry, Vol. II Attix, F. H. and Roesch, W. C. (Eds.) (New York: Academic Press)
Goetsch S. J., Attix F. H., Pearson D. W. and Thomadsen B. R., Calibration of 192Ir high-dose-rate afterloading systems”, Med. Phys. 18, 462-467 (1991)
International Commission on Radiation Units (ICRU), Radiation Dosimetry: x-rays and gamma rays with maximum photon energies between 0.6 and 50 MeV . ICRU Report 14 (Bethesda, MD: International Commission on Radiation Units and Measurements) (1969) International Commission on Radiation Units (ICRU), The dosimetry of pulsed radiation. ICRU Report 34 (Bethesda, MD: International Commission on Radiation Units and
22
Kawrakow I, Rogers D W O and Walters B R B, Large efficiency improvements in BEAMnrc using directional bremsstrahlung splitting , Med. Phys. 31, 2883 (2004)
Kawrakow I, Mainegra-Hing E , Rogers D W O, Tessier F, Walters B R B, The EGSnrc Code System: Monte Carlo Simulation of Electron and Photon Transport , NRCC PIRS-701 (2013).
http://www.nrc-cnrc.gc.ca/eng/solutions/advisory/egsnrc_index.html
Klassen N V, Shortt K R, Seuntjens J and Ross C K 1999 Fricke dosimetry: the difference between G (Fe3+) for 60Co γ-rays and high-energy x-rays Phys. Med. Biol. 44 1609-24 Mainegra-Hing, E, Efficient Monte Carlo simulations in kilovoltage x-ray beams , Thesis (Ph.D.), Publication Number: AAT NR81561, Carleton University (Canada), 2011
Mainegra-Hing E, Rogers D W O, On the accuracy of techniques for obtaining the calibration coefficient NK of 192Ir HDR brachytherapy sources , Med. Phys. 33, 3340-3347 (2006)
McEwen M R and Ross C K, Direct calibration of ion chambers in linac electron beams , in Proceedings of Absorbed Dose and Air Kerma Primary Standards Workshop, Paris, France, 2007, LNE-LNHB, Saclay, (2007)
McEwen M R and DuSautoy A R, Primary standards of absorbed dose for electron beams , Metrologia 46 S59 (2009)
McEwen M R and Ross C K, AAPM Summer School (2009), Fricke and alanine dosimery systems , Medical Physics Publishing, Wisconsin (2009)
Olszanski A, Klassen N V, Ross C K and Shortt K R The IRS Fricke dosimetry system PIRS-0815 (National Research Council, Ottawa) (2002) Available on request from NRCC
Rogers D W O, Walters B R B, and Kawrakow I, BEAMnrc users manual . NRC Report PIRS-509 (2013). http://www.nrc-cnrc.gc.ca/eng/solutions/advisory/beam_index.html
Ross C K, Seuntjens J P, Klassen N V and Shortt K R, The NRC Sealed Water Calorimeter: Correction Factors and Performance (Proc. Workshop on Recent Advances in Calorimetric Absorbed Dose Standards, NPL Report CIRM 42) (National Physical Laboratory, Teddington, UK, 2000)
Stucki G and Vörös S, Experimental kQ,Q0 electron beam quality correction factors for the types NACP02 and PTW34001 plane-parallel chambers , in Proceedings of Absorbed Dose and Air Kerma Primary Standards Workshop, Paris, France, 2007, LNE-LNHB, Saclay, (2007)
Vörös S and Stucki G, Simulation Monte Carlo pour la réalisation d'un étalon primaire de la dose absorbée dans l'eau pour des faisceaux d'électrons , Radioprotection 42 565-75 (2007) Vörös S, Anton M and Boillat B, Relative response of alanine dosemeters for high-energy electrons determined using a Fricke primary standard , Phys. Med. Biol. 57 1413–1432 (2012)