Affordable Housing, Disasters, and Social Equity:
LIHTC as a Tool for Preparedness and Recovery
The MIT Faculty has made this article openly available. Please share
how this access benefits you. Your story matters.
Citation Mehta, Aditi et al. "Affordable Housing, Disasters, and Social Equity: LIHTC as a Tool for Preparedness and Recovery." Journal of the American Planning Association 86, 1 (January 2020): 75-88 © 2019 American Planning Association
As Published http://dx.doi.org/10.1080/01944363.2019.1667261
Publisher Informa UK Limited
Version Author's final manuscript
Citable link https://hdl.handle.net/1721.1/128253
Terms of Use Creative Commons Attribution-Noncommercial-Share Alike
Affordable Housing, Disasters, and Social Equity: LIHTC as a Tool for Preparedness and Recovery
About the Authors:
Aditi Mehta ([email protected]) is an Assistant Professor of Urban Studies at the University of Toronto. Mark Brennan ([email protected]) is a Doctoral Candidate at the Massachusetts Institute of Technology.
Abstract
Problem, Research Strategy, and Findings: The Low-Income Housing Tax Credit (LIHTC) is the most common financing mechanism for the production of subsidized housing in America. We investigate how and to what extent states are currently using LIHTC to prepare for and recover from disasters. We systematically code guidelines in the 2017 LIHTC qualified allocation plans from 53 states and territories to identify disaster-related provisions. Twenty-four states and territories include provisions for
preparedness or recovery in their allocation plans, of which 13 include only preparedness provisions, three include only recovery provisions, and eight include both types. Preparedness provisions address project design and siting, whereas recovery provisions direct credits to disaster-affected areas or the replacement of damaged units. Using t-tests, we compare three sets of states—those without any disaster-related provisions, those with either preparedness or recovery provisions, and those with both types of
provisions— across measures of housing cost, demographic composition, disaster exposure, and political ideology. States with higher homeownership rates, lower home values, and lower rents are more likely than other states to have either or both types of provisions. Future research should investigate why this trend is the case to better inform affordable housing policy.
Takeaway for Practice: State governments could mitigate disaster-related hazards and help speed recovery by including locally-relevant preparedness and recovery provisions in their LIHTC allocation plans. These provisions could incentivize resilient
construction, weigh the social costs and benefits of LIHTC construction in floodplains, or waive program rules to address post-disaster housing shortages.
Introduction
Evidence suggests that the current structure of disaster assistance in the United States is associated with wide wealth
inequalities along the lines of race, education, and homeownership (Howell and Elliott 2018; Brand and Seidman 2012). Low- and
moderate-income renters are often most affected by disasters, yet homeowners receive the majority of federal disaster assistance (Lee
and Van Zandt, 2019; Howell and Elliott 2018; Government Accountability Office 2010). Increasing vulnerability to disaster and
rising wealth inequality are thus linked by pre- and post-disaster housing policies. We analyze a program designed to assist
low-income renters that should become a more important part of building resilient cities.
The Low-Income Housing Tax Credit (LIHTC) has been the most common financing mechanism for the production and
preservation of subsidized multifamily rental buildings in the U.S. over the past three decades (McClure, 2006; 2008). Yet, there is
little research on the potential role of the LIHTC program in improving the resiliency of affordable housing in communities vulnerable
to disaster or for helping low-income renters recover after disaster (but see Gotham, 2014; 2015; 2016 regarding Hurricane Katrina).
The process of rehousing is particularly challenging for low-income renters, who often receive less recovery assistance than
homeowners and who are frequently priced out of their former neighborhoods because of a lack of reinstated affordable housing
opportunities (Lee and Van Zandt, 2019; Burby, Steinberg, & Basolo, 2003).
Reestablishing a permanent home is fundamental to disaster survivors’ ability to resume everyday activities, such as work and school, and delays in accessing permanent housing hinder broader community-wide recovery (Peacock, Dash, and Zhang 2007).
disaster resilience and recovery. We ask four sets of questions about mitigation, preparedness, and recovery in the context of federal
and state housing policy. First, how and to what extent do states and territories use the LIHTC program to assist with hazard
mitigation and disaster preparedness? Second, how and to what extent do states and territories use the LIHTC program to facilitate
rebuilding and recovery after disaster? Third, we analyze the relationships between LIHTC plan provisions and LIHTC construction
before and after disasters. Fourth, what differentiates states that do and do not incorporate disaster mitigation, preparedness, or
recovery provisions into their qualified allocation plans (QAPs), the state documents that outline the criteria by which states distribute
these tax credits among developers?
To answer these questions, we systematically code the 2017-2018 allocation plans for 49 states, the District of Columbia, and
three territories. We find that only 24 states and territories include provisions for mitigation, preparedness, or recovery in the
allocation plans, of which 13 include only mitigation or preparedness provisions, three include only recovery provisions, and eight
include both types of provisions. Next, we find that in states with disaster-related provisions, LIHTC units are more likely to be built
in counties after a disaster when compared to states with no disaster-related provisions. Finally, we use t-tests to compare the
characteristics of states with and without disaster-related allocation plan provisions. States with higher rates of homeownership and
lower housing costs are more likely than other states to have disaster-related provisions in their allocation plans, while states with
more LIHTC units overall and more LIHTC units per capita are less likely than other states to include disaster-related provisions. The
unique conditions, risks, and needs into their LIHTC allocation plans. Regardless of Congressional action, states independently should
incorporate them.
Housing and Disasters
Hurricanes Harvey, Irma, and Maria along with the California wildfires destroyed over 420,000 homes across the United States
in 2017 and caused an estimated $300 billion in damages (NOAA 2018). More than 4.7 million people registered for individual
assistance from the Federal Emergency Management Agency (FEMA), which gave over $2 billion in grants to survivors, while the
National Flood Insurance Program paid more than $6 billion on over 130,000 flood insurance claims, and the Small Business
Administration loaned more than $7 billion to households for recovery. Congress allocated $35 billion in recovery funds to affected
states and territories through the Community Development Block Grant—Disaster Recovery program. Altogether, 2017 federal
disaster spending is estimated at $130 billion (Lingle, Kousky, and Shabman 2018).
Thirty-nine counties in Texas were declared major disaster areas as a result of Hurricane Harvey, encompassing nearly 90,000
LIHTC units (see Technical Appendix for further discussion LIHTC siting and civil rights in Texas). The extent to which future
LIHTC construction will create environmentally and socially supportive homes for low-income households depends on what states
like Texas do with their LIHTC allocation plans.
Scholarly literature about housing and disasters focuses on social vulnerability in mitigation, preparedness, response, and
recovery providing near-term temporary housing, and long-term housing construction (Levine, Esnard, & Sapat 2007; Peacock, Van
Shirley 2003). Lee and Van Zandt (2019) reviewed studies of disasters’ impacts on renters as compared to owners by disaster phase
and disaster-related housing programs.i They note that renters and owners as groups differ from each other in household size and
composition, socioeconomic characteristics, and in the stability of the physical structures in which they live. These differences shape
the capacity of owners and renters to prepare for and recover from disasters, exaggerating the effects of previous vulnerabilities.
For example, low-income renters are more likely than homeowners to reside in older buildings constructed to meet
less-rigorous codes with deferred maintenance situated in higher-risk areas (Bolin and Stanford 1998; Girard and Peacock 1997). Housing
recovery is an uneven process for different population groups, in which non-white, lower-income areas tend to sustain more damage
and recover more slowly than higher-income areas (Peacock, Van Zandt, Zhang, & Highfield 2015; Howell and Elliott 2018; Lee and
Van Zandt 2019). Attention to housing in mitigation planning can thus minimize physical and social vulnerability and advance racial
equity (Peacock, Van Zandt, Zhang, & Highfield 2015; Van Zandt, Peacock, et al., 2012).
Exclusionary patterns in the post-disaster recovery process reinforce historic racial and economic disparities for low-income
renter communities (Brand and Seidman, 2012; Bates, 2006; Ellen, Steil, and De la Roca, 2016). After past disasters, wealthy
homeowner associations and municipalities have blocked temporary shelter options such as manufactured housing units from being
placed in their neighborhoods, relegating those needing temporary housing to isolated locations (Duit, 2014; Steil and Delgado 2019).
Policies at any level that prioritize aid for homeowners to rebuild their homes contribute to substantial gaps in levels of assistance
between income and racial groups with different rates of homeownership (Comerio, 2014; Howell and Elliott, 2018; Peacock, Dash,
Constructing affordable housing takes longer after disasters than repairing high-income housing, and may not reach
pre-disaster levels, deepening poverty in low-income neighborhoods (Fothergill and Peek, 2004; Lee, 2018; Comerio, 2014; Howell and
Elliott, 2018; Spader and Turnham 2014; Zhang and Peacock, 2010; Haupt, 2015). Low-income renters often have difficulty finding
permanent housing near their original home after disasters because rents increase, at least in the short-term (Vigdor 2008). In the
long-term, newly rebuilt permanent housing often exceeds low-income disaster-survivors’ ability to pay, because of the increased
costs of labor and the requirements of new building codes, leaving low-income renters unable to return (Fothergill and Peek, 2004;
Bolin, 1993).
A Review of Federal Disaster Programs
Since the creation of FEMA in 1979, the emergency management field in the United States has grown and professionalized,
involving close collaboration between federal, state, territorial, tribal, and local agencies and focusing on the four phases of emergency
management: mitigation (reducing the likelihood or impact of a disaster); preparedness (facilitating response and recovery); response
(minimizing damage to people and property during a disaster); and recovery (returning to a (more) sustainable state after a disaster).
The current emergency management structure in the United States relies on a model of cooperative federalism and the most recent
strategic plan from FEMA calls for a system that is federally supported, state managed, and locally executed (Federal Emergency
Management Agency, 2018).
At the mitigation stage, the most relevant federal programs are the Hazard Mitigation Assistance Program and the Community
to FEMA for assistance for projects that substantially reduce the risk of future disaster damage, including property acquisition and
demolition or relocation, structure elevation, structural retrofitting, floodproofing, flood risk reduction, and wildfire mitigation (42
U.S.C. § 5170c(b)(2)(B)(i); 44 C.F.R. § 206.434(d)). Through the Community Rating Standards Program, localities can adopt
floodplain and erosion management policies and other interventions to reduce resident property owners’ premiums under the National
Flood Insurance Program (42 U.S.C. § 4022(b)(1)).
After disaster strikes, a state can request and the President can authorize federal housing assistance to respond to and recover from the
event. The Robert T. Stafford Relief and Emergency Assistance Act authorizes FEMA to provide financial assistance to rent alternate
housing temporarily (42 U.S.C. § 5174(c)(1)(A)) or to repair or replace owner-occupied private residences (42 U.S.C. § 5174(c)(2-3)).
This financial assistance for temporary housing is subject to the cap on individual assistance, $33,000 as of 2018.
The Stafford Act also authorizes direct assistance, in the form of temporary housing units, acquired by the federal government
through purchase or lease, and provided directly to households “who, because of a lack of available housing resources, would be unable to make use of [financial] assistance” ((42 U.S.C. § 5174(c)(1)(B)(i)). Like financial assistance, this temporary direct assistance is limited to 18 months after the disaster (unless extended) and can take the form of previously vacant housing units that
FEMA has leased and repaired; or manufactured housing units or travel trailers, either on a property owner’s land or in shared
commercial or FEMA-created group housing sites. In addition to these federal programs, some states have designed their own
disaster-related voucher, repair, and mortgage assistance programs.
If Congress appropriates funding to the Community Development Block Grant Disaster Recovery program, this is usually the
largest source for state-led housing programs, but each state creates its own set of housing programs, consistent with HUD guidelines.
In short, there is a mix of federal and state policies providing financial or direct assistance, but there is no program specifically
targeting the permanent housing needs of low-income renters. The LIHTC program has the potential to fill this crucial gap.
How Does LIHTC Work?
Congress created the LIHTC program in 1986 to leverage federal tax credits for private investment in the construction of
affordable housing. LIHTC has since become the primary federal tool to encourage the development of multi-family housing for low
and moderate-income households (McClure, 2008). The Department of the Treasury transfers approximately $8.5 billion worth of tax
credits to states and territories every year (see Technical Appendix). Each state or territory develops an allocation plan that outlines
the criteria by which the state will distribute the credits among projects proposed by developers (Ellen & Horn, 2018).
State, territorial, or municipal housing finance agencies award the tax credits to affordable housing developers through a
competitive application process. The program allows developers to receive federal income tax credits for constructing or renovating
rental properties for low-income households and operating the affordable housing development under the LIHTC guidelines for a
certain compliance period, originally 15, and now 30 years (Freedman & McGavock, 2015). These developers partner with investors
who provide equity for the affordable housing development and in exchange, receive a tax credit annually over ten years. The
partnership with equity investors through the tax credit program significantly reduces a project’s debt-service costs and allows the projects to operate with below-market rental income.
There are two types of credits: 9 percent and 4 percent credits. The 9 percent credits are usually applied toward new construction and rehabilitation projects that are not also financed with tax-exempt bonds, and each year (for ten years), the tax credits equal 9 percent of the project’s cost of construction, also known as the qualified basis. The 4 percent credit is usually applied towards the acquisition of an existing project or a new construction and rehabilitation project that is also financed with state or local tax-exempt bonds, and each year (for ten years), the tax credits equals 4 percent of the project’s cost of construction.
Federal law sets out a framework for the LIHTC program, requiring allocation plans to give preference to projects that serve
the lowest income tenants, that serve these tenants for the longest period of time, and that are located in qualified census tracts in
which the project contributes to a concerted community revitalization plan (26 U.S.C. § 42(m)(1)(B)(ii)).ii Federal law requires that
the allocation plans include selection criteria regarding project location, local housing needs, and capacity to house individuals with
special needs, among others (26 U.S.C. § 42(m)(1)(C)). The federal statute authorizing LIHTC does not, however, include any
requirements related to disaster mitigation, preparedness, response, or recovery.
Within this federal framework, state, territorial, or municipal housing finance agencies manage the developer bidding process
and allocate the tax credits to developers. Through the plans, each housing finance agency establishes its own priorities, focusing on
their unique affordable housing needs. Allocation plan criteria may be in the form of desired project characteristics for which points
are allocated to the project application, undesired characteristics for which points are subtracted, or set requirements for any eligible
project. A developer increases a proposal’s competitiveness by demonstrating compliance with as many provisions as possible. Housing finance agencies update their allocation plans annually or biennially (Ellen & Horn, 2018).
LIHTC and Disasters
Scholars have studied multiple dimensions of the LIHTC program, such as its consequences for fair housing (powell 2008;
Dawkins 2013; Ellen & Horn, 2018; Ellen and Steil, 2019), for poverty concentration (Freeman 2003; McClure 2008; Ellen, Horn &
O’Regan 2016), mixed income housing (McClure 2006; Vale & Shamsuddin 2017), political participation (Gay 2014), and
neighborhood revitalization (Ellen, Schwartz, Voicu, & Schill 2007; Deng 2011; Diamond & McQuade 2016). The potential role of
the LIHTC program in disaster recovery, however, has received comparatively little scholarly attention.
In practice, some federal agencies have recognized LIHTC as a tool for disaster recovery. For example, the Internal Revenue
Service (IRS) temporarily suspends some of the statutory LIHTC requirements for affected buildings after federal disaster
declarations.iii Most significantly, the IRS temporarily suspends certain income limitations for individuals displaced by a major
disaster, allowing owners of LIHTC buildings to rent units to households even if their income does not fit within the LIHTC
requirements.
Congress has twice authorized additional LIHTC credits to facilitate long-term housing recovery after disasters in affected
states, through the Gulf Opportunity Zone (GO Zone) Act of 2005 and the Heartland Disaster Tax Relief Act of 2008.iv Within three
years of the devastation wrought by Hurricanes Katrina, Rita, and Wilma on the Gulf Coast, GO Zone LIHTC credits financed the
rehabilitation or replacement of 17 percent of rental housing units that experienced major and severe damage in Louisiana and 45
rebuilding rental housing in the Gulf Coast, scholars have criticized the initiative for benefitting less damaged parts of the region
instead of the most impacted areas, and for naively depending on local implementation to reduce socioeconomic inequalities (Gotham,
2014).
States often allocate some portion of Congressional appropriations for the Community Development Block Grant Disaster
Recovery program to catalyze LIHTC developments. However, many disasters do not receive Congressional appropriations and, even
when they do, appropriation can take months or years. In this article, we analyze how all states and territories are using the LIHTC
program on a consistent basis through the guidelines shaping their regular annual allocations and analyzing whether these provisions
have any relationship to the siting of LIHTC units in relation to disaster locations.
Variation in the inclusion of disaster-related provisions in state allocation plans raises the question: what factors affect state
decisions to include these provisions? State policy variation in this intersection of housing and disaster recovery is understudied. To
the extent that disaster mitigation, preparedness, and recovery policies may share some similarities to environmental policies, the
literature on state variation in environmental policy suggests higher levels of state prosperity (Lester, 1995; Matisoff, 2008), more
liberal citizen political ideology (Ringquist & Garand, 1999; Matisoff, 2008), and greater exposure to environmental harms (Lester,
1995; Matisoff, 2008; Bergquist & Warshaw, 2019) are all associated with the adoption of more robust environmental protections.
Wiener and Koontz (2010) find that citizen ideology is a predictor of state environmental policies at either end of the ideological
spectrum, but has a weaker relationship to policy adoption in the middle of the ideological spectrum, where they find economic
temperatures, reinforcing findings that state environmental policy innovation takes place in response to both citizens’ demands and environmental conditions (Matisoff, 2008). In housing policy, citizen political ideology (Kahn, 2011) as well as levels of
homeownership and housing cost measures are likely to influence policy adoption, given the significance of “home voters” in shaping politics (Fischel, 2009; Dehring, Depken, & Ward, 2008). For instance, Gay (2014) has found that partisan loyalty shapes state-level
housing investment in the LIHTC program. We draw on this theoretical research to better understand variation across disaster-related
provisions in qualified allocation plans.
Methods: Qualitative Review of Qualified Allocation Plans
To identify how states have used their LIHTC plans for disaster preparedness and recovery, we review and code all available
2018 and 2017 allocation plans.v Our sample consists of allocation plans from all 50 states except Alaska,vi as well as plans from the
District of Columbia, Puerto Rico, the Virgin Islands, and the Northern Mariana Islands. We searched the allocation plans for the
following terms: adaptation, climate, cyclone, disaster, emergency, fire, flood, hurricane, mitigation, recovery, resilience, response,
snow, storm, sustainability, and tornado. After identifying relevant allocation plan provisions, we categorized them as related either to
mitigation and preparedness or to recovery. We then organized these mitigation, preparedness, and recovery provisions into
Findings: Types of Mitigation, Preparedness, and Recovery Provisions in Qualified Allocation Plans
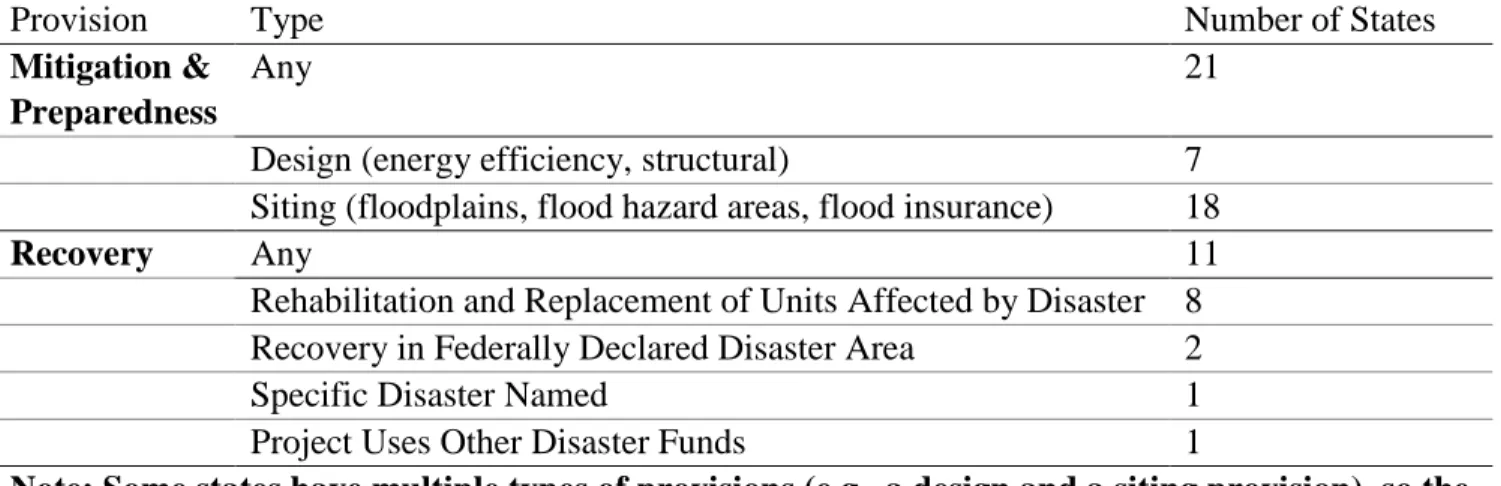
We categorize allocation plan provisions related to design and siting as disaster mitigation or preparedness provisions. We
categorize four other types of provisions as recovery: 1) rehabilitation and replacement of units affected by disaster; 2) recovery in a
federally declared disaster area; 3) recovery from a specific named disaster; 4) support for projects that use other disaster recovery
funds.
Insert Table 2 Here
Overall, we find that surprisingly few states and territories include disaster-related provisions in their LIHTC allocation plans. As
Tables 2 and 3 show, only 24 states and territories include disaster-related provisions in the allocation plans, of which eight include
both types of provisions, 13 include only mitigation or preparedness provisions, and three include only recovery provisions. Table 2
shows the number of states that included each type of provision in their allocation plans and Table 3 identifies which states include
which provisions. The following subsections explain each type of provision and provide illustrative examples.
Insert Table 3 Here Siting
Siting provisions were the primary mitigation strategy found in the allocation plans. As outlined in Table 2, siting provisions
range from requiring flood insurance to prohibiting projects from being located in flood plains. For instance, the Tennessee,
insurance program if the property is located in one.viii The Arizona and Wyoming plans go further to prohibit any developments in a
100-year flood plain.ix
Some allocation plans emphasize that projects should adhere to Executive Order 11988 (Floodplain Management, 1977) and
Executive Order 11990 (Protection of Wetlands, 1977), which require agencies to avoid floodplain development and limit potential
damage if it cannot be avoided (see Technical Appendix).
Design
These provisions encourage or require projects to incorporate building design elements that reduce vulnerability to natural
disasters common in that state or territory. For example, Alabama awards four out of 98 points for including a storm shelter in the
design (p. 3)x and Louisiana requires hurricane tie-down straps at each bearing location of roof trusses or joists (p. 85).xi These
provisions are examples of how allocation plans can ensure that new buildings include structural elements to protect residents during
disaster.
Rehabilitation and Replacement of Units Affected by Disaster
Eight state plans include provisions that encourage the use of LIHTC for the rehabilitation and replacement of units affected by
a natural disaster. For example, the Indiana plan awards an additional two out of 143 possible points if the development rehabilitates a
vacant structure that was affected by disaster within the last five years (p. 5) and another four points if it “assists in the stabilization of a neighborhood” by “redeveloping property that has been foreclosed, abandoned, [or] affected by a disaster (p. 58).”xii The Kansas plan “reserves the right to waive application deadlines, and state imposed program rules and requirements, including the ranking of
applications under the selection criteria, for the purpose of responding to the housing needs created by natural disasters” (p. 22).xiii
New Mexico, North Dakota, Pennsylvania, Utah, and Vermont include similar provisions in their plans, allowing flexibility for states
to easily target the LIHTC program to disaster recovery.
Recovery in Federally Declared Disaster Areas
Two states discussed recovery in federally declared disaster areas in their plans: Alabama and Nebraska. Alabama awards 10
out of 98 possible points to a project located in a county with a federally declared disaster (p. 8)xiv and the Nebraska plan gives preference
to projects in a federally declared disaster area, if they are part of the state’s workforce development and housing support system.xv Specific Disaster Named
This category refers to provisions that reference/prioritize a specific, named disaster only. Tennessee’s is the only state plan
that explicitly focused on a non-federally declared disaster. In 2016, fires destroyed many affordable housing units in the state’s
Servier County, and the Tennessee housing finance agency chose to designate part of the state’s LIHTC allocation specifically to
address this housing need.xvi
Project Uses other Disaster Funds
This category refers to a provision that awards points for combining different sources of disaster recovery funds. Alabama
awards 13 out of 98 points for use of Community Development Block Grant Disaster Funds (p. 6). This provision allows states to
maximize impact by combining sources of funding and to prioritize rebuilding projects that use fewer tax credits or that create units
Methods: Statistical Analyses of State Policy Adoption
Using three sets of states—1) those with no disaster-related provisions in their allocation plans, 2) those with either mitigation
and preparedness or recovery provisions, and 3) those with both sets of provisions—we use standard two-sample two-tailed t-tests to
compare the sets.
To evaluate the relationship between allocation plan provisions and state socio-economic characteristics, we include measures
of state median income, share of the population below the poverty line, and state demographic composition, all from the 2013-2017
five-year American Community Survey (ACS). We also include a measure of state gross domestic product per capita from the Bureau
of Economic Analysis. To evaluate the effects of housing characteristics, we include measures of the share of housing units that are
owner-occupied, in single-family structures, and vacant, as well as median rents and home values (also all from the 2013-2017
five-year ACS). We calculate the total number of LIHTC units allocated per state between 1986 and 2015, and between 2013 and 2015,
from the Department of Housing and Urban Development’s National Low-Income Housing Tax Credit Database.
To assess the effect of citizen ideology, we include a measure of the mean ideology for every state, developed by Tausanovitch
and Warshaw (2013) from the 2008 through 2014 Cooperative Congressional Election Study. A higher positive score indicates a
state’s residents on average hold more conservative views, while a negative score suggests residents hold more liberal views. We also include Berry et al.’s (1998) updated and widely used measures of citizen ideology, using interest-group ratings for a state’s members of Congress to infer the ideological orientation of the state electorate.
To estimate the effect of exposure to disaster risk, we use four state-level measures of disaster experience. First, we use
publicly available data from FEMA that lists every federal disaster declaration for each state from 1953 to 2018, and we calculate the
number of declarations that each state has had between 1986 (when the LIHTC program was created) and 2017, and also from 2013 to
2017 (the five years immediately preceding the drafting of the allocation plans that we analyzed). Second, we focus on severe
disasters, defined as those that resulted in more than 10 deaths, and calculate the number of county disaster declarations that each state
has had for these severe disasters, consistent with Boustan et al. (2017). This second measure differs from the first not only in limiting
its count to disasters that resulted in more than ten deaths, but also in that it weighs more heavily a disaster that affects more counties
in a state than one that affects fewer, which gives an indication of the severity of the event. In other words, if five counties in New
Jersey receive a federal disaster declaration for an event and two counties in New York receive a declaration for an event, the second
measure would note that there were five declarations in New Jersey and two declarations in New York, while the first measure would
note that New Jersey and New York each received a federal disaster declaration for an event.
Third, we use data from FEMA that describes the total value of housing assistance that the agency provides to a state between
2013 and 2017. Finally, we use data regarding the number of FEMA manufactured housing units provided for every disaster from
2013 to 2016. FEMA typically uses manufactured housing units when other housing options have been exhausted, thus providing a measure of
the extent to which an event damages housing stock and to which renters may be vulnerable to displacement. (see Technical Appendix for more
The null hypothesis in a two-sample t-test is that the underlying population means are the same. Using the social, housing,
disaster, and ideology measures defined above, we test the null hypothesis that (1) there is no difference between states with any
disaster related provisions and those without them, and (2) between the smaller number of states with both types of disaster related
provisions and those without any provisions. We assume unequal population variances.
Findings: Comparing States with and without Preparedness and/or Recovery Provisions
As the findings in Table 3 indicate, states are more likely to allocate LIHTC units to counties after a disaster than they were
before the disaster. Further, in states with disaster-related plan provisions, LIHTC units are substantially more likely to be allocated to
counties after a disaster than in states without these provisions. The findings in Table 3 also demonstrate that state adoption of
disaster preparedness and recovery provisions varies significantly. What can explain this variation?
Only two general types of state characteristics are significantly different between states with no allocation plan provisions and
both 1) those states with any disaster-related provision and 2) those states with both disaster-related provisions: first, housing
characteristics, specifically homeownership rates and housing costs; and second, the number of LIHTC units built between 2013 and
2015.
States with disaster-related provisions have homeownership rates that are on average more than three percentage points higher
than those states without provisions. States with disaster-related provisions have median rents that are $150 to $170 lower than those
states without provisions. States with disaster related-provisions also have fewer LIHTC units overall and fewer LIHTC units per
million residents, as illustrated by Table 4 and Figure 1.
Those states without disaster-related plan provisions allocated 60 percent more LIHTC units per million residents (703) than
those states with any disaster-related provisions (432), between 2013 and 2015. States without disaster-related allocation plan
provisions also had higher shares of renters and higher housing costs than those states with provisions.
Insert Figure 1 Here
One might expect disaster exposure to be correlated with the adoption of disaster-related allocation plan provisions. Somewhat
surprisingly, measures of disaster exposure are at best only marginally significant at the 0.10 confidence level in differentiating states
with and without disaster-related provisions. Although the differences are not significant at the 0.05 percent confidence level, states
with a disaster-related provision did have more federal disaster declarations and more counties with severe disasters over the past
decade, and over the time period since LIHTC was created, than other states. States with a disaster-related provision had, on average,
provisions had only seven counties with disaster declarations per million people. Perhaps counterintuitively, states with both types of
disaster-related provisions received substantially less FEMA housing assistance between 2013 and 2017 than states with no
provisions, despite having more federally declared disasters in that time period (though they also had fewer counties with severe
disasters). These findings indicate a need for further research on the interaction of disaster exposure and federal aid, together with
housing market characteristics to better understand policy making with regard to disaster housing.
Planning for Future Disasters through LIHTC Qualified Allocation Plans
The majority of states and territories do not include mitigation, preparedness, or recovery provisions in their allocation plans
for subsidized units. However, our research identifies a number provisions that state and territorial housing finance agencies could
include in their allocation plans to encourage resilient siting and design as well as facilitate equitable rebuilding. For instance, all
states and territories could use their allocation plans to:
- Incentivize resilient construction by awarding points for design features that mitigate relevant local hazards (such as fire-resistant landscaping, tornado shelters, or hurricane straps);
- Weigh the social costs and benefits of building in floodplains, discouraging LIHTC construction in 100-year floodplain as appropriatexvii, to the extent that state building code provisions do not already do so; and
Appropriate, state-specific siting and design provisions will prevent damage to housing during disasters as well as foster more
cost- and time-efficient housing recovery for low-income renters post-disaster. Developers’ compliance with these provisions will
ultimately increase the long-term value of their multifamily properties as well.
Analysis of the allocation of LIHTC units reveals that these subsidized homes are more likely to be allocated to counties
post-disaster in those states with post-disaster-related allocation plan provisions than they are in states without the provisions. Comparison of
the characteristics of states that do and do not include disaster-related provision in their allocation plans reveals that disaster-related
provisions are more common in states with lower housing costs, higher homeownership rates, and fewer LIHTC units. This means that
states with the most LIHTC units and the highest shares of renters do not include strategic provisions that could enhance the durability
and resilience of their substantial stock of affordable rental housing. Further, states with more costly housing markets are
under-utilizing the opportunity to tailor the nation’s largest affordable housing program to local hazard mitigation and disaster recovery
needs. The lack of inclusion of disaster-related allocation plan provisions by these high-LIHTC, high-cost states has the potential to
worsen economic inequalities post- disaster by making affordable rental housing less-resilient and delaying or discouraging the
creation of permanent low-income rental housing accessible.
To remedy these potentially inequality-widening structures of state allocation plans for LIHTC funding, Congress could amend
the LIHTC statute to require states and territories to include disaster mitigation, preparedness, response, and recovery provisions in
their allocation plans. State and local initiatives are equally important. State housing finance agencies can provide guidance through
housing. Local planners, regional flood-plain managers, and other land-use practitioners can simultaneously act to address affordable
housing needs, to mitigate local hazards, and to facilitate post-disaster reconstruction through appropriate land use policies and
building codes. Local planners and land-use practitioners can also disseminate essential disaster resilience information by providing
technical assistance and by building capacity within community development corporations to leverage LIHTC to rebuild post-disaster
and implement effective mitigation, preparedness, and recovery strategies (American Planning Association, 2014).
If the funding allocation process for LIHTC units includes more provisions for disaster mitigation and preparedness, these
plans can decrease the extent of future damage to LIHTC developments and reduce the vulnerability of subsidized renters, saving
human lives and public resources in the long-run. As importantly, if future allocation plans include provisions for disaster recovery,
then LIHTC allocations may be useful for bringing new affordable units into service quickly after future disasters. These simple
allocation plan provisions have the potential to reduce the disproportionate effects of disasters that burden and displace low-income
Table 1: A Review of Federal Disaster Housing Programs Mitigation & Preparedness
FEMA
Hazard Mitigation Assistance
Hazard Mitigation Grant Program, Flood Mitigation Assistance, Pre-Disaster Mitigation Assistance FEMA assistance to states, tribes, territories, and localities for projects that reduce the risk of future disaster damage. Hazard Mitigation Assistance includes the Hazard Mitigation Grant Program, Flood Mitigation Assistance, and Pre-Disaster Mitigation Assistance (currently in the process of being replaced by the Building Resilient
Infrastructure and Communities program pursuant to statutory changes in the Disaster Recovery Reform Act of 2018 that sets aside 6% of annual disaster obligations from the Disaster Relief Fund to invest in pre-disaster mitigation.
Community Rating Standard Program
Reduction in homeowners’ National Flood Insurance Program premiums for localities adopting mitigation practices.
Department of Housing and Urban Development
Community Development Block Grant (Disaster Recovery)
State and local mitigation programs offer a range of assistance (such as housing elevation).
Response & Recovery FEMA
Public Assistance to State, Tribes, Territories, and Localities
Sheltering and Temporary Essential Power Program
FEMA provides assistance to states to aid homeowners with limited, temporary repairs to make a home safe, clean and secure for emergency sheltering.
Assistance to Households and Individuals Mass Care/Emergency Assistance
Transitional Sheltering Assistance
FEMA provides short-term assistance for displaced survivors who are in order to help the transition from emergency shelters to temporary or permanent housing solutions. Rapid Temporary Repair
FEMA provides temporary roofing to prevent additional damage to homes until homeowners can make permanent repairs.
Financial Assistance
Rental Assistance may be used to temporarily rent a house, apartment, manufactured home, recreational vehicle, or other dwelling while the household is repairing or otherwise transitioning to permanent housing.
Home Repair or Replacement Assistance
Grants to homeowners to permanently repair their homes to a safe and sanitary condition, or to help replace homes destroyed by disaster.
Direct Assistance
Multifamily Lease & Repair Program
FEMA repairs and then leases previously vacant housing units, temporarily placing survivors in the units.
Temporary Housing Units Program
FEMA provides manufactured homes or travel trailers to use as temporary housing while permanent housing is repaired or obtained.
Direct Lease Program
FEMA leases existing residential properties and provides them to eligible applicants to use as temporary housing while permanent housing is repaired or obtained.
Permanent or Semi-Permanent Repair or Construction Program
Under very limited conditions where no alternative housing resources are available and other forms of assistance are not feasible or cost-effective, generally in states or territories outside the continental United States, FEMA may directly contract for the repair or replacement of homes.
HUD
Community Development Block Grant (Disaster Recovery)
State and local recovery programs offer a range of recovery assistance (such as rental assistance).
SBA
Disaster Loan Program
SBA provides low-interest and long-term loan to cover disaster related expenses to eligible homeowner or renter applicants to cover personal and/or real property.
Table 2: Types of Mitigation, Preparedness, and Recovery Provisions in Low Income Housing Tax Credit Qualified Allocation Plans
Provision Type Number of States
Mitigation & Preparedness
Any 21
Design (energy efficiency, structural) 7
Siting (floodplains, flood hazard areas, flood insurance) 18
Recovery Any 11
Rehabilitation and Replacement of Units Affected by Disaster 8
Recovery in Federally Declared Disaster Area 2
Specific Disaster Named 1
Project Uses Other Disaster Funds 1
Note: Some states have multiple types of provisions (e.g., a design and a siting provision), so the numbers of states do not add up within each sub-section of the table.
Figure 1: Understanding Differences in LIHTC Allocations and Qualified Allocation Plan (QAP) Provisions ● ● ● ● ● ● ● ● ● ● ● ● ● ● ● ● ● ● ● ● ● ● ● ● ● ● ● ● ● ● ● ● ● ● ● ● ● ● ● ● ● ● ● ● ● ● ● ● ● ● ● AL AZ AR CA CO CT DE DC FL GA HI ID IL IN IA KS KY LA ME MD MA MI MN MS MO MT NE NV NH NJ NM NY NC ND OH OK OR PA PR RI SC SD TN TX UT VT VA WA WV WI WY 10 20 30 40 50 6000 9000 12000 15000
Total LIHTC Units per Capita
F e d e ra l D is a s te r D e c la ra ti o n s Provision ● ● No Any
Median Home Value
● ● ● ● 200 300 400 500
Table 3: States & Territories with Mitigation, Preparedness, and Recovery Provisions in Qualified Allocation Plans
Mean Share LIHTC Allocations to Disaster Prone Counties 1-4 Years After Disaster Compared to Allocations to Disaster Prone Counties Before (or Without) a Disaster State Provision Counties Not-Post-Disaster Counties Post-Disaster Ratio of Post to Not-Post Alabama Both - 3.67 - Arkansas Preparedness 0.29 2.17 7.57 Arizona Preparedness 0 1.22 - California None 3.88 4.15 1.07 Colorado Preparedness 0 5.6 - Connecticut None - 2.89 -
District of Columbia None - - -
Delaware Preparedness - 38.86 - Florida None 1.42 1.41 1.00 Georgia Preparedness 5.39 2.53 0.47 Hawaii None 0 0 - Iowa Preparedness 2.78 2.11 0.76 Idaho None 0 3.08 - Illinois Preparedness 1.45 7.57 5.22 Indiana Both 3.2 3.26 1.02 Kansas Both 0.44 2.73 6.18 Kentucky Preparedness 1.31 1.02 0.78 Louisiana Preparedness - - - Massachusetts Preparedness - 1.36 - Maryland None - 5.93 - Maine None 16.5 24.96 1.51 Michigan None 0.43 1.73 3.99
Minnesota None 2.16 4.34 2.01
Missouri None 1.18 3.63 3.08
Northern Mariana Islands None - - -
Mississippi None 0.24 1.89 7.92
Montana None - 1.56 -
North Carolina Preparedness - 2.01 -
North Dakota Both 0 6.95 -
Nebraska Recovery 2.54 4.19 1.65
New Hampshire None 11.38 6.45 0.57
New Jersey None - 4.64 -
New Mexico Recovery - 5.24 -
Nevada None 0 0 -
New York None 2.33 0.97 0.42
Ohio None - 2.82 -
Oklahoma None 0.69 3.27 4.75
Oregon None 17.92 12.98 0.72
Pennsylvania Both - 2.21 -
Puerto Rico Preparedness - 0 -
Rhode Island None - 0 -
South Carolina None 5.14 14.04 2.73
South Dakota None 4.96 5.91 1.19
Tennessee Both 2.87 4.47 1.56
Texas None 1.12 1.9 1.70
Utah Both - 2.05 -
Virginia None 1.23 1.67 1.36
Virgin Islands None - - -
Vermont Recovery - 7.09 -
Washington None 7.61 7.73 1.02
Wisconsin None 2.59 9.55 3.69
West Virginia Preparedness 0 2.17 -
No Provision - 0.12 0.15 1.28
Any Provision - 0.08 0.12 1.44
Notes: The universe for this analysis is all American counties that experienced an extreme disaster
sometime between 2008 and 2015, defined as a disaster that is in the top 90 percent of damage caused in that state across that time period (damage is adjusted to 2017 dollars). This is one indicator for how disaster-prone a county is. Then, studying 2012-2015, the ‘Counties post-disaster’ column presents the mean share of LIHTC units allocated in a state to those counties that are one to four years out from a disaster. The ‘Counties Not Post-Disaster’ column presents the mean share of LIHTC units allocated in a state in those counties that are not one to four years out from a disaster. Since, the universe of counties in this analysis is counties that experienced an extreme disaster sometime between 2008 and 2015, it is possible to find, studying these subset of counties between 2012 and 2015, no counties that are Not-Post-Disaster and all counties that are Post-Disaster, and thus be unable to estimate a mean share of LIHTC units allocated in the state among counties that are Not-Post-Disaster.
Source: Data sources are fully described in Statistical Analyses of State Policy Adoption. All
Table 4: t-test Results Comparing States with Preparedness and/or Recovery Provisions and States without Provisions
Measure and Data
No Qualified Plan Allocation Clauses
Any Qualified Allocation Plan Clauses Clauses
Both Qualified
Allocation Plan Clauses
H0: MN=MA H0: MN=MB
Measurement Description Years Summary Mean (MN) N Mean (MA) N p Mean (MB) N p
State Social and Economic Characteristics
Population (Millions) 2013-2017 Average 7.68 27 4.84 24 0.14 4.76 8 0.20
Median Income 2013-2017 Average 60,260 27 53,613 24 0.03 55,917 8 0.17
Share Poverty (last 12 months) 2013-2017 Average 9.71 27 11.69 24 0.19 9.46 8 0.80
Share White (Non-Hispanic/Latino) 2013-2017 Average 65.91 27 69.58 24 0.49 77.85 8 0.01 Share Black (Non-Hispanic/Latino) 2013-2017 Average 11.54 27 10.20 24 0.66 9.10 8 0.54 Share Hispanic/Latino (Any Race) 2013-2017 Average 12.25 27 14.62 24 0.61 7.63 8 0.06
Gross State Product 2013-2017 Average/Capita 58,154 27 53,537 23 0.40 55,077 8 0.63
State Ideology Citizen Ideology (1) 2008-2014 Average -0.04 27 0.08 23 0.07 0.18 8 0.00
Citizen Ideology (2) 2013-2017 Average 53.22 26 45.36 23 0.08 35.82 8 0.00
State Housing
Characteristics Share Vacant Units 2013-2017 Average 12.91 27 13.73 24 0.43 12.76 8 0.89
Share Units in Multi-Family
Structure 2013-2017 Average 38.95 27 34.20 24 0.08 33.38 8 0.09
Share Owner-Occupied Units 2013-2017 Average 64.11 27 67.15 24 0.04 67.66 8 0.02
Median Home Value 2013-2017 Average 239,093 27 175,125 24 0.02 167,625 8 0.01
Median Rent 2013-2017 Average 999 27 846 24 0.01 822 8 0.00
LIHTC Units Allocated 1986-2015 Sum 65,699 29 35,850 24 0.07 33,276 8 0.06
LIHTC Units Allocated 1986-2015 Sum/Capita 9,202 27 7,799 24 0.06 7,817 8 0.13
LIHTC Units Allocated 2013-2015 Sum 5,298 29 2,084 24 0.03 1,804 8 0.02
LIHTC Units Allocated 2013-2015 Sum/Capita 703 27 432 24 0.01 357 8 0.00
State Disaster Experiences
Federally Declared Disasters 1986-2017 Sum/Capita 9.21 27 11.77 24 0.44 12.07 8 0.60
Federally Declared Disasters 2008-2017 Sum/Capita 4.10 27 5.14 24 0.50 4.87 8 0.70
Federally Declared Disasters 2013-2017 Sum/Capita 1.55 27 2.13 24 0.38 2.05 8 0.61
Counties with Severe Disasters 1986-2017 Sum/Capita 0.15 26 0.27 22 0.51 0.59 8 0.37
Counties with Severe Disasters 2008-2017 Sum/Capita 0.07 26 0.18 22 0.07 0.35 8 0.36
Counties with Severe Disasters 2013-2017 Sum/Capita 0.04 26 0.05 22 0.83 0.00 8 0.08
Federal Housing Assistance 2013-2017 Sum 3,177,224 29 2,996,221 24 0.93 213,888 8 0.04
FEMA MHUs Delivered 2013-2016 Sum 6.59 29 205.38 24 0.32 1.50 8 0.24
Notes: Estimates from ACS and Tausanovitch and Warshaw (2013) are effectively averages, in that they take data from many areas and years and present an estimate for
Sources: Data sources are fully described in Statistical Analyses of State Policy Adoption. All social and housing measures with the exception of those related to LIHTC
are from the ACS; the LIHTC measures are based on data from the Department of Housing and Urban Development Low-Income Housing Projects Database. Measures of federally declared disasters, mobile housing units (MHUs) allocated to a disaster, and federal housing assistance are based on datasets from FEMA; data on severe disasters are from ASU. Measures of citizen ideology (1) from Tausanovitch and Warshaw (2013) and citizen ideology (2) come from Berry et al. (1998). The data on state gross domestic product comes from the Bureau of Economic Analysis.
34 Works Cited
American Planning Association (June 1, 2014). Affordable Housing: Planning for Post-Disaster Recovery Paper Briefing 4. https://www.planning.org/publications/document/9139463/
Bates, L. K. (2006). Post-Katrina housing: problems, policies, and prospects for African-Americans in New Orleans. The Black Scholar, 36(4), 13-31.
https://doi.org/10.1080/00064246.2006.11413366
Berry, W. D., Ringquist, E. J., Fording, R. C., Hanson, R. L. (1998). Measuring Citizen and
Government Ideology in the American States. American Journal of Political Science, 42, 327-48 https://www.jstor.org/stable/2991759 and DOI: 10.2307/2991759
Bergquist, P., & Warshaw, C. (2019). Does Global Warming Increase Public Concern About Climate Change?. The Journal of Politics, 81(2).
https://www.journals.uchicago.edu/doi/abs/10.1086/701766
Boustan, L. P., Kahn, M., Rhode, P., & Yanguas, M. L. (2017). The Effect of Natural Disasters on Economic Activity in US Counties: A Century of Data (No. 23410). NBER Working Paper Series. Cambridge. http://www.nber.org/papers/w23410
Brand, A. L., & Seidman, K. (2012). Assessing Post-Katrina Recovery in New Orleans:
Recommendations for Equitable Rebuilding. Massachusetts Institute of Technology Community Innovators Lab.
https://www.colab.mit.edu/resources-1/2008/1/7/assessing-post-katrina-recovery-in-new-orleans-recommendations-for-equitable-rebuilding
Burby, R. J., Steinberg, L. J., & Basolo, V. (2003). The Tenure Trap: The Vulnerability of Renters to Joint Natural and Technological Disasters. Urban Affairs Review, 39(1), 32-58.
Bolin, R., & Stanford, L. (1991). Shelter, Housing and Recovery: A Comparison of U.S. Disasters. Disasters, 15(1), 24–34. https://doi.org/10.1111/j.1467-7717.1991.tb00424.x
Comerio, M. C. (1998). Disaster hits home: New policy for urban housing recovery. University of California Press: Berkeley, CA.
Community Development Insights – Low-Income Housing Tax Credits: Affordable Housing
Investment Opportunities for Banks. April 2014. Community Affairs Department. Office of the Comptroller of the Currency.
https://www.occ.gov/topics/community-affairs/publications/insights/insights-low-income-housing-tax-credits.pdf
Cutter, S. L., Boruff, B. J., & Shirley, W. L. (2003). Social vulnerability to environmental hazards. Social science quarterly, 84(2), 242-261.
35 Cutter, S. L., & Finch, C. (2008). Temporal and spatial changes in social vulnerability to natural
hazards. Proceedings of the National Academy of Sciences, 105(7), 2301-2306. https://doi.org/10.1073/pnas.0710375105
Dawkins, C. (2013). The Spatial Pattern of Low Income Housing Tax Credit Properties: Implications for Fair Housing and Poverty Deconcentration Policies. Journal of the American Planning Association, 79(3), 222–234. https://doi.org/10.1080/01944363.2014.895635
Dehring, C. A., Depken, C. A., & Ward, M. R. (2008). A direct test of the homevoter hypothesis. Journal of Urban Economics, 64(1), 155–170. https://doi.org/10.1016/j.jue.2007.11.001 Deng, L. (2011). The External Neighborhood Effects of Low-Income Housing Tax Credit Projects
Built by Three Sectors. Journal of Urban Affairs, 33(2), 143–166. https://doi.org/10.1111/j.1467-9906.2010.00536.x
Desmond, M., Gershenson, C., & Kiviat, B. (2015). Forced relocation and residential instability among urban renters. Social Service Review, 89(2), 227-262. https://doi.org/10.1086/681091
Diamond, R. and McQuade, T. (2016). Who Wants Affordable Housing in their Backyard? An Equilibrium Analysis of Low Income Property Development. Working Paper 22204, National Bureau of Economic Research.
Ellen, I. G., & Horn, K. M. (2018). Points for Place: Can State Governments Shape Siting Patterns of Low-Income Housing Tax Credit Developments?. Housing Policy Debate, 1-19. https://doi.org/10.1080/10511482.2018.1443487
Ellen, I. G., Horn, K. M., & O’Regan, K. M. (2016). Poverty concentration and the Low Income Housing Tax Credit: Effects of siting and tenant composition. Journal of Housing Economics, 34, 49–59. https://doi.org/10.1016/j.jhe.2016.08.001
Ellen, I. G., Schwartz, A. E., Voicu, I., & Schill, M. H. (2007). Does federally subsidized rental housing depress neighborhood property values? Journal of Policy Analysis and Management, 26(2), 257–280. https://doi.org/10.1002/pam.20247
Ellen, I.G., and Steil, J.P. (2019). The Dream Revisited: Contemporary Debates About Housing, Segregation, and Opportunity. Columbia University Press.
Ellen, I.G., Steil, J.P., and De la Roca, J. (2016). The Significance of Segregation in the 21st Century. City and Community, 15(1), 8-13. https://doi.org/10.1111/cico.12146.
Fischel, W. A. (2009). The Homevoter Hypothesis. Harvard University Press.
Gay, C. (2014). Fighting Poverty, Mobilizing Voters: Housing Investment and Political Participation. In American Political Science Association. Retrieved from
https://scholar.harvard.edu/cgay/publications/fighting-poverty-mobilizing-voters-housing-investment-and-political-participation
36 Federal Emergency Management Agency. 2018. Strategic Plan: Federal Emergency Management
Agency. Washington DC. https://www.fema.gov/strategic-plan
Gotham, K. F. (2014). Mechanisms of mutation: policy mobilities and the Gulf Opportunity (GO) Zone. Urban Geography, 35(8), 1171-1195. https://doi.org/10.1080/02723638.2014.960166
Gotham, K. F. (2015). Limitations, legacies, and lessons: Post-Katrina rebuilding in retrospect and prospect. American Behavioral Scientist, 59(10), 1314-1326.
https://doi-org.libproxy.mit.edu/10.1177/0002764215591186
Gotham, K. F. (2016). Re-anchoring capital in disaster-devastated spaces: Financialisation and the Gulf Opportunity (GO) Zone programme. Urban Studies, 53(7), 1362-1383.
https://doi-org.libproxy.mit.edu/10.1177/0042098014548117
Fothergill, A., & Peek, L. A. (2004). Poverty and Disasters in the United States: A Review of Recent Sociological Findings. Natural Hazards, 32(1), 89–110.
https://doi.org/10.1023/B:NHAZ.0000026792.76181.d9.
Freeman, L. (2003). The impact of assisted housing developments on concentrated poverty. Housing Policy Debate, 14(1–2), 103–141. https://doi.org/10.1080/10511482.2003.9521470
Freedman, M., & McGavock, T. (2015). Low‐Income Housing Development, Poverty Concentration, and Neighborhood Inequality. Journal of Policy Analysis and Management, 34(4), 805-834. https://doi.org/10.1002/pam.21856
Ganapati, N. E., & Ganapati, S. (2008). Enabling Participatory Planning After Disasters: A Case Study of the World Bank’s Housing Reconstruction in Turkey. Journal of the American Planning Association, 75(1), 41–59. https://doi.org/10.1080/01944360802546254
Howell, J., & Elliott, J. R. (2018). Damages done: The longitudinal impacts of natural hazards on wealth inequality in the United States. Social Problems, 1-20.
https://doi.org/10.1093/socpro/spy016
Johnson, C. (2007). Strategic planning for post-disaster temporary housing. Disasters, 31(4), 435– 458. https://doi.org/10.1111/j.1467-7717.2007.01018.x
Kahn, M. E. (2011). Do liberal cities limit new housing development? Evidence from California. Journal of Urban Economics, 69(2), 223–228. https://doi.org/10.1016/j.jue.2010.10.001 Keightly, Mark P. (March 28, 2018). An Introduction to the Low-Income Housing Tax Credit.
Congressional Research Service. https://fas.org/sgp/crs/misc/RS22389.pdf
Lee, J.Y. & Van Zandt, S. (2019). Housing Tenure and Social Vulnerability to Disasters: A Review of the Evidence.” Journal of Planning Literature, 34(2) 156-170.
37 Lens, M. C. (2013). The limits of housing investment as a neighborhood revitalization tool: Crime in
New York City. Journal of the American Planning Association, 79(3), 211-221. https://doi.org/10.1080/01944363.2014.893803
Lester, James P. 1995. “Federalism and State Environmental Policy.” In Environmental Politics & Policy: Theories and Evidence, 2nd edn, ed. James P. Lester. Durham, NC: Duke University Press, 39–60.
Levine, J. N., Esnard, A.-M., & Sapat, A. (2007). Population Displacement and Housing Dilemmas Due to Catastrophic Disasters. Journal of Planning Literature, 22(1), 3–15.
https://doi.org/10.1177/0885412207302277
Lingle, B., Kousky, C. & Shabman, L. (2018). Federal Disaster Rebuilding Spending: A Look at the Numbers. Risk Management and Decision Processes Center.
https://riskcenter.wharton.upenn.edu/disaster-aid/federal-disaster-rebuilding-spending-look-numbers
Lizarralde, G., Johnson, C., & Davidson, C. H. (Eds.). (2010). Rebuilding after disasters: from emergency to sustainability. London ; New York: Spon Press.
Lunder, Erika K.;Petit, Carol A.; and Teefy, Jennifer. Tax Provisions to Assist with Disaster Recovery. Congressional Research Service. November 29, 2012. p. 15.
https://fas.org/sgp/crs/misc/R42839.pdf
Matisoff, D. C. (2008). The Adoption of State Climate Change Policies and Renewable Portfolio Standards: Regional Diffusion or Internal Determinants? Review of Policy Research, 25(6), 527– 546. https://doi.org/10.1111/j.1541-1338.2008.00360.x
National Association of Homebuilders. (September 29, 2017). “IRS Authorizes LIHTC Owners to Provide Emergency Housing for Disaster Victims.” http://nahbnow.com/2017/09/irs-authorizes-lihtc-owners-to-provide-emergency-housing-for-disaster-victims/
McClure, K. (2006). The low‐income housing tax credit program goes mainstream and moves to the suburbs. Housing Policy Debate, 17(3), 419–446.
https://doi.org/10.1080/10511482.2006.9521576
McClure, K. (2008). Deconcentrating Poverty With Housing Programs. Journal of the American Planning Association, 74(1), 90–99. https://doi.org/10.1080/01944360701730165
National Oceanic and Atmospheric Administration, 2017. https://www.ncdc.noaa.gov/billions/
National Association of Homebuilders. (September 29, 2017). “IRS Authorizes LIHTC Owners to Provide Emergency Housing for Disaster Victims.” http://nahbnow.com/2017/09/irs-authorizes-lihtc-owners-to-provide-emergency-housing-for-disaster-victims/
38 Oliver-Smith, A. (1990). Post-Disaster Housing Reconstruction and Social Inequality: A Challenge to
Policy and Practice. Disasters, 14(1), 7–19. https://doi.org/10.1111/j.1467-7717.1990.tb00968.x
Peacock, W. G., Dash, N., & Zhang, Y. (2007). Sheltering and Housing Recovery Following Disaster. In Handbook of Disaster Research (pp. 258–274). Springer, New York, NY.
https://doi.org/10.1007/978-0-387-32353-4_15
Peacock, W. G., Van Zandt, S., Zhang, Y., & Highfield, W. E. (2014). Inequities in Long-Term Housing Recovery After Disasters. Journal of the American Planning Association, 80(4), 356– 371. https://doi.org/10.1080/01944363.2014.980440
Powell, J. A. (2008). Reflections on the Past, Looking to the Future: The Fair Housing Act at 40. J. Affordable Housing. & Community. Dev. L., 18, 145.
https://scholarship.law.berkeley.edu/facpubs/294/
Quarantelli, E. L. (1988). Disaster crisis management: A summary of research findings. Journal of management studies, 25(4), 373-385. https://doi.org/10.1111/j.1467-6486.1988.tb00043.x
Ringquist, E. J., & Garand, J. C. (1999). Policy change in the American states. American state and local politics, 268-299.
Rohe, W. M., & Freeman, L. (2001). Assisted Housing and Residential Segregation: The Role of Race and Ethnicity in the Siting of Assisted Housing Developments. Journal of the American Planning Association, 67(3), 279–292. https://doi.org/10.1080/01944360108976236
Salkowe, R.S., & Chakraborty, J. 2009. “Federal Disaster Relief in the U.S.: The Role of Political Partisanship and Preference in Presidential Disaster Declarations and Turndowns.” Journal of Homeland Security and Emergency Management 6(1): 28. https://doi.org/10.2202/1547-7355.1562
Schmidtlein, M. C., Finch, C., & Cutter, S. L. (2008). Disaster declarations and major hazard occurrences in the United States. Professional Geographer, 60(1), 1–14.
https://doi.org/10.1080/00330120701715143
Steil, J.P. & Delgado, L.H. (2019). Limits of diversity: Jane Jacobs, the Just City, and anti-subordination. Cities, 19: 39-48. https://doi.org/10.1016/j.cities.2018.06.017
Tausanovitch, C., & Warshaw, C. 2013. “Measuring Constituent Policy Preferences in Congress, State Legislatures, and Cities.” The Journal of Politics 75 (2): 330-342.
https://doi.org/10.1017/S0022381613000042
United States Government Accountability Office. July 2008. Report to the Committee on Finance, U.S. Senate, and the Committee on Ways and Means. Gulf Opportunity Zone: States are
Allocating Federal Tax Incentives to Finance Low-Income Housing and a Wide Range of Private Facilities. https://www.gao.gov/new.items/d08913.pdf
39 Vale, L. J., & Campanella, T. J. (2005). The resilient city: How modern cities recover from disaster.
Oxford University Press.
Vale, L. J., & Shamsuddin, S. (2017). All Mixed Up: Making Sense of Mixed-Income Housing Developments. Journal of the American Planning Association, 83(1), 56–67.
https://doi.org/10.1080/01944363.2016.1248475
Van Zandt, S., Peacock, W. G., Henry, D. W., Grover, H., Highfield, W. E., & Brody, S. D. (2012). Mapping social vulnerability to enhance housing and neighborhood resilience. Housing Policy Debate, 22(1), 29-55. https://doi.org/10.1080/10511482.2011.624528
Wiener, J. G., & Koontz, T. M. (2010). Shifting Winds: Explaining Variation in State Policies to Promote Small-Scale Wind Energy. Policy Studies Journal, 38(4), 629–651.
https://doi.org/10.1111/j.1541-0072.2010.00377.x
i Lee and Van Zandt (2019) label the phases as preparedness, impact, emergency, and recovery.
ii “Qualified census” tract are tracts which have a poverty rate of at least 25 percent or in which 50 percent or more
of the households have an income less than 60 percent of the area median gross income (26 U.S.C. § 42(d)(5)(B)(ii)).
iii IRS Rev. Proc. 2007-54; IRS Rev. Proc. 2014-49; IRS Rev. Proc. 2014-50; IR-2017-165. iv P.L. 109-135; P.L. 110-343.
v If the 2018 QAP was not available, we used the 2017 QAP. We obtained these QAPs from Novogradac.
Novogradac & Company LLP are certified public accountants that shares QAPs on their website here:
https://www.novoco.com/resource-centers/affordable-housing-tax-credits/application-allocation/qaps-and-applications/2018-qaps-and-applications
vi The Alaska QAP was unavailable.
vii We also searched QAPs from 2000 to 2017 for the term “disaster” to ascertain when mitigation, preparedness, and
recovery provisions were introduced, the frequency with which they were included, and also to identify specific provisions over the past 18 years focusing explicitly on recovery from federally or state declared disasters.
viii For example, the Tennessee QAP 2017 explains, “No portion of the improvements associated with the proposed
development may be within a 100-year flood plain unless covered by flood insurance” (p. 23).
ix In Arizona, development in not allowed in the FEMA 500-year flood plain either. x Alabama QAP 2018
xi Louisiana QAP 2017 xii Indiana QAP 2018-2019
40
xiii Kansas QAP 2018 xiv Alabama QAP 2018
xv The Nebraska Investment Finance Authority (NIFA) administers the CRANE program, and works with
communities and neighborhoods, who have joined with for profits and non-profit entities that commit to target specific long-term, interrelated and coordinated job creation/enhancement, economic growth, joint housing and community development strategies (https://www.nifa.org/res-dev).
xvi Tennessee 2018 QAP
xviiWhile discouraging construction in the floodplain is essential in many contexts, in some situations, prohibiting
LIHTC development in the floodplain altogether may be problematic because it could prevent neighborhood investment in climate-vulnerable, low-income communities of color. In all cases, LIHTC developments should be built to appropriately mitigate relevant hazards and protect their residents.