Analysis of Nanofibrillar Cellulose Foam's Deformation By
Huy Nguyen
Submitted to the
Department of Materials Science and Engineering in Partial Fulfillment of the Requirements for the Degree of
Bachelor of Science at the
Massachusetts Institute of Technology
June 2011
@ 2011 Huy Nguyen All rights reserved
ARCHNES
MASSACHUSES INSTITUTE OF TECHNOLOG
NOV 10
2015
LIBRARIES
The author hereby grants to MIT permission to reproduce and to
distribute publicly paper and electronic copies of this thesis document in whole or in part in any medium now known or hereafter created.
Signature redacted
- -1
...
Department of Materials Science and Engineering May 6, 2011
Certified by ...
Signature redacted
Lorna Gibson Matoula S. Salapatas Professor of Materials Science and Engineering Thesis Supervisor
Accepted by ...
Signature redacted
Lionel C. Kimerling Chair, Undergraduate Committee Signature of Author ...
Analysis of Nanofibrillar Cellulose Foam's Deformation by
Huy Nguyen
Submitted to the Department of Department of Materials Science and Engineering on April 29, 2011 in Partial Fulfillment of the
Requirements for the Degree of Bachelor of Science in Materials Science and Engineering
ABSTRACT
Cellulose consists of a multitude of thin, long nanofibers with both crystalline and non-crystalline regions. If these fibers are isolated and broken down into lengthy, mostly crystalline polymers, they can then be reconstituted into novel materials, one which is foam. Nanofibrillar cellulose foam (NFC), however, has not been able to perform at its theoretical strength. Therefore, its deformation must be examined to determine how its fabrication can be improved.
Thesis Supervisor: Lorna Gibson
TABLE OF CONTENTS Introduction Experimental Methods Results Discussion Conclusion References 4 10 14 24 27 29
INTRODUCTION
Cellulose is an exceedingly abundant and pervasive polymer on this planet, as it is found within the cell walls of Viridiplantae, the clade that consists of all land plants and green algae and contains more than 350,000 species (Smith, 2009). An
astonishingly large portion of everyday human life contains cellulose too, for it is found in wood. Hemp, flax, and cotton also contain cellulose, and even some bacteria
produces it (Putra, 2008). On the whole, cellulose makes up about a third of all plant matter (Cellulose, 2011).
OH
HO
OH
0
0
0
0
HJfO
OH
OH_n
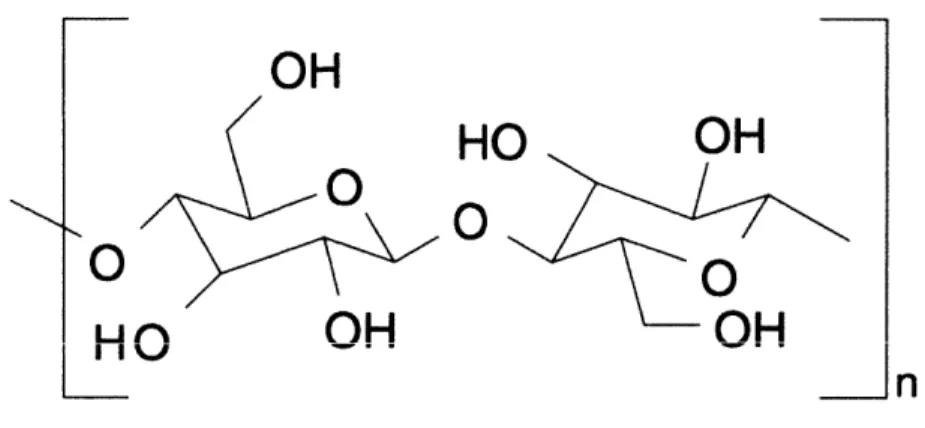
Fig. 1 Anhydroglucose repeating unit of cellulose (Eichhorn, 2009)The polymer cellulose itself is a long-chain polysaccharide, consisting of 7000 to 15000 monosaccharides, carbohydrate monomers made from carbon, hydrogen, and oxygen. The fundamental repeating structures in cellulose are anhydroglucose rings (Fig. 1) that can condense via 3-1,4 glycosidic bonds. The resulting structure consists of microfibrils 2 to 20 nm in diameter and up to 40 microns long. Additionally, the fibrils are fairly stable, for they have a complex hydrogen bonds network. This network offers the cellulose fibrils a very high axial Young's modulus, as determined by:
E= a/e (1) where E is the Young modulus, a is the applied stress, and e is the measured strain. A high ratio of stress to strain is a property that would translate well into any exploration of cellulose's potential role as an engineering material (Tashiro, 1990).
In order for cellulose to be used in engineering applications, its nanofibers must be isolated. Bulk cellulose contains a myriad of the polymer fibers aggregated into larger structures, with the whole being partially amorphous and partially crystalline. In plant cell walls, the cellulose fibrils are intertwined in a matrix of hemicellulose pectin and/or lignin. The individual fibers need to be separated from the bulk material and put into
nanofibrillar form so that no amorphous material would be present to affect stiffness properties. Additionally, as nanofibers, the cellulose would have the advantage of a high
ratio of length to diameter. High aspect ratios are required if materials are going to be used in reinforcement applications; the long length allows sufficient stress transfers from a material matrix to its reinforcing fibers. Nanofibrillar cellulose (NFC), with its high Young's modulus, might be extremely useful in that field.
Much effort has been made to determine the theoretical modulus of cellulose fibers. In 1936, Meyer and Lotmar came notably close to current accepted values; they
calculated a 120 GPa modulus (Eichhorn, 2009), wielding a theoretical model with data from spectroscopic tests and handicapped by an invalid understanding of cellulose's structure. Lyons came afterward with a calculated modulus of 180 GPa, but even this is incorrect, as his mathematical expression for bond angle bending was incorrect. More calculations of cellulose fibers' theoretical peak modulus continued, with most results
ranging in the 100 to 160 GPa range (Eichhorn, 2009). Though that is a wide range of possible values, cellulose is quite competitive with other structural materials if it
performs anywhere within that range. When compared to other engineering materials, cellulose fibers appear to hold their own. As seen in Table 1, cellulose's modulus is competitive with other materials, but its specific modulus is significantly higher than the others'.
Table 1. The Young's modulus and specific modulus of cellulose and engineering materials (Eichhorn, 2009)
Material Modulus (GPa) Density (Mg m~3) Spec. modulus
(GPa Mg1 M3)
Aluminum 69 2.7 26
Steel 200 7.9 26
Glass 69 2.5 28
Crystalline Cellulose 138 1.5 92
For cellulose to approach the theoretical values, it must be broken down into its constitutive nanofibers. NFC can be obtained with the enzyme endoglucanase. When put with wood pulp in a phosphate buffered solution and agitated with a microfluidizer, the results are NFC fibers of a few microns in length and 5 to 50 nm in diameter. These fibers can then be used in several different ways. They can be used to form
nanopapers, either by vacuum filtration of the NFC suspension or by being ingrained into a starch or polymer matrix. In addition to NFC nanopapers, NFC foams can be
constructed instead. The NFC fibers are dispersed in an aqueus, starch, or polymer solution and then freeze-dried, forming the NFC foam. Fine tuning of the foam's
composition can be done via controlling the rate of freezing, final freezing temperature, and the amount of NFC fibers dispersed in the solution.
NFC foams, in particular, have immediate benefits in simple and practical applications; there are already wide spread uses for foams that NFC foams might be able to easily replace. Foams are commonly used in structural sandwich panels, where two stiff skins or faces are bonded to a lightweight, softer core. The intention here is to have the core increase the panel's moment of inertia, making it harder for the panels to bend. Foams are especially ideal when the panels are also intended to provide some thermal insulation, like in the case of refrigerated trucks. If NFC foams are able to provide a notable increase in specific stiffness, then it can immediately have a straightforward, low-tech application. Additionally, foams are also used in impact protection situations, such as helmets and padding. The energy absorption ability of a material can be calculated by the total area under its stress-strain curve. If either the yield point is increased, or if the necessary stress for each strain point is increased, a material's absorption ability is also increased. NFC fibers are poised to be able to reliably raise foam-based absorption materials' efficiency.
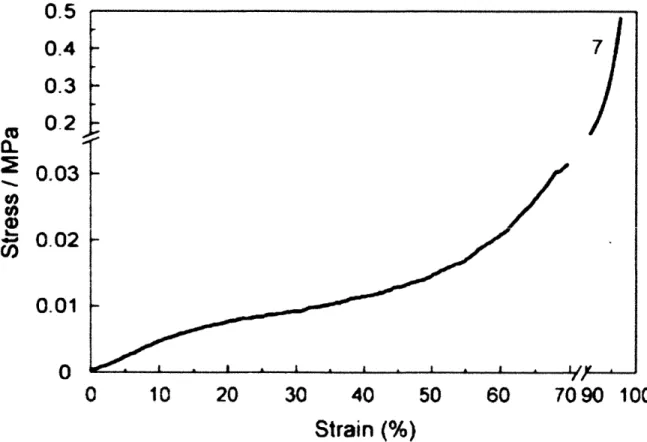
Foam deformation can be split up into three distinct stages, all of which are easily discerned from a stress strain curve like Figure 2. The first stage is the linear elasticity stage, which occurs between 0% and ~15% strain in the figure. In this stage,
closed cells. After linear elasticity comes the plateau region. Here, the cells are undergoing elastic buckling, forming plastic hinges, or going through brittle crushing, depending on whether the foam is elastomeric, yielding, or brittle, respectively. The last region is marked by a significant increase in slope and is called the densification region. The cells within the foam have completely collapsed, allowing the cell walls to touch. Therefore, any increase in strain is compressing the actual solid of the foam.
a-U0
0.5
0.4
0.3
0.2
0.03
0.02
0.017
~zj
i I . I * I I40
Strain
(%)
50
60
lv .i7090 100
Figure 2. Stress strain curve for a NFC foam being compressed (Sehaqui, 2010) The linear elastic portion of the stress strain curve can be used to obtain the Young's modulus, denoted by E*, where the asterisk denotes a property of the foam; an underscript s will denote properties of the cell wall. The model that is used to obtain E*
U
0
10
20
30
differs, depending on whether the foam is open-celled or closed-celled. In open cell foams, the model can be simplified to a network of members of length I and cross-sectional side t, arranged into cubes that are staggered so that midpoints meet up.
Relative density and piece dimensions can be related by
p* /ps oC ( t / I) 2 (2)
where p* / ps is the cell's relative density. Additionally, the second moment of area, I, of a network piece is related to its dimensions by
I o t4 (3)
Using a standard beam theory model, one can obtain the deflection 6 by relating it to the load F, the beam length I, the Young's modulus with
6 oc F13
/( Es I) (4)
The force F is related to stress and length of the structural unit via
F oc a 12 (5)
and the strain e is related to the beam displacement by
e Oc 6 /1 (6)
Combining all of this, one is able to obtain the equation relating Young's modulus and all the given terms:
E' Es t4 / 14 = CEs ( p* / ps )2 (7) where p* is the density of the foam, ps is that of the solid, C is a constant that been experimentally shown to be ~ 1 (Gibson, 2008). Though this analysis is for open celled foams, NFC foams have curved cell waves, so their behaviors match open celled foams, due to cell bending induced by wall curvature.
The compressive Young's modulus for NFC foams is currently significantly below the theoretical maximum cellulose fiber modulus of 100 to 160 GPa. Tests have put the
modulus of NFC foams in the low single digits MPa (Sehaqui, 2010) for foam modulus; from equation 7, that gives the cell walls of NFC foams a -1.2 GPa cell wall modulus. That number is significantly lower than NFC's theoretical values, which leaves room to
improve current NFC foam's mechanical properties. Current ideas to improve NFC foam include decreasing its porosity and decreasing the curvature of the foam's nanofibrils in order to improve the structure of the cell walls. Cell wall porosity can be mitigated during
processing by having greater vacuum filtration of the NFC solution.
This research focuses on performing uniaxial compressive testing of nanofibrillar cellulose foam in order to determine how it deforms under stress. With the samples' compressive stress strain curve and SEM images, one can analyze how stress interacts with the cell structure and perhaps extend that analysis into new ways to manufacture
NFC foams.
EXPERIMENTAL METHODS
The foams used were all obtained from Professor Lars Berglund at KTH in
Sweden. The NFC foams were made from softwood sulfite pulp, treated with an enzyme and mechanically separated. The pulp is then suspended in water at 2.2 wt% with the
aid of a microfluidizer. Afterwards, the resulting solution is diluted even further, before being brought back to high concentrations. The concentration was increased via a centrifuge, varying rotational speed as necessary to achieve desired concentrations. After the centrifuge, a layer of concentrated solution lies at the bottom of the container,
while the rest is practically pure water; the water portion is removed. Then, the remaining solutions were poured into aluminum cups and stored at 4 C for a night in order to pre-cool the solution and to decrease the probability of any crack formations. A set NFC foam samples that were obtained, containing 0.5 wt% NFC (Table 2).
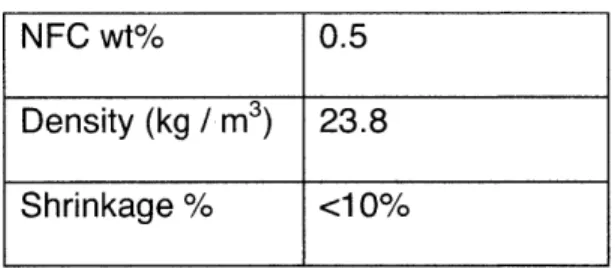
Table 2. NFC Foam sample details
NFC wt% 0.5
Density (kg / M3) 23.8
Shrinkage % <10%
Before the samples could be tested, they had to be cut up into smaller, more manageable pieces. The original method was to use a clean razor blade to gently saw off cubes of NFC foam of about 6 mm on each side. Each sample was cut slightly differently, since the surfaces needed to be continuously trimmed down to get a flatter surface. However, it became immediately evident that foams were very tricky to cut, for each slice and push of the blade caused significant chunks of the foam to flake off the sample. That process left the resulting sample with rather jagged sides, with odd
protrusions and surfaces that were not at 90 degrees angles to one another. Some data was gathered using those samples, but it soon became apparent that a more precision cutting tool was needed. A scapel was used.
Initial compression tests of the NFC foam samples involved a tabletop Instron, with a 500 N load cell. The voltage measurements were set to 10%, so that the 500 N load cell was effectively acting as a 50 N load cell. The compression platens were set to
move together at 2 mm / min, with the origin set to be right above, but not touching, the sample. Samples range in size from 4 to 6 mm. Stress strain measurements were allowed to continue uninterrupted until the Instron platens were approximately 2 mm
apart.
In addition to the tabletop Instron compression tests, SEM in-situ compressions tests were also performed. A scanning electron microscope works by shooting a high
energy electron beam (up to 40 KeV) at a sample within a vacuum. Electrons are then scattered back out by the sample; the electrons are then picked up by detectors within the SEM, creating an image of the sample. This system works best with a conductive sample because the sample needs to dissipate the constant influx of energetic electrons from the SEM. However, in foam samples, the material is an insulator, so the samples
must be coated with a conductor to prepare it for the SEM.
The samples were loaded into a Pelco SC-5 Automatic High Resolution Sputter Coater with a gold plate. The sputterer was connected an Argon gas tank, and set to vent out its chamber with Argon prior to vacuum sputtering. The sputterer has automatic
settings-the only manual control given is the length of time of the sputtering process. Initially, 45 seconds was picked, but later 75 seconds was used because it gave a better coating.
A LEO 438VP SEM with a custom deformation stage was used for compression tests of the sample within the SEM. The deformation stage had a 50 N load cell
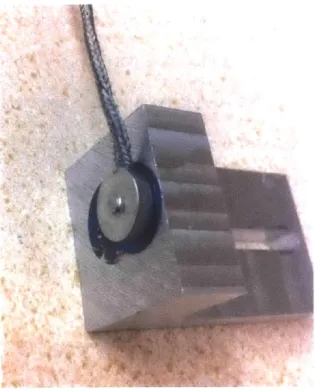
attached to it. Unfortunately, the cell is not a flat platen, but instead, it has a 2.5 mm diameter wide and 0.7 mm high protrusion in the center, as seen in Figure 3.
Figure 3. Load cell with its irregular protrusion in its center.
This nubbin is where the load measurements are taken, so as much of the load as possible should be orthogonal to the center of the protrusion in order for the load measurements to be accurate. To accommodate the protrusion, a variety of loading platforms were tested, ranging from a purely flat plate to a stem with a flat top for the sample and a dimpled bottom to perfectly cover the load cell's nubbin and no more. In the end, a hat-like device was selected as the best option for a sample stage. This device would be a cylindrical slab of metal with a small hole in the middle, just enough to cover most of the nubbin but not so large so that the there is no contact to the nubbin;
physical contact and resistance is required for accurate load measurements.
Various NFC foam samples of roughly 6 mm by 6 mm by 10 mm attached to the loading platform via a carbon double sided adhesive tab, with the 6 mm length being parallel to the loading direction. The platform is attached to the loading cell simply by
pressure; the load cell can be adjusted with screws, so the screws were tightened with a small applied pressure on the sample. As is noticeable in Figure 3, there is another carbon tab that attaches the load cell to the mobile assembly stage. The assembly stage is controlled by a stepped motor that can either move the stage forward or backward at a maximum of 5 microns per second. A dedicated computer and an in-house developed Visual Basic program control this motor, providing the basic
functionality of recording stress strain measurements and determining whether to be in tension or compression mode.
The actual SEM imaging is done using another dedicated computer, with
software provided by LEO. The electron gun voltage was varied between 7.5 KeV and 10 KeV during testing, and the probe current was kept at around 100 pA and adjusted depending on resolution needs.
RESULTS
The compression results for the Instron loading tests can be seen below in Figure 5:
50 40 -30 20 10 0 -1 -10 Figure - - - - -- - --- ~- ~--1 2 3 4 5 6 7 Displacement ( mm)
5. Instron compression test with NFC Sample 1 and a 500 N load cell.
The two lines represent two different samples that have dimensions equal to the sample average (6 x 6 x 10 mm). What's most noticeable is the lack of the three distinct regions that is expected of a foam compression test. Further stress strain tests were also done in the SEM deformation stage, as seen in Figure 6. Here, the three regions are
significantly more distinct. The calculated Young's modulus for the foam, taken from the linear elastic stage of foam's compression in Figure 6, is 472 Pa.
700 --600 500 - -- - - - - ~ - -- - ~---- - -400 300 200 - -100 -- -0 0.1 0.2 0.3 0.4 0.5 0.6 0.7 0.8 0.9 1 Strain
Figure 6. NFC foam sample 1 deformation stage compression
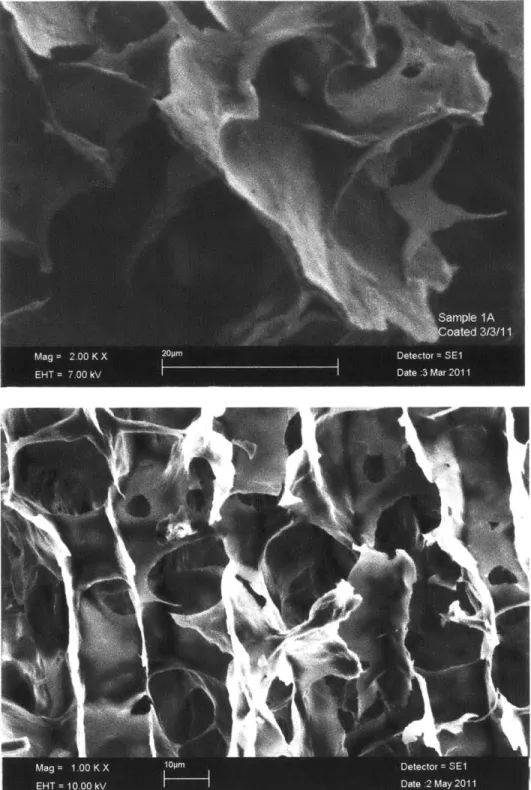
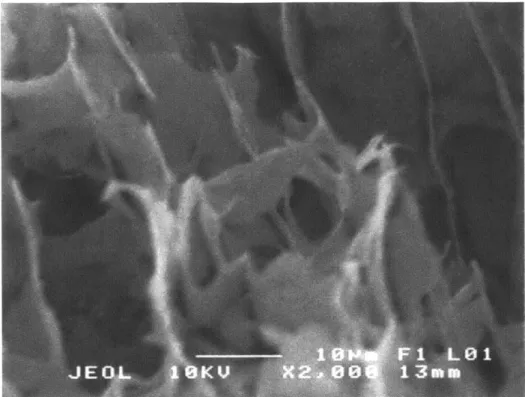
NFC foam samples were originally coated with gold for 45 seconds in the Pelco sputterer before moving onto 75 seconds coating periods. The reason for the change is because 45 seconds was not long enough for a sufficiently thick layer of gold to build. 75 seconds of coating gave significantly improved results (Figure 7). Without a decently thick layer, one would obtain images like in Figure 8, which doesn't have as many
Figure 8. SEM of NFC Foam Sample coated at 45 s
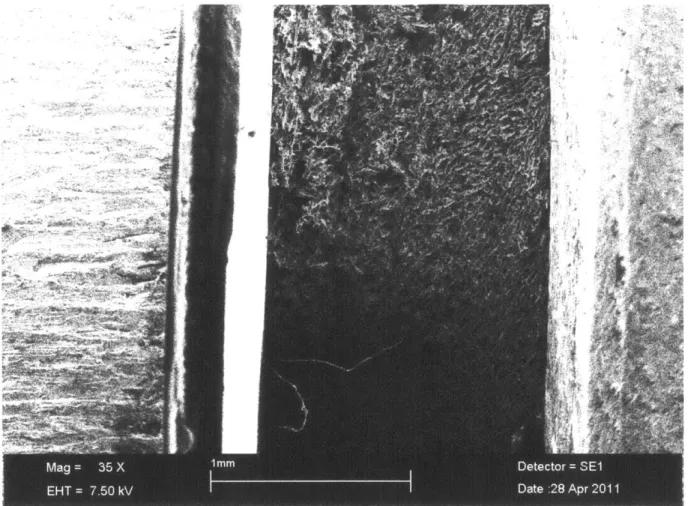
The SEM deformation stage was also used to obtain SEM images of the NFC foam sample at increasing strains. It is during this stage that the loading platform becomes crucial because it provides stability for the sample. In Figure 9, one can see
how an unstable platform could affect the experiment; the sample is twisting as load is increased. This situation was the result of the aforementioned stem-based platform, where the entire load is focused down the stem and into the load cell's protrusion. The
dependence on a long stem means that any slight changes in angles and conformations are magnified throughout the whole system.
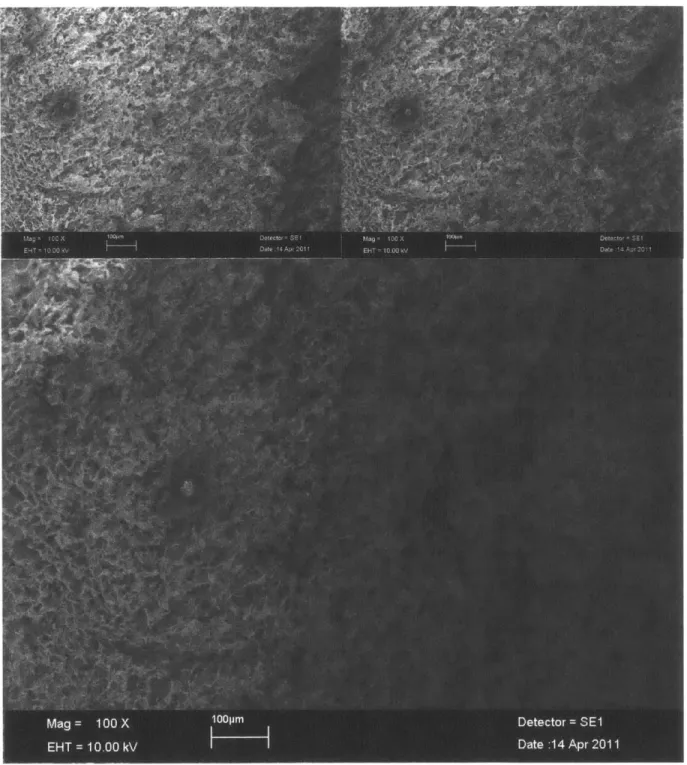
Lastly, the SEM and deformation stage was utilized to determine how the structure of the NFC foam changes at various strains (Figure 10, 11).
Figure 9. As the load is increased, there is a slight twist in the sample, which one can see if one carefully looks at the top two images. The bottom one demonstrate the twist after a lot of strain.
~~-AUK
Figure 10. NFC foam sample at 52%, 61%, 71% strain, from top to bottom
Figure 11. SEM of NFC sample at 1%, 17%, 29%, 55%, 69%, from top to bottom. DISCUSSION
Figure 10 indicates that under compression, the foam is being compressed in lateral bands, one at a time. The difference between the second and third picture of Figure 10 is the most striking, for the middle third of the sample is being compressed; the two side bands' shapes remain relatively constant. In order to understand how the
individual cells deform under load, the focus has to be on one specific area until that area starts to buckle. However, as seen from the SEM shots, not all areas buckle, and some areas of the foam buckle in a much more significant manner. Any future attempts to get a good view of how a foam cell collapses would simply require a multitude of trials and errors to pick out the right spot at the right time.
The cells in the sample in Figure 11 has an obvious vertical orientation that stays relatively stable until higher strains. In the 55% strain SEM image, however, this pattern begins to break down, and orientation becomes seemingly random at 69%. This is interesting because the compression platens are crushing the sample from left right, when looking at the image, so it would be expected that the cells also collapse in that direction. The cells' unexpected behavior could be due to some walls being stronger than others, stabilizing some cells more than others. Instead of the entire foam being compressed one lateral, continuous band at a time, the band is actually broken up into a bunch of smaller steps, with the weakest cells leading the band and the strongest cells trailing the band.
Additionally, as observable in Figure 7 and 11, a lot of the cells have holes within their walls. These holes probably decrease the strength and rigidity of the walls.
Perhaps the cells that fail prematurely are the ones with a greater proportion of wall holes.
The stress-strain curve of a compression test on foam shown in Figure 5 does not resemble what would be expected of a foam compression test. For instance, while the densification region is quite prominent, the other two regions are left quite
ambiguous, with the load curves increasing exponentially. The compression specimens were prepared using a razor blade, which gave an irregular surface, so that under compressive loading, the platen gradually contacted more and more of the sample surface as load increased. The entire surface of the specimen was not contacted until a
strain greater than the buckling strain for the collapse of the cells. At that point, the linear elastic region could not be distinguished from the stress plateau region.
In the SEM, there were problems in stabilizing the sample while it is undergoing compression. The stem platform stage created large angles of twisting during
compressive loads. Additionally, in platform stage designs where there is very small amount of allowable angles-flat plates-minor twists and turns might not affect how the sample is being presented to the camera, but it would affect how much load is being transferred directly to the nubbin of the load cell. If a significant amount of load is
transferred to the side of the load cell, the cell would not be able to read that data, so the reliability of the data would be compromised.
Additionally, some of these foam samples have been exposed to air for long periods of time. The samples were not left completely uncovered, but they were not stored with the intention of long term storage. As such, it seems likely that some
humidity could have gotten into the sample and affected it. Because NFC is a biological material, exposure to moisture might have some adverse effect on its stiffness and on the stiffness of the foam (Eichhorn, 2009).
Another stability problem to deal with is the stability of the image. Almost all materials have a non-zero Poisson ratio, signifying that under load on the ell direction, there will also be an 622 and 633 if those faces are unbound. Because the surfaces of the platens are not frictionless, the portions of the foam touching those surfaces would barely move compared to areas farther away. Consequently, larger amounts of load cause the sample to bulge outward, causing large portions of the SEM image to go out
of focus. NFC foam samples were eventually cut down to ~3 mm thickness to mitigate this problem.
The incomplete load transfer issue might explain why Figure 6 gives the foam such a low Young's modulus. With that low of an E, the sample is well below theoretical values and even other experimental values (Sehaqui, 2010). Though the experiment was ran with a well fitting "hat" that covered the nubbin, any slight deviation from being perfectly orthogonal to the load cell would cause the edge of the hat-like platform stage to grind into the surface of the load cell. If that happens, a large chunk of energy is lost
into a non-sensitive area of the load cell. The measured load is thus artificially lowered, tainting any calculations of modulus.
CONCLUSION
Cellulose is abundant, renewable, and has excellent mechanical properties. There are opportunities to exploit these properties in many fields. Nanofibrillar cellulose foam could be used in structural sandwich panels, energy absorption, or acoustic
absorption applications. The properties of NFC foams are below those expected theoretically; further research on improving the properties is now required.
A method that has been proposed is to analyze the deformations and failure mechanisms of NFC foam's cells to guide processing improvements. The work done here has suggested that such work would require a carefully built SEM deformation stage, where the sample is kept stable at all times. In addition, any attempts to look at a foam cell would consist of multiple attempts, since it is difficult to determine when and
where the material fails. When the cells do fail, some seem to fail earlier than others, likely due to differences in wall strength.
REFERENCES Cellulose. (2011). In Encyclopedia Britannica. Retrieved
from http://www.britannica.com/EBchecked/topic/1 01633/cellulose Eichhorn, S. et al. (2009). Review: current international research into
cellulose nanofibres and nanocomposites. Journal of Material
Science, 45(1), 1-33.
Gibson, L., & Ashby, F. (1988). Cellular solids. Cambridge,UK: Press Syndicate of the University of Cambridge.
Putra, A. et al. (2008). Production of bacterial cellulose with well oriented fibril on pdms substrate. Polymer Journal, 40, 137-142.
Sehaqui, H. et al. (2010). Mechanical performance tailoring of tough ultra-high porosity foams prepared from cellulose i nanofiber
suspensions. Soft Matter, 6, 1824-1832.
Smith, S. et al. (2009). Mega-phylogeny approach for comparative biology: an alternative to supertree and supermatrix
approaches. BMC Evolutionary Biology.
Tashiro, K. (1990). Theoretical evaluation of three-dimensional elastic constants of native and regenerated celluloses: role of hydrogen bonds. Polymer, 32(8), 1516-1526.