HAL Id: hal-00327937
https://hal.archives-ouvertes.fr/hal-00327937
Submitted on 21 Jun 2005HAL is a multi-disciplinary open access
archive for the deposit and dissemination of sci-entific research documents, whether they are pub-lished or not. The documents may come from teaching and research institutions in France or abroad, or from public or private research centers.
L’archive ouverte pluridisciplinaire HAL, est destinée au dépôt et à la diffusion de documents scientifiques de niveau recherche, publiés ou non, émanant des établissements d’enseignement et de recherche français ou étrangers, des laboratoires publics ou privés.
Evidences of thin cirrus clouds in the stratosphere at
mid-latitudes
Philippe Keckhut, Alain Hauchecorne, Slimane Bekki, Augustin Colette,
Christine David, Julien Jumelet
To cite this version:
Philippe Keckhut, Alain Hauchecorne, Slimane Bekki, Augustin Colette, Christine David, et al.. Evi-dences of thin cirrus clouds in the stratosphere at mid-latitudes. Atmospheric Chemistry and Physics Discussions, European Geosciences Union, 2005, 5 (3), pp.4037-4055. �hal-00327937�
ACPD
5, 4037–4055, 2005Evidences of thin cirrus clouds in the
stratosphere at mid-latitudes P. Keckhut et al. Title Page Abstract Introduction Conclusions References Tables Figures J I J I Back Close Full Screen / Esc
Print Version Interactive Discussion
EGU Atmos. Chem. Phys. Discuss., 5, 4037–4055, 2005
www.atmos-chem-phys.org/acpd/5/4037/ SRef-ID: 1680-7375/acpd/2005-5-4037 European Geosciences Union
Atmospheric Chemistry and Physics Discussions
Evidences of thin cirrus clouds in the
stratosphere at mid-latitudes
P. Keckhut, A. Hauchecorne, S. Bekki, A. Colette, C. David, and J. Jumelet Service d’A ´eronomie/Institut Pierre-Simon Laplace, CNRS, Verri `eres le Buisson, France Received: 28 December 2004 – Accepted: 17 January 2005 – Published: 21 June 2005 Correspondence to: P. Keckhut (keckhut@aerov.jussieu.fr)
ACPD
5, 4037–4055, 2005Evidences of thin cirrus clouds in the
stratosphere at mid-latitudes P. Keckhut et al. Title Page Abstract Introduction Conclusions References Tables Figures J I J I Back Close Full Screen / Esc
Print Version Interactive Discussion
EGU
Abstract
This study is devoted to the possible presence of cirrus clouds in the stratosphere. Three months of lidar data collected in the south of France (44◦N) for detection of stratospheric cirrus are carefully analyzed. Most of the cirrus clouds appear to be located in the troposphere below the dynamical tropopause even when the cloud top
5
is close to the thermal tropopause. Two cirrus are found to be unambiguously located well above the local dynamical tropopause. According to high-resolution PV advection calculations, these two clouds are observed inside air masses that originate from the tropical regions and are then transported rapidly to mid-latitudes through isentropic transport. The air mass history for one case is investigated with a 3-D trajectory model.
10
The back-plumes indicate that the air mass, moist with respect to typical stratospheric air, was transported from the subtropical troposphere to the lowermost stratosphere in 4 days before detection above France. A continuous cooling of 5–10◦ along the trajectory took place during its transit. This cooling could have been partly responsible for the thin cirrus layer detected.
15
1. Introduction
The depletion of ozone just above the tropopause region has a limited influence on total ozone column trends and on UV radiation at ground level. However, the Earth’s climate is very sensitive to ozone changes in this region. (Lacis et al., 1990; Ramaswamy et al., 1992). Ozone trends in the lower stratosphere at mid-latitude are notoriously difficult
20
to establish (WMO, 2002). It is acknowledge that ozone has decreased by between 5 and 20% in this region.
The exact reasons for this decline remain unclear. Heterogeneous reactions on aerosol particles are able to destroy significantly ozone at polar latitudes due to very low temperatures prevailing there (Solomon et al., 1986). However, it is not yet clear
25
ACPD
5, 4037–4055, 2005Evidences of thin cirrus clouds in the
stratosphere at mid-latitudes P. Keckhut et al. Title Page Abstract Introduction Conclusions References Tables Figures J I J I Back Close Full Screen / Esc
Print Version Interactive Discussion
EGU depletion (WMO, 1999). The fact that reported ozone trends in the winter spring
sea-sons are twice those obtained for the summer autumn seasea-sons (WMO, 1999) favors a transport contribution rather than an in-situ mechanism. In the recent years, a lot of efforts have been performed on the estimate of the potential ozone decline induced by the transport. The contribution of the transport strongly depends on the
meteorologi-5
cal conditions and the stability of the polar vortex (WMO, 2002) and approximately an average of 40% of the observed decline of the mid-latitude ozone could be attributed to the transport of polar ozone-depleted air into mid-latitudes.
It appears that transport from polar regions cannot be responsible for all the depletion observed at mid-latitude and is not applicable to the summer and autumn trends. It is
10
then necessary to search for other causes such as in situ chemistry.
Borrmann et al. (1996) showed that cirrus clouds might lead to heterogeneous chem-istry similar to the one taking place on Polar Stratospheric Clouds and suggested that these clouds could affect the abundances of ozone. Some observational studies (Re-ichard et al., 1996; Roumeau et al., 2000) have found such diminutions of ozone in the
15
presence of cirrus at both mid-latitude and tropical sites. While several studies (Stowe et al., 1989; Wylie et al., 1994; Wang et al., 1996) reported frequent cirrus clouds near the tropopause, Solomon et al. (1997) suggested that the chemistry associated to these clouds at mid-latitudes may contribute ozone depletion observed at mid-latitudes in the lower stratosphere and would permit to reconcile observed and modeled ozone
20
trends at mid-latitudes (Meilinger et al., 2001).
Some studies have reported cirrus above the thermal tropopause (Sassen et al., 1991; Murphy et al., 1990; Wang et al., 1996). To our best knowledge, no cirrus has been shown to be clearly and unambiguously located in the stratosphere at mid-latitudes. Here we report on the search for cirrus in the stratosphere using the French
25
lidar database acquired in south of France at Observatory of Haute-Provence (OHP). We find some observational evidence that thin cirrus can be observed high enough to be unambiguously classified as a Mid-latitude Stratospheric Cloud type (MSC).
ACPD
5, 4037–4055, 2005Evidences of thin cirrus clouds in the
stratosphere at mid-latitudes P. Keckhut et al. Title Page Abstract Introduction Conclusions References Tables Figures J I J I Back Close Full Screen / Esc
Print Version Interactive Discussion
EGU Sect. 2. Then after a short section on stratospheric cirrus detection, one case observed
during the night of 20 to 21 January 2000 is described and analyzed in Sect. 4. In Sect. 5, the history of the air masse is investigated. And finally conclusions are drawn in Sect. 6.
2. Data and methodology description 5
At Observatory of Haute-Provence in France (44◦N, 6◦E), a program of systematic lidar soundings has been running for two decades. Despite being mainly devoted to strato-spheric observations as part of the Network of Detection of Stratostrato-spheric Changes (Kurylo and Solomon, 1990), the troposphere is also investigated simultaneously with similar techniques. Clouds with optical depths, as small as 0.03, can be detected with
10
the system because measurements are performed at night with a powerful lidar and a small field of view of the receiver. In addition, the thickness of the clouds can be ac-curately determined because the vertical resolution of the measurements is only 75 m. As described in Goldfarb et al. (2001), the presence of cloud is determined when the signal is greater than a threshold equal to three times the standard deviation of the
15
scattering ratio at the cloud height.
A climatology of cirrus clouds at mid-latitudes has been derived from 3 years of lidar data (Goldfarb et al., 2001). It has shown that cirrus were present half the time and that about half of them could be classified as sub-visible cases according to the definition of Sassen (1989). Goldfarb et al. (2001) also reported that most of the cirrus were located
20
just below the thermal tropopause (according to the WMO definition) but many of them were partly observed above the thermal tropopause. The thermal tropopause was de-termined from systematic radio-soundings performed at Nˆımes by the French meteoro-logical center (M ´et ´eo-France), about 110 km westward from the lidar site. As a result of this separation, the temperature at the cirrus height could not expected to be accurate
25
by less than a few K. More importantly, the thermal tropopause is not the best criteria for distinguishing tropospheric from stratospheric air. A preferred criteria is based on
ACPD
5, 4037–4055, 2005Evidences of thin cirrus clouds in the
stratosphere at mid-latitudes P. Keckhut et al. Title Page Abstract Introduction Conclusions References Tables Figures J I J I Back Close Full Screen / Esc
Print Version Interactive Discussion
EGU the potential vorticity (PV). When diabatic and turbulent effects can be neglected, the
potential vorticity of an air parcel is conserved along its three dimensional trajectory. On a time scale of few days, it is almost the case in the stratosphere. A threshold value of 1.6 PVU (PV units) for the tropopause has been defined by WMO (1986) and Hoerling et al. (1991) suggest to consider 3.5 PVU threshold value. So instead of
con-5
sidering tropopause as a sharp transition, a smoother transition zone can be defined by these two PV thresholds.
Due to the need for a PV estimate, collocated with cloud observations, a three-dimensional high-resolution PV advection model called MIMOSA (Mod `ele Isentropique de transport M ´eso- ´echelle de l’Ozone Stratosph ´erique par Advection) is used to
de-10
rive the PV profile above the OHP station (Fig. 1). The model is forced by ECMWF daily analyses. The advection of PV takes place on isentropic surfaces. PV is also relaxed towards ECMWF analyses with a time constant of 10 days. The advection scheme is semi-Lagrangian. More details on the model can ne found in Hauchecorne et al. (2002). The ability of MIMOSA to describe small-scale-structures through the
15
advection of PV as a quasi-passive tracer has already been demonstrated in the up-per troposphere – lower stratosphere domain (Hauchecorne et al., 2002; Heese et al., 2001). A typical PV profiles depict small values (around or smaller than 1 PVU) for potential temperature below a 330 Kelvin (approximately 12 km) and then, due to the static stability of the stratosphere, exhibit a rapid and monotone increase with values
20
around 8 PVU at 400 Kelvin (16 km).
In order to determine the geographical origins and the thermal history of air masses, reverse plume dispersion calculations are performed using the FLEXPART model (ver-sion 5.1) that is extensively described in Stohl (1998). The trajectory model is driven by ECMWF ERA40 reanalysis with 1◦ horizontal resolution, 60 vertical levels and 3 h
25
time resolution (ECMWF, 1995). The code permits to advect large plumes of passive tracer by reverse non-isentropic three dimensional transport including parametriza-tion of sub-grid scale orographic processes and convecparametriza-tion following the formulaparametriza-tion of Emanuel and Zivkovic-Rothman (1999) designed for improving convection in
tropi-ACPD
5, 4037–4055, 2005Evidences of thin cirrus clouds in the
stratosphere at mid-latitudes P. Keckhut et al. Title Page Abstract Introduction Conclusions References Tables Figures J I J I Back Close Full Screen / Esc
Print Version Interactive Discussion
EGU cal region. Even though simulation is initialized in the stratosphere, convective scheme
was turned on since, as preliminary analysis suggested, a tropical origin is suspected for air masses of interest. A last specificity of Flexpart consists in accounting for stochastic fluctuation by solving Langevin equations in the plume dispersion modelling (Stohl and Thomson, 1999). The transport calculations by FLEXPART is expected to
5
be slightly more reliable the isentropic transport by MIMOSA because the trajectories are 3-D (cross-isentropic transport is accounted for). It also includes a random com-ponent for a representation of the effect of turbulence that permits to reproduce more realistically the spreading of cluster trajectories.
3. Stratospheric cases identification 10
During the first three months of 2000, 58 nights of lidar operations were conducted, and cirrus clouds were observed on 27 nights. A similar frequency of occurrence was obtained on a larger lidar data set (Goldfarb et al., 2001). Ten cirrus, among all the 27 detections, were found to be located in the stratosphere when the tropopause is calculated according to the thermal gradient. However, only two of them are found
15
above the dynamical tropopause defined as 1.6 PVU surface calculated from MIMOSA fields. This corresponds to a frequency of occurrence of 3–4% for stratospheric ice clouds. Some sharp horizontal gradients (Fig. 3) can be noted that may explain the disagreement with the previous estimates of the location of the cirrus according to the thermal tropopause (Goldfarb et al., 2001).
20
4. Case study
We now focus our attention on the highest cirrus. During the night of 20 to 21 January, a thin cloud (Fig. 2) was detected between 13.5 and 13.9 km (respectively 367 to 374 K) from 20:50 to 22:00 UT above OHP. Another cirrus is present at lower altitude (8–10 km)
ACPD
5, 4037–4055, 2005Evidences of thin cirrus clouds in the
stratosphere at mid-latitudes P. Keckhut et al. Title Page Abstract Introduction Conclusions References Tables Figures J I J I Back Close Full Screen / Esc
Print Version Interactive Discussion
EGU in the troposphere during a longer period with a mean backscattering ratio of nearly a
magnitude larger than the upper cloud that exhibited a mean backscattering during the whole period of 1.5. The thermal tropopause is at 11.1 km or in potential temperature at 325 K (estimated from the radiosonde profiles).
The PV field shows a very disturbed situation (Figs. 3, 4). The PV profile above OHP
5
at midnight on 20 January, indicates a threshold value of 1.6 PVU at 310 K (Fig. 1). A fine structure of tropospheric air centered at 325 K (see Fig. 3) is noticeable above this level and then the PV profile crosses again the 1.6 PVU threshold at 332 K. If the upper limit (3.5 PVU) proposed by Hoerling et al. (1991) is used instead then the potential temperature covered by the tropopause region can extend as high as 340 K.
10
This cloud appears to be clearly well above the tropopause whatever the definition of it. Around the altitude of the cloud a slight PV anomaly can be noticed suggest-ing a possible origin from a region close to the tropopause or even the troposphere. Nonetheless, the PV themselves within the anomaly remains large and characteristic of stratospheric conditions. The cloud seems to located in the upper part of the PV
15
anomaly. This might be due to the fact that the temporal coincidence is not perfect (PV profile at midnight, cirrus detected between 20:50 to 22:00). The meridional section of the PV shows that this structure extends to up to 400 K (Fig. 3).
The anomaly is caused by a laminae structure that forms about a week before, and passes over the lidar location during the night of 20 to 21 January. This structure
20
found its origin in the tropical area. The structure appears clearly more than 5 days before detection above OHP and its development can be decomposed in the model simulations day after day with a twisted motion on the isentropic plan before being observed above France. It then moves southward, out of France and dissipates (at least in the MIMOSA model).
25
Plume dispersion computation calculated using a different advection tool, the FLEX-PART model, show also that air masses are first coming from England after crossing the Atlantic northward from the Bermudes. The FLEXPART simulation is initialized by releasing 20 000 air parcels in 20 January 2000, uniformly spread between 18:00 and
ACPD
5, 4037–4055, 2005Evidences of thin cirrus clouds in the
stratosphere at mid-latitudes P. Keckhut et al. Title Page Abstract Introduction Conclusions References Tables Figures J I J I Back Close Full Screen / Esc
Print Version Interactive Discussion
EGU 24:00 UT within a spatial box of 10◦ in longitude 5◦ in latitude centered on the OHP
station (43◦560N, 5◦420E), and within an altitude range from 12 and 16 Km above see level (Fig. 5). A large domain was initially chosen to take into account possible drifts of the advection caused by non-perfect meteorological analyses. Among these parcels, about 3604 are released at the altitude of the observed cirrus (13.5 to 13.9 km)
includ-5
ing 310 that are coming from the troposphere.
The length of the trajectory and the time for transit from the troposphere up to the stratosphere above OHP, are in good agreement with the statistical study of Fueglistaler (2004) based on ECMWF trajectories. The analysis shows median length of several tenth thousand kilometers from Africa and South America with a residence
10
time around the 360 K level of few days.
The origin of the subset of air masses having encountered the troposphere during the 6 previous days has been identified on FLEXPART simulations and compared with the initial volume of individual air parcels (Fig. 5). The most peculiar feature of this plume structure is its thin filament-like pattern very similar to the MIMOSA pattern although
15
initial air parcel emission was done within a broader rectangular spatial domain for 10×5◦.
5. Air mass history
The envelope of the altitude of the air parcel reveals that corresponds to the subset of cases exhibiting an origin at altitudes lower than the tropopause (Fig. 6). Tropopause
20
definition in Flexpart relies on a thermal definition equatorward of 20◦and a dynamical one poleward of 30◦with linear interpolation of both definition between these two limits (James et al., 2003). Tropopause was crossed 3–4 days before the cloud observation as shown on Fig. 6 where air masses were advected northward and eastward towards England.
25
In addition to the cloud occurrence statistic, a lot of uncertainty remains about the formation and persistence of the MLC. With a single measurement, it is difficult to
ACPD
5, 4037–4055, 2005Evidences of thin cirrus clouds in the
stratosphere at mid-latitudes P. Keckhut et al. Title Page Abstract Introduction Conclusions References Tables Figures J I J I Back Close Full Screen / Esc
Print Version Interactive Discussion
EGU know if ice crystals were transported or if moist air froze as air crossed the cold point.
Holton and Gettelmen (2001) pointed out the importance of horizontal motion for cloud formation and dehydration in the TTL, while Jensen et al. (2004) mentioned that the cloud lifetime along the trajectories into mid-latitude regions are typically no longer than a or two days.
5
In our case, while air masses enter the stratosphere, temperatures continuously de-creases (Fig. 6) by 5–10◦. The air laminae, is expected to be humid with respect to the surrounding stratospheric air because of its subtropical tropospheric origin. This moist air may freeze into ice crystal as temperature drops. At the same time, this air parcel would be losing its integrity during transit due to mixing processes. At the cloud
10
altitude, water vapor, given by the meteorological analyses, are not reliable enough to calculate ice saturation level.
It is worth pointing out that the ozone levels in this air mass must have been low because of its tropospheric origin. Unfortunately, no ozone measurements were made on that day.
15
6. Discussion and conclusions
This observational study shows that mid-latitude Stratospheric Clouds can exist under certain conditions. The mechanism of isentropic transport of subtropical tropospheric air into the mid-latitude stratosphere is not new and is an evident source of moist air into the stratosphere. The significance of this source cannot be assessed from this
20
case study. The data set analyzed here is too small to have a reliable estimate of the occurrence of such clouds that form within air masses transported from the upper tropical troposphere.
This case is a good illustration of air transport from the troposphere to the stratosphere through what Sherwood and Dessler (2000) termed the TTL (Tropical
25
Tropopause Layer) or sub-stratosphere (Thuburn and Craig, 2002). This layer is de-limited by the level of zero net radiative heating (350 K), and the highest level reached
ACPD
5, 4037–4055, 2005Evidences of thin cirrus clouds in the
stratosphere at mid-latitudes P. Keckhut et al. Title Page Abstract Introduction Conclusions References Tables Figures J I J I Back Close Full Screen / Esc
Print Version Interactive Discussion
EGU by convection (420 K). The main conceptual idea for the entry of air from the
strato-sphere is the Brewer-Dobson circulation. This case (as many other) shows that this happens through fine structures of respectively few kilometers vertically and section of few hundred of kilometers that can extend over thousand kilometers that are likely to be irreversible. This observation provides a good support of the statistic analysis of
5
Fueglistaler (2004) that predicts the transport of moist air from the tropical tropopause to the stratosphere based on meteorological analyses.
The presence of cirrus clouds in the lowermost stratosphere does not imply that the heterogeneous chemistry operating on them is significant for the ozone budget as speculated by Solomon et al. (1997). First, tropical upper tropospheric air contains
10
very low amounts of chlorine and bromine. Second, mixing with the surrounding air is required to allow an efficient chemical processing of large volumes of stratospheric air. This situation is less favorable for ozone destruction, than the polar situation where large volumes of stratospheric air can be processed by the usually stationary polar stratospheric clouds, with air flowing through them. The persistence of those thin
15
clouds is uncertain. On the other hand, these thin moist structures that penetrate the stratosphere offer large surfaces of contact with stratospheric ozone rich air on the edge of filamentary structures on regional and planetary scale. More data are required to quantify the occurrence of such clouds and the exact surface of contact.
The cirrus formation through subtropical moist tropospheric air can be an efficient
20
mechanism for water vapor transport and dehydration of the TTL. Cirrus formation must be taken into account to explain water vapor distribution in the lower stratosphere.
Data from space as those available by CALIPSO should offer a global view and al-low a better characterization of the history of the clouds as soon as they exhibit optical depth sufficiently large for detection.. OHP database will continue to be analyzed with
25
special attention on cases when simultaneous ozone and water vapor lidar measure-ments are available.
Acknowledgements. Authors would like to acknowledge B. Nicaise and B. Lelong who
ACPD
5, 4037–4055, 2005Evidences of thin cirrus clouds in the
stratosphere at mid-latitudes P. Keckhut et al. Title Page Abstract Introduction Conclusions References Tables Figures J I J I Back Close Full Screen / Esc
Print Version Interactive Discussion
EGU
The quality and the high frequency of observations are due to the continuous efforts of OHP team and engineers from Service d’A ´eronomie. A. Stohl is acknowledged for helpful advices on the Flexpart model and ECMWF is also acknowledged for providing meteorological re-analyses. This work was performed under the framework of the EU program PARTS “Particles In The Up-per Troposphere And Lower Stratosphere And Their Role in the Climate System” and the EU 5
COST action “Data Exploitation and Modeling for the Upper Troposphere and Lower Strato-sphere”.
References
Borrmann, S., Solomon, S. S., Dye, J. E., and Luo, B.: The potential of cirrus clouds for hetero-geneous chlorine in the middle and lower atmosphere, Geophys. Res. Lett., 23, 2133–2136, 10
1996.
ECMWF: User Guide to ECMWF Products 2.1, Meteorol. Bull. M3.2, ECMWF, Reading, UK, 1995.
Emanuel, K. A. and Zivkovic-Rothman, M.: Development and evaluation of a convection scheme for use in climate models, J. Atmos. Sci., 56, 1766–1782, 1999.
15
Fueglistaler, S., Wernli, H., and Peter, T.: Tropical troposphere-to-stratosphere transport inferred from trajectory calculations, J. Geophy. Res., 109, D03108, doi:10.1029/2003JD004069, 2004.
Goldfarb, L., Keckhut, P., Chanin, M.-L., and Hauchecorne, A.: Cirrus climatological results from lidar measurements at OHP (44◦N, 6◦E), Geophys. Res. Lett., 28, 1687–1690, 2001. 20
Hauchecorne, A., Godin, S., Marchand, M., Heese, B., and Souprayen, C.: Quantification of the transport of chemical constituents from the polar vortex to middle latitudes in the lower stratosphere using the high-resolution advection model MIMOSA and effective diffusivity, J. Geophys. Res., 107, doi:10.1029/2001JD000491, 2002.
Heese, B., Godin, S., and Hauchecorne, A.: Forecast and simulation of stratospheric ozone fila-25
ments: A validation of a high-rersolution potential vorticity advection model by airborne ozone lidar measurements in winter 1998/1999, J. Geophys. Res., 106, 20 011–20 024, 2001. Hoerling, M., Schaak, T., and Lenzen, A.: Global objective tropopause analysis, Mon. Weather
ACPD
5, 4037–4055, 2005Evidences of thin cirrus clouds in the
stratosphere at mid-latitudes P. Keckhut et al. Title Page Abstract Introduction Conclusions References Tables Figures J I J I Back Close Full Screen / Esc
Print Version Interactive Discussion
EGU
Holton, J. R. and Gettelmen, A.: Horizontal transport and the dehydration of the stratosphere, Geophys. Res. Lett., 28, 2799–2802, 2001.
James, P., Stohl, A., Forster, C., Eckhardt, S., Seibert, P., and Frank, A.: A 15-year climatology of stratosphere-troposphere exchange with a Lagrangian particle dis-persion model: 1. Methodology and validation, J. Geophys. Res., 108 (D12), 8519, 5
doi:10.1029/2002JD002637, 2003.
Jensen, E. J. and Pfister, L.: Transport and freeze-drying in the tropical tropopause layer, J. Geophys. Res., 109, doi:1.1029/2003JD004022, 2004.
Kurylo, M. J. and Solomon, S.: Network for the Detection of Stratospheric Change, NASA Report, Code EEU, 1990.
10
Lacis, A. A., Wuebbles, D. J., and Logan, J. A.: Radiative forcing of climate by changes in the vertical distribution of ozone, J. Geophy. Res., 95, 9971–9981, 1990.
Meilinger, S. K., K ¨archer, B., von Kuhlmann, R., and Peter, Th.: On the impact of heterogeneous chemistry on ozone in the tropopause region, Geophys. Res. Lett., 28, 515–518, 2001. Murphy, D. M., Kelly, K. K., Tuck, A. F., Proffitt, M. H., and Kinne, S.: Ice saturation at the 15
tropopause observed from the ER-2 aircraft, Geophys. Res. Lett., 17, 353–356, 1990. Ramaswamy, V., Schwarzkopf, M. D., and Shine, K. P.: Radiative forcing of climate from
halocarbon-induced global stratospheric ozone loss, Nature, 355, 810–812, 1992.
Reichard, J., Ansmann, A., Serwazi, M., Weitkamp, C., and Michaelis, W.: Unexpectedly low ozone concentration in mid-latitude tropospheric ice clouds: A case study, Geophys. Res. 20
Lett., 23, 1929–1932, 1996.
Roumeau, S., Br ´emaud, P., Rivi `ere, E., Baldy, S., and Baray, J. L.: Tropical cirrus clouds: a possible sink for ozone, Geophys. Res. Lett, 27, 2233–2236, 2000.
Sassen, K.: Corona-producing cirrus cloud properties derived from polarization lidar and pho-tographic analyses, Appl. Opt., 30, 3421–3552, 1991.
25
Sassen, K., Griffin, M. K., and Dodd, G. C.: Optical scattering and microphysical properties of subvisible cirrus clouds, and climatic implications, J. Appl. Meteor., 28, 91–98, 1989.
Sherwood, S. C. and Dessler, A. E.: On the control of stratospheric humidity, Geophys. Res. Lett., 27, 2513–2516, 2000.
Solomon, S., Garcia, R. R., Rowland, F. S., and Wuebbles, D. J.: On the depletion of Antarctic 30
ozone, Nature, 321, 755–758, 1986.
Solomon, S., Borrmann, S., Garcia, R. R., Portmann, R., Thomason, L., Poole, L. R., Winker, D., and McCormick, P.: Heterogeneous chlorine chemistry in the tropopause region, J.
Geo-ACPD
5, 4037–4055, 2005Evidences of thin cirrus clouds in the
stratosphere at mid-latitudes P. Keckhut et al. Title Page Abstract Introduction Conclusions References Tables Figures J I J I Back Close Full Screen / Esc
Print Version Interactive Discussion
EGU
phys. Res., 102, 21 411–21 429, 1997.
Stohl, A. and Thomson, D. J.: A density correction for Lagrangian particle dispersion models, Boundary Layer Meteorol., 90, 155–167, 1999.
Stohl, A., Hittenberger, M., and Wotawa, G.: Validation of the Lagrangian particle dispersion model FLEXPART against large scale tracer experiment data, Atmos. Environ., 24, 4245– 5
4264, 1998.
Stone, L. L., Yeh, H. Y. M., Eck, T. F., Wellemeyer, C. G., and Kyle, H. L.: The Nimbus-7 cloud data processing team, Nimbus-7 global cloud climatology, II First year results, Ann. Meteorol. Soc., 671–709, 1989.
Thuburn, J. and Craig, G. C.: On the temperature structure of the tropical substratosphere, J. 10
Geophys. Res., 107, doi:10.1029/2001JD000448, 2002.
Wang, P. H., Minnis, P., McCormick, M. P., Kent, G. S., and Skeens, K. M.: A 6-year clima-tology of cloud occurrences frequency from Stratospheric Aerosol and Gas Experiment II observations (1985–1990), J. Geophys. Res., 101, 29 407–29 429, 1996.
World Meteorological Organization: Scientific Assessment of ozone depletion, 1985, in: Global 15
Ozone research and Monitoring Project, WMO Rep. 16, Geneva, 1986.
World Meteorological Organization: Scientific Assessment of ozone depletion, 1998, in: Global Ozone research and Monitoring Project, WMO Rep. 44, Geneva, 1999.
World Meteorological Organization: Scientific Assessment of ozone depletion, 2001, in: Global Ozone research and Monitoring Project, WMO Rep. 46, Geneva, 2002.
20
Wylie, D. P., Menzel, W. P., Woolf, H. M., and Strabala, K. I.: Four years of global cirrus cloud statistics using HIRS, J. Clim., 7, 1972–1986, 1994.
ACPD
5, 4037–4055, 2005Evidences of thin cirrus clouds in the
stratosphere at mid-latitudes P. Keckhut et al. Title Page Abstract Introduction Conclusions References Tables Figures J I J I Back Close Full Screen / Esc
Print Version Interactive Discussion
EGU
4
value. So instead of considering tropopause as a sharp transition, a smoother transition zone can be defined by these two PV thresholds.
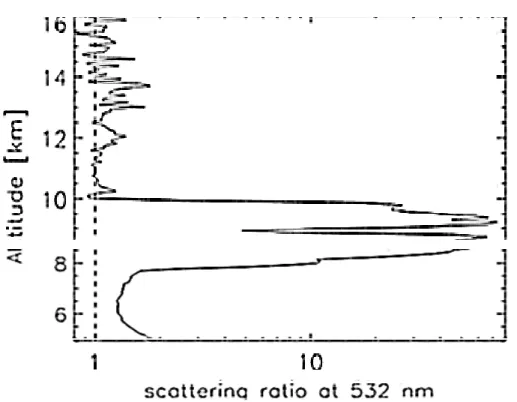
Due to the need for a PV estimate, collocated with cloud observations, a three-dimensional high-resolution PV advection model called MIMOSA (Modèle Isentropique de transport Méso-échelle de l’Ozone Stratosphérique par Advection) is used to derive the PV profile above the OHP station (Figure 1). The model is forced by ECMWF daily analyses. The advection of PV takes place on isentropic surfaces. PV is also relaxed towards ECMWF analyses with a time constant of 10 days. The advection scheme is semi-Lagrangian. More details on the model can ne found in Hauchecorne et al. (2002). The ability of MIMOSA to describe small-scale-structures through the advection of PV as a quasi-passive tracer has already been demonstrated in the upper troposphere – lower stratosphere domain (Hauchecorne et al, 2002, Heese et al., 2001). A typical PV profiles depict small values (around or smaller than 1 PVU) for potential temperature below a 330 Kelvin (approximately 12 km) and then, due to the static stability of the stratosphere, exhibit a rapid and monotone increase with values around 8 PVU at 400 Kelvin (16 km).
Figure 1. Vertical profile of the potential vorticity for January 20 at midnight. The top and
bottom heights of high altitude cloud around 370 K are reported and the level of the thermal tropopause around 325 K is indicated with a dashed line.
Fig. 1. Vertical profile of the potential vorticity for January 20 at midnight. The top and bottom
heights of high altitude cloud around 370 K are reported and the level of the thermal tropopause around 325 K is indicated with a dashed line.
ACPD
5, 4037–4055, 2005Evidences of thin cirrus clouds in the
stratosphere at mid-latitudes P. Keckhut et al. Title Page Abstract Introduction Conclusions References Tables Figures J I J I Back Close Full Screen / Esc
Print Version Interactive Discussion
EGU
6
Figure 2. Mean vertical backscattering ratio profile obtained with the lidar at OHP from
20:50 to 22:00 UT on January, 20
th2000.
4. Case study
We now focus our attention on the highest cirrus. During the night of January 20
thto
21
th, a thin cloud (Figure 2) was detected between 13,5 and 13,9 km (respectively 367 to 374
K) from 20:50 to 22:00 UT above OHP. Another cirrus is present at lower altitude (8-10 km)
in the troposphere during a longer period with a mean backscattering ratio of nearly a
magnitude larger than the upper cloud that exhibited a mean backscattering during the whole
period of 1.5.
The thermal tropopause is at 11,1 km or in potential temperature at 325
K(estimated from the radiosonde profiles).
The PV field shows a very disturbed situation (figure 3, 4). The PV profile above OHP
at midnight on January 20
th, indicates a threshold value of 1.6 PVU at 310 K (Figure 1). A
fine structure of tropospheric air centered at 325 K (see figure 3) is noticeable above this level
and then the PV profile crosses again the 1.6 PVU threshold at 332 K. If the upper limit (3.5
PVU) proposed by Hoerling et al. (1991) is used instead then the potential temperature
covered by the tropopause region can extend as high as 340 K.
Fig. 2. Mean vertical backscattering ratio profile obtained with the lidar at OHP from 20:50 to
22:00 UT on 20 January 2000.
ACPD
5, 4037–4055, 2005Evidences of thin cirrus clouds in the
stratosphere at mid-latitudes P. Keckhut et al. Title Page Abstract Introduction Conclusions References Tables Figures J I J I Back Close Full Screen / Esc
Print Version Interactive Discussion
EGU
7
This cloud appears to be clearly well above the tropopause whatever the definition of
it. Around the altitude of the cloud a slight PV anomaly can be noticed suggesting a possible
origin from a region close to the tropopause or even the troposphere. Nonetheless, the PV
themselves within the anomaly remains large and characteristic of stratospheric conditions.
The cloud seems to located in the upper part of the PV anomaly. This might be due to the fact
that the temporal coincidence is not perfect (PV profile at midnight, cirrus detected between
20:50 to 22:00). The meridional section of the PV shows that this structure extends to up to
400 K (Figure 3).
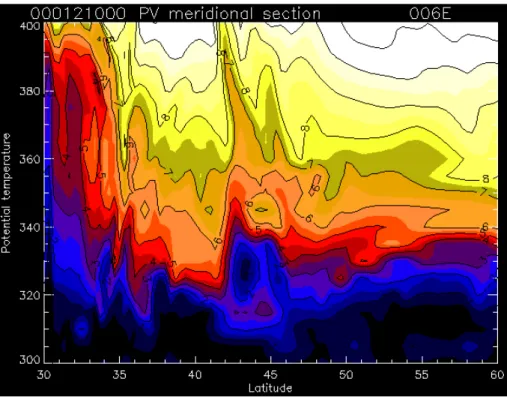
Figure 3. PV meridional section, for latitudes from 30 to 60°N, at the OHP longitude, as
deduced from the MIMOSA model for January 20
that midnight. The vertical structure is
given for potential temperature from 300 to 400 K. The light-blue-purple colors correspond to
air associated to the tropopause region, while orange yellow white colors indicate large PV
values associated to stratospheric air.
The anomaly is caused by a laminae structure that forms about a week before, and
passes over the lidar location during the night of January 20 to 21rst. This structure found its
origin in the tropical area. The structure appears clearly more than 5 days before detection
above OHP and its development can be decomposed in the model simulations day after day
Fig. 3. PV meridional section, for latitudes from 30 to 60◦N, at the OHP longitude, as deduced from the MIMOSA model for 20 January at midnight. The vertical structure is given for potential temperature from 300 to 400 K. The light-blue-purple colors correspond to air associated to the tropopause region, while orange yellow white colors indicate large PV values associated to stratospheric air.
ACPD
5, 4037–4055, 2005Evidences of thin cirrus clouds in the
stratosphere at mid-latitudes P. Keckhut et al. Title Page Abstract Introduction Conclusions References Tables Figures J I J I Back Close Full Screen / Esc
Print Version Interactive Discussion
EGU with a twisted motion on the isentropic plan before being observed above France. It then
moves southward, out of France and dissipates (at least in the MIMOSA model).
Figure 4. PV map on a geographical sector including Europe. The potential vorticity is given for potential temperature corresponding to the top (374 K) and the bottom (367 K) part of the cloud.
Fig. 4. PV map on a geographical sector including Europe. The potential vorticity is given for
potential temperature corresponding to the top (374 K) and the bottom (367 K) part of the cloud.
ACPD
5, 4037–4055, 2005Evidences of thin cirrus clouds in the
stratosphere at mid-latitudes P. Keckhut et al. Title Page Abstract Introduction Conclusions References Tables Figures J I J I Back Close Full Screen / Esc
Print Version Interactive Discussion
EGU
9
Plume dispersion computation calculated using a different advection tool, the FLEXPART
model, show also that air masses are first coming from England after crossing the Atlantic
northward from the Bermudes. The LEXPART simulation is initialized by releasing 20,000
air parcels in January 20
th, 2000, uniformly spread between 18:00 and 24:00 UT within a
spatial box of 10° in longitude 5° in latitude centered on the OHP station (43°56’N, 5°42’E),
and within an altitude range from 12 and 16 Km above see level (Figure 5). A large domain
was initially chosen to take into account possible drifts of the advection caused by non-perfect
meteorological analyses. Among these parcels, about 3604 are released at the altitude of the
observed cirrus (13,5 to 13,9 km) including 310 that are coming from the troposphere.
The length of the trajectory and the time for transit from the troposphere up to the
stratosphere above OHP, are in good agreement with the statistical study of Fueglistaler
(2004) based on ECMWF trajectories. The analysis shows median length of several tenth
thousand kilometers from Africa and South America with a residence time around the 360 K
level of few days.
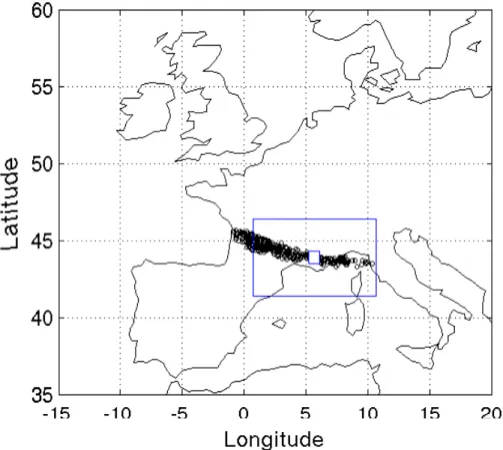
Figure 5. Geographical position on January 20
th, 2000 at 18:00 of air parcels released at the
altitude of the cirrus and that have gone below the thermal tropopause (backwards in time).
The rectangle box corresponds to the spatial domain where back-trajectories were initialized.
The origin of the subset of air masses having encountered the troposphere during the 6
previous days has been identified on FLEXPART simulations and compared with the initial
Fig. 5. Geographical position on 20 January 2000 at 18:00 of air parcels released at the
altitude of the cirrus and that have gone below the thermal tropopause (backwards in time). The rectangle box corresponds to the spatial domain where back-trajectories were initialized.
ACPD
5, 4037–4055, 2005Evidences of thin cirrus clouds in the
stratosphere at mid-latitudes P. Keckhut et al. Title Page Abstract Introduction Conclusions References Tables Figures J I J I Back Close Full Screen / Esc
Print Version Interactive Discussion
EGU
10
volume of individual air parcels (Figure 5). The most peculiar feature of this plume structure
is its thin filament-like pattern very similar to the MIMOSA pattern although initial air parcel
emission was done within a broader rectangular spatial domain for 10x5°. The number of air
parcel satisfying both criteria, arrival at the altitude of the cirrus (13,5-13,9 Km) and a stay in
the troposphere, is 890.
5. Air mass history
The envelope of the altitude of the air parcel reveals that corresponds to the subset of
cases exhibiting an origin at altitudes lower than the tropopause (Figure 6). Tropopause
definition in Flexpart relies on a thermal definition equatorward of 20° and a dynamical one
poleward of 30° with linear interpolation of both definition between these two limits (James et
al., 2003). Tropopause was crossed 3-4 days before the cloud observation as shown on figure
6 where air masses were advected northward and eastward towards England.
Figure 5. Envelopes of altitude relative to the tropopause (top panel), and of the
corresponding temperatures (bottom panel), for a cluster of air back-trajectories, starting from
OHP on January 20
that night. Simulations are based on meteorological analyses and
FLEXPART simulations.
Fig. 6. Envelopes of altitude relative to the tropopause (top panel), and of the corresponding
temperatures (bottom panel), for a cluster of air back-trajectories, starting from OHP on 20 Jan-uary at night. Simulations are based on meteorological analyses and FLEXPART simulations.