HAL Id: hal-02969956
https://hal.archives-ouvertes.fr/hal-02969956
Submitted on 17 Oct 2020
HAL is a multi-disciplinary open access
archive for the deposit and dissemination of
sci-entific research documents, whether they are
pub-lished or not. The documents may come from
teaching and research institutions in France or
abroad, or from public or private research centers.
L’archive ouverte pluridisciplinaire HAL, est
destinée au dépôt et à la diffusion de documents
scientifiques de niveau recherche, publiés ou non,
émanant des établissements d’enseignement et de
recherche français ou étrangers, des laboratoires
publics ou privés.
Reflectance spectroscopy to validate remote sensing
data/algorithms for satellite-based lithium (Li)
exploration (Central East Portugal)
Joana Cardoso-Fernandes, João Silva, Alexandre Lima, Ana Claudia Teodoro,
Monica Perrotta, Jean Cauzid, Encarnacion Roda-Robles, Maria dos Anjos
Ribeiro
To cite this version:
Joana Cardoso-Fernandes, João Silva, Alexandre Lima, Ana Claudia Teodoro, Monica Perrotta, et al..
Reflectance spectroscopy to validate remote sensing data/algorithms for satellite-based lithium (Li)
exploration (Central East Portugal). SPIE Remote Sensing„ Sep 2020, Online Only, France. pp.19,
�10.1117/12.2573929�. �hal-02969956�
PROCEEDINGS OF SPIE
SPIEDigitalLibrary.org/conference-proceedings-of-spie
Reflectance spectroscopy to validate
remote sensing data/algorithms for
satellite-based lithium (Li) exploration
(Central East Portugal)
Cardoso-Fernandes, J., Silva, J., Lima, A., Teodoro, A. C.,
Perrotta, M., et al.
J. Cardoso-Fernandes, J. Silva, A. Lima, A. C. Teodoro, M. Perrotta, J.
Cauzid, E. Roda-Robles, M. A. Ribeiro, "Reflectance spectroscopy to validate
remote sensing data/algorithms for satellite-based lithium (Li) exploration
(Central East Portugal)," Proc. SPIE 11534, Earth Resources and
Environmental Remote Sensing/GIS Applications XI, 115340M (20 September
2020); doi: 10.1117/12.2573929
Event: SPIE Remote Sensing, 2020, Online Only
Reflectance spectroscopy to validate remote sensing data/algorithms
for satellite-based lithium (Li) exploration (Central East Portugal)
J. Cardoso-Fernandes*
a,b, J. Silva
a, A. Lima
a,b, A. C. Teodoro
a,b, M. Perrotta
c, J. Cauzid
d, E.
Roda-Robles
e, M. A. Ribeiro
a,ba
Department of Geosciences, Environment and Land Planning, Faculty of Sciences, University of
Porto, Rua Campo Alegre, Porto, Portugal;
bInstitute of Earth Sciences (ICT), Pole of University of
Porto, Porto, Portugal;
cGeology and Mineral Resources Board of Directors, Geological Survey of
Brazil (CPRM), Rua Costa, São Paulo, Brazil;
dLaboratoire GeoRessources, Université de Lorraine,
CNRS, GeoRessources, F-54000 Nancy, France;
eDepartament of Mineralogía y Petrología,
University of País Vasco (UPV/EHU), Barrio Sarriena, Leioa, Bilbao, Spain
ABSTRACT
The acquisition of field data plays an important role in the calibration of the remotely sensed data, especially when combined with reflectance spectroscopy studies. The study area of this work is the Fregeneda-Almendra pegmatite field (spreading from Portugal to Spain) where different lithium (Li)-pegmatites are known. Several image processing techniques were applied to satellite images for Li exploration in the region, including machine learning classifiers. However, these algorithms identified several zones as Li-pegmatites false positives. Taking this into account, the following objectives were delineated: (i) validate the training areas used in previous studies and collect field data for training area refinement; (ii) assess the reason for the false positives previously obtained through field surveys. For that, various outcropping lithologies (Li-pegmatite, metasediments, granite) were sampled for laboratory spectral analysis. The spectral signature of Li-pegmatite was compared with the remaining outcropping lithologies. Also, the spectral signature of the sampled false positive areas was confronted with the spectra of Li-minerals. It was possible to conclude that these two classes present similar water/hydroxide and Al–OH-related features. The sampled granitic and metasedimentary rocks also presented water and/or hydroxide absorption features that can lead to some spectral confusion. However, Li-pegmatites can be discriminated from the remaining lithologies either in the training areas and the false positive areas due to the absence of iron-related absorption features and to the distinct reflectance magnitudes. Keywords: Remote sensing; spectral library; geology; field validation; pegmatite; lithium
1. INTRODUCTION
Reflectance spectroscopy is an extensively used technique to identify minerals mainly due to the existence of diagnostic absorption wavelengths intervals in the visible and infrared regions [1, 2]. This technique is mainly applied to characterize the products of hydrothermal alteration, with increasing economic applications in the mineral industry [3]. Field data acquisition is important to calibrate the remotely sensed data: the reflectance spectroscopy studies, either made in the laboratory or directly in the field, provide a calibration source (ground-check) of the remotely sensed data and allow to validate the atmospheric corrections made to satellite-acquired images.
In this study, field validation and sample collection were made in the Portuguese side of the Fregeneda-Almendra pegmatite field that spreads from Salamanca (Spain) to Vila Nova de Foz Côa (Portugal). In recent years, several image processing techniques were applied to satellite images covering this region to identify lithium (Li)-pegmatites [4-6]. These techniques included machine learning algorithms such as Support Vector Machine (SVM) and Random Forest (RF) [6]. Although these algorithms were able to identify the presence of Li-pegmatite in areas where its occurrence is known, they also identified several zones as Li-pegmatites false positives. Therefore, it is fundamental to develop detailed studies to understand if the misclassifications obtained using satellite images are due to a similar spectral behavior between lithologies or to a flaw in the methodology developed.
Earth Resources and Environmental Remote Sensing/GIS Applications XI, edited by Karsten Schulz, Proc. of SPIE Vol. 11534, 115340M · © 2020
SPIE · CCC code: 0277-786X/20/$21 · doi: 10.1117/12.2573929 Proc. of SPIE Vol. 11534 115340M-1
Downloaded From: https://www.spiedigitallibrary.org/conference-proceedings-of-spie on 20 Sep 2020 Terms of Use: https://www.spiedigitallibrary.org/terms-of-use
Taking this into account, the following objectives were delineated: (i) validation of the training areas used in previous studies and collection of new field data for training area improvement and refinement; (ii) assessment of the reason of the false positives previously obtained with SVM and RF [6] through field surveys.
2. FIELD SURVEYS AND REFLECTANCE SPECTROSCOPY
2.1 Study area and fieldwork
The Fregeneda-Almendra pegmatite field spreads from Portugal to Spain, in the central part of the Iberian Massif. In this field, several barren and Li-mineralized pegmatites were identified [7, 8]. The Li-mineralized pegmatites were divided into four distinct types of dikes: petalite-bearing, spodumene-bearing, lepidolite+spodumene-bearing, and lepidolite-bearing. The pegmatite dikes intruded the pre-Ordovician metasediments of the Complexo Xisto-Grauváquico (CXG) [9], located to the north of the Figueira de Castelo Rodrigo–Lumbrales Anatectic Complex [10] where several syn-Variscan two-mica granites outcrop (Figure 1). In the region, there are also phyllitic-quartzitic formations of Ordovician age as well as some Cenozoic sedimentary deposits.
To achieve the previously delineated goals, a field campaign was carried out in February of 2020 to sample various outcropping lithologies for laboratory spectral analysis. The fieldwork was conducted on the Portuguese side of the pegmatite field (in the Guarda district). The sample locations included some of the training areas used in the previous classification process [6] as well as several open-pit mines where the different lithologies (Li-pegmatite, metasediments, granite) present larger and fresher expositions (Figure 1). Some areas identified as Li-pegmatite considering SVM and RF were also visited in the field to assess the exposed material in these targets (Figure 1). Field description of each site was made, and samples were collected for the spectral studies.
Figure 1. Location of the study area and geological setting of the Portuguese side of the Fregeneda-Almendra pegmatite field (adapted from [11, 12]). The location of the samples collected in the field surveys is marked with a circle for the training areas and with a diamond for the areas misclassified as Li-pegmatite using SVM and RF. Map projection: Universal Transverse Mercator zone 29N, WGS84 datum.
Proc. of SPIE Vol. 11534 115340M-2
Downloaded From: https://www.spiedigitallibrary.org/conference-proceedings-of-spie on 20 Sep 2020 Terms of Use: https://www.spiedigitallibrary.org/terms-of-use
2.2 Laboratory reflectance studies
A total of 220 point analyses were made to build a spectral library for each lithological class and Li-minerals identified. The equipment used for the measurements was the ultra-high-resolution SR-6500A spectroradiometer (Spectral Evolution, Inc.) with a spectral range between 350 and 2500 nm, and 1.5 nm resolution in the visible and near-infrared (VNIR), and 3-3.8 nm resolution in the shortwave infrared (SWIR). All spectral measurements were made in the laboratory using a Handheld Contact Probe with an internal light source (halogen bulb: 4.25 V, 1.06 A). The reflectance values were calibrated using a Spectralon (Labsphere) plate with a maximum reflectance of 95% for the 250-2500 nm region.
All spectra were individually analyzed in order to exclude irregular values caused by measurement errors or by the presence of vegetation in the surface of the samples. In the end, 198 valid spectra were retained, each one corresponding to an analyzed spot of a total of 42 samples collected. The point analyses were averaged by lithology or by location in the case of the false positive areas. Fresh and altered samples were treated separately to evaluate if there is any difference. Further spectra processing was conducted in a Python environment where the pysptools library [13] was used to remove the spectra continuum and to identify and extract the main absorption features. The SpectraGryph software [14] was also used as a complementary tool.
3. RESULTS AND DISCUSSION
3.1 Validation and improvement of the training areas
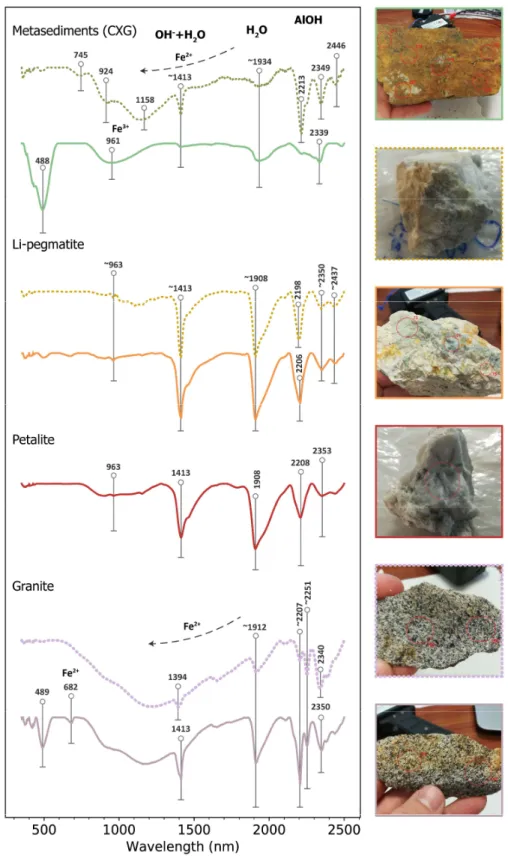
Most of the training areas used in the previous works regarding image classification [6], as well as new locations were visited in the field to collect reference spectra for the main outcropping lithologies of the area (granite, Li-pegmatite, metasediments). Their (reflectance) mean spectral signature is compared in Figure 2. Also, the mean spectra of petalite, a Li-mineral, is shown. The respective continuum removed spectra and the identified absorption features are presented in Figure 3.
Figure 2. Raw mean spectral signature of the different outcropping lithologies. Dotted lines represent fresh samples. The mean spectrum of petalite (a Li-mineral) is plotted for comparison.
Proc. of SPIE Vol. 11534 115340M-3
Downloaded From: https://www.spiedigitallibrary.org/conference-proceedings-of-spie on 20 Sep 2020 Terms of Use: https://www.spiedigitallibrary.org/terms-of-use
Figure 3. Mean spectral signatures of the outcropping lithologies with the continuum removed. Dotted lines represent fresh samples while full lines represent altered samples. The mean spectrum of petalite is also shown.
Proc. of SPIE Vol. 11534 115340M-4
Downloaded From: https://www.spiedigitallibrary.org/conference-proceedings-of-spie on 20 Sep 2020 Terms of Use: https://www.spiedigitallibrary.org/terms-of-use
Analyzing the spectra from the different lithologies (Figure 2), it is observed, as expected, that the reflectance of the fresh samples is always lower than the one from the altered samples. Regarding the Li-pegmatite spectra, the main absorption features appear to coincide with the features present in the petalite spectrum. Also, the altered samples of granite and metasediments show less pronounced but similar absorption features around ~1400 and ~2200 nm, and around ~1900 nm in the case of the altered granite (Figure 2). This is again visible in the continuum removed spectra of Figure 3, however, the magnitude of the reflectance is distinct in each lithology. The position of the absorption features was identified after the removal of the continuum, and some of these features are diagnostic of the presence of certain ions/molecules in the samples.
The fresh samples of metasediments show a typical broad (ramp-like) ferrous iron (Fe2+) feature that disappears in the
altered samples probably as a result of the oxidation process and the passage to ferric iron (Fe3+) [15]. The 745, 924, and
1158 nm iron diagnostic absorptions, which also don´t persist in altered samples, may correspond to mixtures between chlorite and biotite, as well as evidenced by the SWIR absorption feature in 2349 nm associated to the inflection in ~2240 nm [16]. The weak absorption around ~1934 nm indicates that only a small amount of water (H2O) is present, and
the feature around ~1413 nm, mainly due to the hydroxide ion (OH-) [1], when associated to the Al–OH 2213 nm
absorption, indicates the presence of white mica, also evidenced by the secondaries 2349 nm and 2446 nm absorptions, despite the deeper 2349 nm feature because of the chlorite/biotite presence effect. These features almost disappear in the altered samples (Figure 3).
Oppositely, the Li-pegmatite and petalite spectra present a deep, asymmetrical feature around ~1910 nm indicating the presence of water. In the case of Li-pegmatite, the molecular water indicated by the ~1413 nm (OH-+H2O) feature and
the main Al–OH absorption by around 2200 nm, with the associated secondaries in 2350 and 2437 nm, are diagnostic of the presence of illite (and/or white mica) probably in mixtures with clay-minerals from the smectite group, mainly in altered samples, where the 2200 nm feature moves to slightly longer wavelengths [1]. Similarly, petalite shows important features in these same main positions, but, the OH- feature more asymmetric, the water absorption significantly deeper
than the main A–OH absorption, and the almost absent Al–OH secondaries features, indicate that smectite dominates the spectra [1] (Figure 3).
In what concerns the granite, the broad Fe2+ absorption is present in both altered and fresh samples, although more
pronounced in the fresh ones (Figure 3). Also, in both cases, the absorption pair ~2251 nm/2340-2350 nm, related to the Fe–OH and Mg–OH bonds, respectively [17], is due to the presence of biotite. The Al–OH feature, also present, indicates the presence of white mica or sericite, and maybe a clay mineral in altered samples (Figure 3).
Ultimately, the field validation allowed to define important areas where these different lithologies outcrop clear of vegetation. The new field data were used with good results in a new classification attempt in the study area [18].
3.2 Areas misclassified as Li-pegmatite
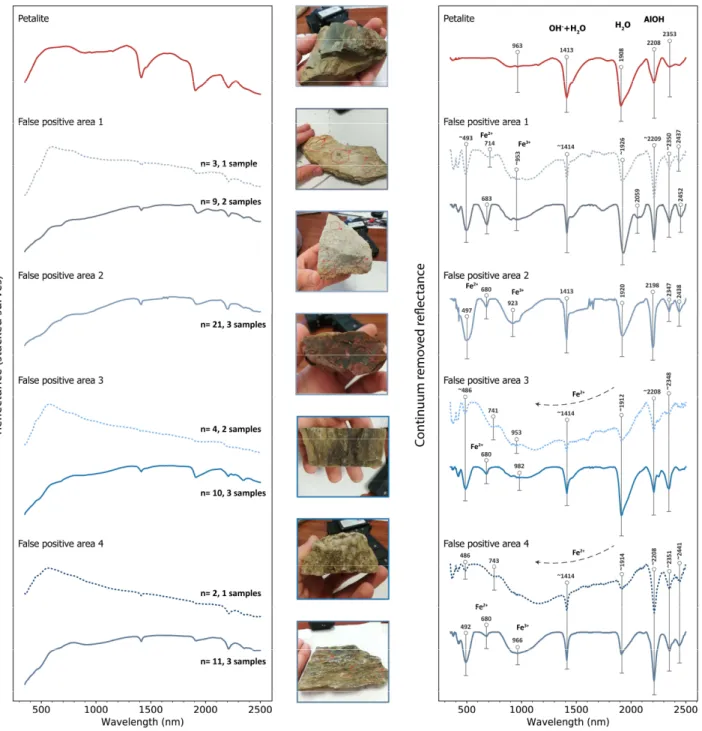
Four areas misclassified as Li-pegmatite by both the SVM and RF algorithms were also sampled. These false positive areas mainly correspond to regions where the soil was disturbed and plowed for wine or olive plantations, exposing boulders of metasedimentary rocks. Other areas correspond to slope areas where this type of rocks are naturally exposed. Figure 4 shows the mean spectral signature of these false positive areas. The identified absorption features are compared with the ones from Li-minerals.
In general, the samples collected in the false positive areas present the same absorption features related to OH- +/- H2O
(~1414 nm), H2O (~1910 nm) and Al–OH (~2208 nm) [1]. However, the spectra from the misclassified areas present
clear distinct features in the VNIR region associated with the presence of ferrous and ferric iron (Figure 4). Additionally, the distinct absorptions depths of the SWIR features indicate the occurrence of different mineral assemblages. For example, the spectra from the false positive areas no. 2 and no.4 show a deeper absorption around ~2200 nm when compared with the water feature at ~1910 nm. This is diagnostic of the presence of illite [3, 16]. On the opposite, the altered samples from false positives areas no. 1 and no. 3 have the ~1910 nm feature deeper than the Al–OH (~2208 nm), indicating the presence of clay minerals. These features were not identified in the samples collected in the training areas for the metasediments lithological class.
The presence of illite may occur in the metasedimentary rocks interstratified with muscovite or, more commonly, can be formed in retrograde metamorphic conditions linked to meteoric alteration. At this stage, the presence of clay minerals is not yet fully understood. Additional geological data will be acquired through petrographic and geochemical analysis to
Proc. of SPIE Vol. 11534 115340M-5
Downloaded From: https://www.spiedigitallibrary.org/conference-proceedings-of-spie on 20 Sep 2020 Terms of Use: https://www.spiedigitallibrary.org/terms-of-use
complement and explain the obtained results. More field campaigns are scheduled to complete the spectral library, including spectral measurements made in the field to better match the solar conditions verified when acquiring satellite images.
Figure 4. Mean spectral signature of the areas misclassified as Li-pegmatite in previous studies (reflectance spectra to the left; continuum removed spectra to the right). Dotted lines represent fresh samples while full lines represent altered samples. The mean spectral signal of petalite is also shown.
Proc. of SPIE Vol. 11534 115340M-6
Downloaded From: https://www.spiedigitallibrary.org/conference-proceedings-of-spie on 20 Sep 2020 Terms of Use: https://www.spiedigitallibrary.org/terms-of-use
4. CONCLUSIONS
This study aimed at obtaining field and laboratory data for satellite-based Li exploration. Overall, the proposed objectives were fulfilled:
1. A reference spectra of main outcropping lithologies was obtained. Despite all lithologies presenting similar features related to the presence of water/hydroxide in the structure of rock-constituent minerals, the absorptions depths are higher in the Li-pegmatites probably due to the occurrence of clay minerals. These absorptions depths differences aligned with the presence of iron-related features in the VNIR region and the distinct reflectance magnitudes of each lithology should be enough to spectrally discriminate them using satellite data. Also important is the variation in Al–OH absorption position, showing longer wavelengths in metasediments (probably due to relatively Al-poorer white mica), shorter in Li-pegmatite, and intermediate in granite, petalite, and altered rocks. Moreover, due to the distinct spectral behaviors, the fresh and altered samples were treated separately. The higher reflectance of the altered samples, when compared to the fresh ones, may be related to the presence of alteration minerals like clays and iron-oxides.
2. The spectra of the metasedimentary rocks from the false positive areas were confronted with the spectra of Li-minerals. The results show that, in fact, the outcropping rocks from these areas have similar water/hydroxide and Al–OH-related features to ones observed in the Li-minerals. This is due to the presence of clays/illite not observed in the samples from the training areas. Nonetheless, as before, the metasediments show iron-related absorption features that are not observed in the Li-minerals/pegmatites. Thus, it is necessary to improve the previous methodology employed in lithological classification.
Future studies will include the collection of more spectral and geological data for further analysis and interpretation. The spectra will be analyzed sample by sample, instead of the mean spectral signal, to identify the mineral assemblages in each lithology through the characterization of their respective diagnostic features.
ACKNOWLEDGEMENTS
The authors would like to thank the financial support provided by FCT– Fundação para a Ciência e a Tecnologia, I.P., with the ERA-MIN/0001/2017 – LIGHTS project. The work was also supported by National Funds through the FCT project UIDB/04683/2020 - ICT (Institute of Earth Sciences). Joana Cardoso-Fernandes is financially supported within the compass of a Ph.D. Thesis, ref. SFRH/BD/136108/2018, by national funds from MCTES through FCT, and co-financed by the European Social Fund (ESF) through POCH – Programa Operacional Capital Humano. The Spanish Ministerio de Ciencia, Innovacion y Universidades (Project RTI2018-094097-B-100, with ERDF funds) and the University of the Basque Country (UPV/EHU) (grant GIU18/084) also contributed economically. Odile Barrès is thanked for the help handling the spectroradiometer at Université de Lorraine (France).
REFERENCES
[1] R. N. Clark, T. V. V. King, M. Klejwa, G. A. Swayze, and N. Vergo, “High spectral resolution reflectance spectroscopy of minerals,” Journal of Geophysical Research: Solid Earth, 95(B8), 12653-12680 (1990).
[2] R. N. Clark, and T. L. Roush, “Reflectance spectroscopy: Quantitative analysis techniques for remote sensing applications,” Journal of Geophysical Research: Solid Earth, 89(B7), 6329-6340 (1984).
[3] J. L. C. Naleto, M. M. Perrotta, F. G. d. Costa, and C. R. d. Souza Filho, “Point and imaging spectroscopy investigations on the Pedra Branca orogenic gold deposit, Troia Massif, Northeast Brazil: Implications for mineral exploration in amphibolite metamorphic-grade terrains,” Ore Geology Reviews, 107, 283-309 (2019).
[4] J. Cardoso-Fernandes, A. C. Teodoro, and A. Lima, "Potential of Sentinel-2 data in the detection of lithium (Li)-bearing pegmatites: a study case." 10790, 15 (2018).
[5] J. Cardoso-Fernandes, A. C. Teodoro, and A. Lima, “Remote sensing data in lithium (Li) exploration: A new approach for the detection of Li-bearing pegmatites,” International Journal of Applied Earth Observation and Geoinformation, 76, 10-25 (2019).
Proc. of SPIE Vol. 11534 115340M-7
Downloaded From: https://www.spiedigitallibrary.org/conference-proceedings-of-spie on 20 Sep 2020 Terms of Use: https://www.spiedigitallibrary.org/terms-of-use
[6] J. Cardoso-Fernandes, A. C. Teodoro, A. Lima, and E. Roda-Robles, "Evaluating the performance of support vector machines (SVMs) and random forest (RF) in Li-pegmatite mapping: preliminary results." 11156.
[7] R. Vieira, [Aplitopegmatitos com elementos raros da região entre Almendra (V.N. de Foz Côa) e Barca d'Alva (Figueira de Castelo Rodrigo). Campo aplitopegmatítico da Fregeneda- Almendra], PhD thesis, Faculdade de Ciências da Universidade do Porto, Porto, XXVI, 273 (2010).
[8] E. Roda-Robles, A. Pesquera, F. Velasco, and F. Fontan, “The granitic pegmatites of the Fregeneda area (Salamanca, Spain): characteristics and petrogenesis,” Mineral. Mag., 63(4), 535–558 (1999).
[9] J. C. S. d. Costa, [Notícia sobre uma carta geológica do Buçaco, de Nery Delgado] Serviços Geológicos de Portugal, Lisboa (1950).
[10] I. Pereira, R. Dias, T. Bento dos Santos, and J. Mata, “Exhumation of a migmatite complex along a transpressive shear zone: inferences from the Variscan Juzbado–Penalva do Castelo Shear Zone (Central Iberian Zone),” Journal of the Geological Society, 174(6), 1004 (2017).
[11] A. F. Silva, A. J. Santos, A. Ribeiro, J. Cabral, and M. L. Ribeiro, [Carta Geológica de Portugal na escala 1/50.000 – folha 15-B – Freixo de Espada à Cinta], Serv. Geol. Portugal, Lisboa (1990).
[12] A. F. Silva, A. J. Santos, A. Ribeiro, and M. L. Ribeiro, [Carta Geológica de Portugal na escala 1/50.000 – folha 15-A – Vila Nova de Foz Côa],Serv. Geol. Portugal Lisboa (1990).
[13] C. Therien, "Welcome to the PySptools Documentation," <https://pysptools.sourceforge.io/> (22 July 2020) [14] F. Menges, "Spectragryph - optical spectroscopy software, Version 1.2.14," 2020, <http://www.effemm2.de/spectragryph/>
[15] G. R. Hunt, and R. P. Ashley, “Spectra of altered rocks in the visible and near infrared,” Economic Geology, 74(7), 1613-1629 (1979).
[16] S. Pontual, N. J. Merry, and P. Gamson, [Spectral interpretation field manual. GMEX Spectral analysis guides for mineral exploration]
,
1, 3rd, AusSpec International Ltd., Victoria, 189 (2008).[17] Y. Sun, P. K. Seccombe, and K. Yang, “Application of short-wave infrared spectroscopy to define alteration zones associated with the Elura zinc–lead–silver deposit, NSW, Australia,” Journal of Geochemical Exploration, 73(1), 11-26 (2001).
[18] J. Cardoso-Fernandes, A. C. Teodoro, A. Lima, and E. Roda-Robles, “Semi-Automatization of Support Vector Machines to Map Lithium (Li) Bearing Pegmatites,” Remote Sensing, 12(14), 2319 (2020).
Proc. of SPIE Vol. 11534 115340M-8
Downloaded From: https://www.spiedigitallibrary.org/conference-proceedings-of-spie on 20 Sep 2020 Terms of Use: https://www.spiedigitallibrary.org/terms-of-use
![Figure 1. Location of the study area and geological setting of the Portuguese side of the Fregeneda-Almendra pegmatite field (adapted from [11, 12])](https://thumb-eu.123doks.com/thumbv2/123doknet/14713791.568268/4.918.228.688.530.978/figure-location-geological-setting-portuguese-fregeneda-almendra-pegmatite.webp)