HAL Id: hal-00317935
https://hal.archives-ouvertes.fr/hal-00317935
Submitted on 7 Mar 2006
HAL is a multi-disciplinary open access
archive for the deposit and dissemination of
sci-entific research documents, whether they are
pub-lished or not. The documents may come from
teaching and research institutions in France or
abroad, or from public or private research centers.
L’archive ouverte pluridisciplinaire HAL, est
destinée au dépôt et à la diffusion de documents
scientifiques de niveau recherche, publiés ou non,
émanant des établissements d’enseignement et de
recherche français ou étrangers, des laboratoires
publics ou privés.
backscatter from CUTLASS and the EISCAT Svalbard
radars
T. R. Robinson, T. K. Yeoman, R. S. Dhillon, M. Lester, E. C. Thomas, J. D.
Thornhill, D. M. Wright, A. P. van Eyken, I. W. Mccrea
To cite this version:
T. R. Robinson, T. K. Yeoman, R. S. Dhillon, M. Lester, E. C. Thomas, et al.. First observations
of SPEAR-induced artificial backscatter from CUTLASS and the EISCAT Svalbard radars. Annales
Geophysicae, European Geosciences Union, 2006, 24 (1), pp.291-309. �hal-00317935�
SRef-ID: 1432-0576/ag/2006-24-291 © European Geosciences Union 2006
Annales
Geophysicae
First observations of SPEAR-induced artificial backscatter from
CUTLASS and the EISCAT Svalbard radars
T. R. Robinson1, T. K. Yeoman1, R. S. Dhillon1, M. Lester1, E. C. Thomas1, J. D. Thornhill1, D. M. Wright1, A. P. van Eyken2, and I. W. McCrea3
1Department of Physics and Astronomy, University of Leicester, Leicester LE1 7RH, UK
2EISCAT Scientific Association, Box 164, 981 23 Kiruna, Sweden
3Department of Space Science and Technology, Rutherford-Appleton Laboratories, Chilton, Oxfordshire OX11 0QX, UK
Received: 13 April 2005 – Revised: 8 December 2005 – Accepted: 14 December 2005 – Published: 7 March 2006
Abstract. Results are presented from the first two active
ex-perimental campaigns undertaken by the new SPEAR (Space Plasma Exploration by Active Radar) high-power system that has recently become operational on Spitzbergen, in the Sval-bard archipelago. SPEAR’s high-power beam was used to excite artificial enhancements in the backscatter detected by the ESR (EISCAT Svalbard Radar) parallel to the geomag-netic field, as well as coherent backscatter detected by both of the CUTLASS (Co-operative UK Twin Located Auroral Sounding System) coherent radars, in directions orthogonal to the geomagnetic field. The ESR detected both enhanced ion-lines as well as enhanced plasma-lines, that were sus-tained for the whole period when SPEAR was transmitting ordinary mode radio waves, at frequencies below the maxi-mum F-region plasma frequency. On a number of occasions, coherent backscatter was also observed in one or in both of the CUTLASS radars, in beams that intersected the heated volume. Although the levels of enhanced backscatter varied considerably in time, it appeared that ion-line, plasma-line and coherent backscatter were all excited simultaneously, in contrast to what has typically been reported at Tromsø, dur-ing EISCAT heater operations. A description of the technical and operational aspects of the new SPEAR system is also in-cluded.
Keywords. Ionosphere (Active experiments; Plasma waves
and instabilities; Instruments and techniques)
1 Introduction
High-power ground-based HF radio transmitters (heaters) have played an important role, over the past few decades, in the investigation of nonlinear wave interactions in space plas-mas. From the earliest experiments at Platteville, Colorado (Minkoff et al., 1974) and at Arecibo, Puerto Rico (Gor-don and Carlson, 1974) it became clear that large amplitude Correspondence to: T. R. Robinson
(txr@ion.le.ac.uk)
electromagnetic waves from heaters could excite a variety of plasma instabilities which caused the amplification of small-scale electrostatic plasma modes in the ionosphere that were then detectable as enhanced radar backscatter. Two broadly distinguishable types of artificially enhanced scatter are ob-served during the interaction of an ordinary mode (O-mode) heater wave with the ionosphere. The first involves scatter from small-scale field-aligned plasma density irregularities (striations) which requires the diagnostic radar beam to be di-rected orthogonal to the geomagnetic field. The striations are thought to be generated by a thermal parametric instability at the upper-hybrid resonance (UHR) height, although they extend for several tens of kilometres along the geomagnetic field (Robinson, 1989). The heater-induced scatter is very aspect-sensitive (Minkoff et al., 1974) and usually very much stronger than similarly aspect-sensitive scatter of natural ori-gin (Dhillon et al., 2002). It is easily detected by conven-tional coherent backscatter radars. Many such observations of striations artificially stimulated by the EISCAT heater at Tromsø by the CUTLASS (Co-operative UK Twin Located Auroral Sounding System) radars have been reported (Robin-son et al., 1997; Bond et al., 1997; Yeoman et al., 1997).
The second type of artificial scatter involves low frequency waves (either ion-acoustic or alternatively purely-growing mode) and high-frequency electron-acoustic waves which are thought to be driven unstable by the ponderomotive force (Fejer, 1979). These waves are excited near the reflection height of the O-mode heater wave. The scatter from these waves is less aspect sensitive than that from field-aligned striations and is typically observed by incoherent scatter radars with steerable beams, over a range of beam directions from that parallel to the geomagnetic field direction up to a few tens degrees away from it. Although, during heat-ing experiments, the amplitudes of these waves are consid-erably enhanced above naturally occurring levels, the result-ing backscatter is generally weaker than that of the sensitive scatter from field-aligned striations. Non aspect-sensitive artificial scatter has been extensively studied us-ing both the UHF and VHF incoherent backscatter radars at
Tromsø in conjunction with the EISCAT heater (Isham et al., 1990; Kohl et al., 1993; Rietveld et al., 2000).
It is known that there is a strong relationship between the evolution of the aspect-sensitive and non aspect-sensitive
backscatter described above. In particular, the so-called
“overshoot” phenomenon (Robinson, 1989) regularly seen in non aspect-sensitive scatter is thought to be due to the anomalous absorption (Robinson, 2002) of heater wave power at the UHR due to the relatively slow development of striations there. This quenches the more rapidly devel-oping non aspect-sensitive scatter at the heater reflection height, which is typically a few kilometres above the UHR. Furthermore, Dhillon and Robinson (2005) have found ev-idence that the striations may act as waveguides for the smaller wavelength plasma waves involved in non aspect-sensitive backscattering and thus affect their propagation and backscattering properties.
In spite of this physical link, there have been rather few published examples simultaneous observations of the two types of scatter, in comparison to the wealth of observa-tions of one type or the other. Until recently, the only site where these two types of observation could be carried out routinely has been at Tromsø, where both coherent and in-coherent scatter access to the heated volume is available. However, in April 2004 a new high-power HF facility be-gan operations on the island of Spitzbergen in the Svalbard archipelago. This new SPEAR (Space Plasma Exploration by Active Radar) facility, designed and built by the Univer-sity of Leicester, in the UK, is intended to serve a number of scientific purposes. Its main role will be to carry out active space plasma experiments in the polar ionosphere and mag-netosphere by exciting striations that can be used as targets for coherent scatter radar observation of otherwise unobserv-able dynamical processes (Yeoman et al., 1997), by stimulat-ing Alfv´en wave resonances in the magnetosphere (Robinson et al., 2000; Wright et al., 2000) and, in addition, it will also be able to function as a radar, by itself receiving backscatter from the ionosphere (low-power mode), in a manner similar to the CUTLASS radars, and possibly also from the magne-tosphere (high-power mode).
The experiments reported below were mainly designed to test the capabilities of the SPEAR high-power HF beam and in particular to study the excitation of field-aligned striations. The SPEAR site is both geographically further north than that of the Tromsø heater and also has a higher dip angle. It is known that the three important directions in the geom-etry of heating experiments are determined by the normal to the ionospheric layers (which is close to the local verti-cal direction), the dip angle and the heater beam direction. The SPEAR geometry differs in several respects from that at Tromsø. For example, the SPEAR beam power
half-width of around 10.5◦ in the magnetic meridian is larger
than the local dip angle (around 8.5◦) and for both vertical
pointing and field-aligned pointing the beam will contain the spitze angle, whereas at Tromsø the beam is narrower and
the dip angle is 12◦. Rietveld et al. (2003) have demonstrated
that this geometry has a significant influence on the response
of the ionosphere to HF heating. Moreover, the EISCAT Svalbard radar operates at a frequency of 500 MHz, which is intermediate between the 224 MHz VHF and 930 MHz UHF EISCAT radars at Tromsø. It is known that Landau damp-ing, which is highly wavelength dependent, plays an impor-tant role in determining the spectral content of non aspect-sensitive scatter during heating. Furthermore, SPEAR is lo-cated in the polar cap, while Tromsø is regarded as usually being within the auroral zone. The state of the ionosphere in the polar cap is much less well-known and generally differ-ent from that further south, over Tromsø. It is thus important to compare and contrast the results of heating with SPEAR and with the Tromsø facility, not only for practical opera-tional considerations, but also to shed new light on heating phenomena, which are still not well understood and which are amenable to study through varying the geometry of the heating experiment.
The present paper is intended to serve several purposes. First to provide a description of the new SPEAR facility, then to report the results of new experiments which demonstrate SPEAR’s capabilities in generating enhanced backscatter phenomena and also to discuss these results, albeit briefly, in the light of what has been previously observed, partic-ularly at the Tromsø heating facility. The paper is set out as follows. The new SPEAR facility is described in Sect. 2 and the arrangement of the experiment in relation to the di-agnostics involved, i.e. the CUTLASS and ESR radars, is described in Sect. 3. The results of the first SPEAR obser-vations of enhanced ESR backscatter and enhanced CUT-LASS backscatter from two campaigns run in April/May and September/October, 2004 are reported in Sect. 4. The new results are discussed in Sect. 5.
2 The SPEAR system
SPEAR (Space Plasma Exploration by Active Radar) is a
new high-power radar system located at Lat. 78.15◦N, Long.
16.05◦E, in the vicinity of Longyearbyen (Spitzbergen) and
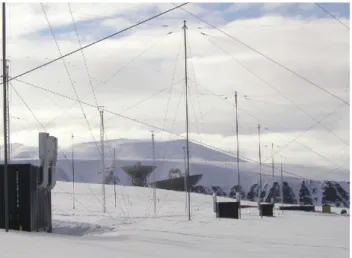
is designed to carry out a range of space plasma investi-gations of the polar ionosphere and magnetosphere. The SPEAR site is located adjacent to the EISCAT Svalbard Radar (ESR) at an altitude of 420 m above sea-level, on a plateau on Mine 7 mountain some 10 km from Longyearbyen (see Fig. 1).
The SPEAR antenna system (Fig. 2). comprises a 6×4 array of full-wave, crossed-dipoles, 16 m above the ground, with an antenna spacing of 48.4 m, allowing the transmission of both linear and circularly polarised signals. The individ-ual dipoles are rhombically broadened to allow operation be-tween 4 and 6 MHz. The site is large enough to accommodate a planned extension of the system up to a 6×6 array.
The resulting beam has a quasi-elliptical cross-section,
with an average half-power width of 21◦along its major axis
(parallel to the array north direction, shown in Fig. 2) and 14◦
along its minor axis. This results in an overall antenna gain of 21 dB. Individual phase-control provides beam-steering
Fig 1
Fig. 1. A view of part of the SPEAR antenna array on mine 7
moun-tain, with the ESR dishes in the background.
within ±30◦ from zenith, at any azimuth, without
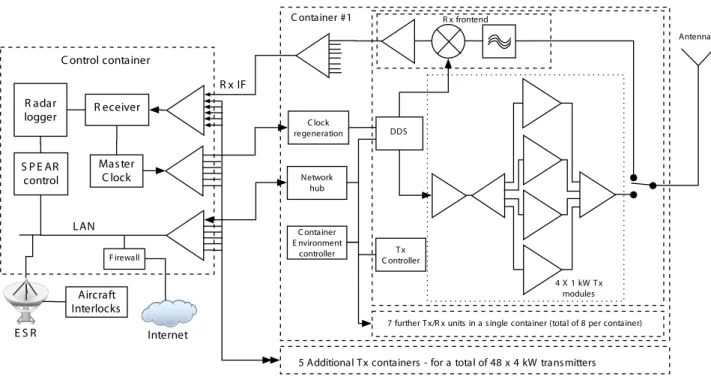
signif-icantly altering the antenna gain or introducing significant side-lobe signals. The beam may thus be pointed in direc-tions which include vertical and field-aligned. Beam-steering to angles further from the zenith may be achieved but in this case significant side-lobes are introduced into the field-pattern. A block diagram of the whole system, which inter-faces to the antennas, is illustrated in Fig. 3.
SPEAR is a distributed transmitting and receiving system consisting of individual 4-kW solid-state transmitters con-nected to the antenna array. Each transmitter consists of a single driver-stage and 4 individual 1-kW modules, the out-puts of which are combined and fed to the antenna. In the 4×6 configuration 48 such transmitters are required. These are made up of 192 power-amplifier modules, 48 driver-stages and a total of 240 power-supply units. Each transmit-ter contains an embedded controller and an individual Direct Digital Synthesiser (DDS) which provides a transmit signal and the IF for the receiver front-end. Eight transmitters are housed in a half-sized shipping container which feeds a 2×2 sub-array. The entire SPEAR system is housed in 6 such containers. All of the transmitters were built in the Radio and Space Plasma group’s workshops in Leicester, by the group’s technical staff.
The control system is housed in a further shipping con-tainer located on the edge of the antenna array and feeds common clock signals and network signals to the transmit containers via optical connections. Receiver IF signals are summed in the transmitter containers and passed via copper cables to the control cabin where they are summed and fed to a single-channel receiver, the data from which is processed by the receiver data-logger. Control of the entire system is achieved by passing instructions to the distributed-system controllers within the transmitter containers. The control sig-nal also implements safety features which prevent transmis-sion in the presence of aircraft.
Fig 2
Fig. 2. Schematic of the SPEAR antenna array with transmitter
containers and dipoles. The (blue) shaded area shows the planned extension. The orientation of the array is indicated by the arrows.
The transmitter containers pose a serious design constraint in that they must be both insulated and heated to allow oper-ation with low external temperatures that are frequently
be-low −30◦C, but that must also be capable of dissipating some
30 kW of waste heat during full-power CW operation. This problem is compounded by the need to prevent the ingress of snow which places serious constraints on forced air cool-ing systems. Closed circuit coolcool-ing (air conditioncool-ing) is not appropriate due to cost considerations, high maintenance re-quirements and reliability concerns. Each transmitter con-tainer includes several heaters and cooling fans connected by H-section ducting which are controlled by a container en-vironmental controller which monitors internal and external temperatures to provide autonomous control of the heating and cooling. With the additional DDS control computer that is necessary to program the 8 DDS modules in each transmit-ter container, each transmittransmit-ter container consists of a 10-node computer system.
The first 5 transmitter containers were completed during the autumn of 2002 and shipped along with the 4 control con-tainers to Longyearbyen. These concon-tainers were transported to the SPEAR site and moved into position during the spring of 2003. At the same time the antenna system was shipped directly from the manufacturers to the site. The final trans-mitter container was retained at Leicester to permit software development and completion and testing of the phasing sys-tem. This delay meant that the antenna array was incomplete for the first operational tests in April/May 2004, although some successful scientific results were obtained (see Sect. 4 below). The 6×4 array was complete in time for the second campaign in September/October 2004.
3 Experimental arrangements
The primary aim of the first year of operations of SPEAR was to establish the capability of the high-power beam to gener-ate artificial striations, in line with SPEAR’s central scientific raison d’etre. The SPEAR site is within the fields of view of both the CUTLASS radars in Finland (Hankasalmi) and Ice-land (Thykkvibær), (Fig. 4), which were operated throughout
DDS C lock regeneration Network hub T x C ontroller R x frontend 4 X 1 kW T x modules Antenna
7 further T x/R x units in a single container (total of 8 per container) C ontainer
E nvironment controller
C ontainer #1
R eceiver
5 Additional T x containers - for a total of 48 x 4 kW transmitters
R x IF R adar logger Master C lock LAN Internet S P E AR control C ontrol container E S R F irewall Aircraft Interlocks Fig 3
Fig. 3. A block diagram of the SPEAR system illustrating the distributed transmit and receive configuration.
60°N 70°N 0°E 15 E 30° E 45°E Hankasalmi Þykkvibær GEOGRAPHIC COORDS E SR SPE A R
SPEAR, CUTLASS and the ESR
Fig 4
Fig. 4. Map of the locations of SPEAR, CUTLASS and ESR
to-gether with the CUTLASS Finland and Iceland radar fields of view. The pink circle represents the typical spatial coverage of ESR mea-surements.
the two campaigns. The ESR UHF radar was also oper-ated, initially as a secondary diagnostic to provide informa-tion about the local background ionosphere. As it turned out, it was the ESR which provided the first evidence of SPEAR-induced nonlinear effects in the ionosphere. A co-located ionosonde was also available to provide real time informa-tion about the maximum ionospheric plasma frequency. This enabled the experimenters to choose appropriate SPEAR op-erating frequencies.
During the April/May campaign only 35 transmitters were initially available due to the incompleteness of the system, as indicated above. These were operated at a mean power of 3 kW and thus provided a total of 105 kW with an esti-mated antenna gain of 20 dB. The effective radiated power in this case was just over 10 MW. However, quite soon af-ter the beginning of the first campaign technical difficulties were encountered which resulted in the loss of transmitters. For the second campaign, the complete 6×4 array was avail-able, i.e. 48 transmitters, which produced an antenna gain of 21 dB. However, in view of the transmitter problems from the first campaign, it was decided to run at 2 kW per trans-mitter in the second campaign, which meant an ERP of just over 15 MW. With the experience gained from the first few campaigns, the transmitters will ultimately each be able to achieve 4 kW, which will result in an ERP of 30 MW.
3.1 CUTLASS operations
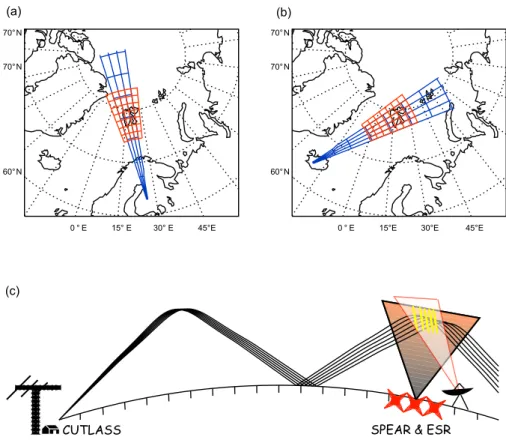
The current stereo CUTLASS radar is an HF coherent backscatter radar system located at Hankasalmi, Finland and Thykkvibær, Iceland (Lester et al., 2004), capable of near simultaneous operation on two separate frequencies. The radars form part of the SuperDARN array (Greenwald et al., 1995). CUTLASS is ideally situated for making obser-vations of the SPEAR-modified ionosphere over the ESR, since the SPEAR site is located well within the fields of view of both the CUTLASS Finland (Fig. 5a) and CUT-LASS Iceland (Fig. 5b) radars. Both radars reach the iono-sphere above SPEAR via a 1.5-hop HF propagation path, as shown schematically in Fig. 5c. Normal operations for both radars involve a 16-beam scan over ranges 180–3555 km,
CUTLASS SPEAR & ESR 60°N 70°N 70°N 0 ° E 15 ° E 30 ° E 45 °E 60°N 70°N 70°N
0 ° E 15 °E 30 °E 45 °E
(a) (b)
(c)
Figure x
Fig 5
Fig. 5. Summary of CUTLASS experimental operations. (a) Scanning pattern for CUTLASS Finland, (b) scanning pattern for CUTLASS
Iceland, (c) schematic of 1.5-hop propagation path between CUTLASS radar and SPEAR/ESR sites.
with an integration time of 3 or 6 s providing a full-scan time-resolution of 1 or 2 min. In the experiments presented here the CUTLASS radars ran in a high temporal and spatial reso-lution mode, with both radars running a reduced scan of 3–5 beams centred over SPEAR (beams 6 and 9 for Thykkvibær and Hankasalmi respectively), with an integration time of 1 s. Channel-A of each of the radars provides high spatial resolu-tion, with a field-of-view restricted to 75 range-gates of size 15 km covering ranges of 1485–2610 km, while Channel-B provides data over the complete propagation path from the HF radars to SPEAR at a resolution of 45 km, over distances of 180–3555 km. Both Channels-A and -B of each radar ad-ditionally perform a small frequency sweep, with the scans cycling through approximately three HF frequencies which are appropriate to allow propagation to Svalbard over a 1.5-hop path. Frequencies of 11–13 MHz were chosen for the experiments presented here. Thus the combination of the integration-time, scan-pattern and frequency-sweep provided a time-resolution of between 9 and 15 s in this arrangement.
3.2 ESR operations
The first ESR/SPEAR observations were carried out using the 32 m (steerable) and 42 m (fixed) dishes of the EISCAT Svalbard Radar. These were co-aligned in the magnetic field
direction (azimuth 181◦, elevation 81.6◦), and used to record
ion-line and plasma-line data respectively. The ESR
experi-ment used in these observations employed the steffe modu-lation scheme, which uses two 16-bit alternating codes. One of these codes has a baud-length of 32 µs (total pulse-length 512 µs), while the other has a baud-length of 96 µs (total pulse length 1536 µs). The former code is sampled with a fractionality of 2, and the latter code is sampled with a frac-tionality of 6. This means that both codes are sampled at intervals of 16 µs, so that each can give a range resolution of 2.4 km, though the data from adjacent height gates are not independent at this range resolution.
The alternating code with 16 µs baud-length yields fully decoded data between ranges of 105 and 216 km, while the code with 96 µs baud gives fully decoded data between 259 and 924 km. In the interval from 216 to 259 km, spectra are derived from the alternating code with 96 µs baud, which, while not fully decoded, nonetheless provides acceptable data for most monitoring purposes. The ion-line spectra pre-sented in this paper are shown at range resolutions of 4.8 km for the 16 µs baud code, and 14.4 km for the 96 µs baud code. At this range-resolution, each fully-decoded spectrum is independent of its neighbours. The frequency-resolutions for the ion-line spectra from the two alternating codes are 0.992 kHz and 0.880 kHz.
The plasma-line data were recorded using a separate re-ceiver chain to that used in processing the ion-line signal. Plasma-line detection is done using the power returned dur-ing a brief interval of reception from the longer of the two
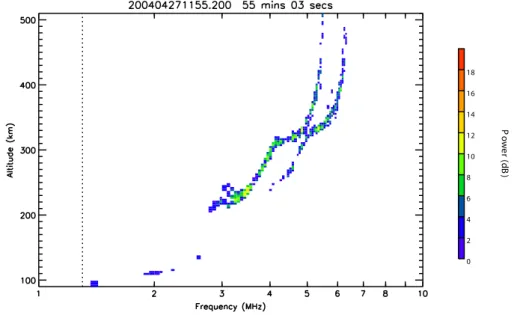
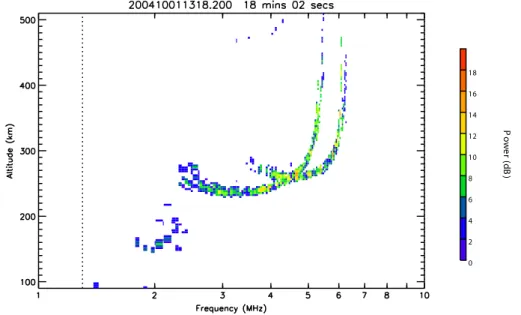
0 2 4 6 8 10 12 14 16 18 P o w e r ( d B ) Fig 6 Fig. 6. Svalbard ionogram for 11:55 UT, 27 April 2004.
ESR PLASMA LINE
Plasma Line Spectral Amplitude for 27/04/2004 Upshifted P lasma Line
12:00 12:02 12:04 12:06 12:08 12:10 12:12 UT 4.5 5.0 5.5 6.0 F re q u e n cy ( M H z)
Downshifted P lasma Line
12:00 12:02 12:04 12:06 12:08 12:10 12:12 UT -6.0 -5.5 -5.0 -4.5 F re q u e n cy ( M H z) 0.0 0.1 0.1 0.2 0.2 0.2 0.3 0.3 0.4 0.4 0.5 0.6 0.6 0.6 0.7 0.8 0.8 0.9 0.9 0.9 S p e ctr a l A m p litu d e (x 1 0 4 ) Fig 7
Fig. 7. ESR upshifted and downshifted plasma-line data for 12:00–
12:12 UT, 27 April 2004. During this period SPEAR was transmit-ting X-mode from 12:00–12:04 UT, O-mode from 12:04–12:08 UT and was off from 12:08–12:12 UT.
phase-coded pulses as it traverses the ionosphere, without decoding the return to enhance range resolution. As a
re-sult, the data are not resolved in range, but only in fre-quency. The plasma-line data thus constitute two time-series of frequency-spectra, in overlapping bands of 3.2 to 4.8 MHz and 4.5 to 6.1 MHz (offset from the transmitted frequency), summed over all ranges from 150 to 600 km. Within each band, the plasma-line power is divided into 128 frequency-bins of width 13 kHz. The plasma-line power in most of these bins is generally small, except in regions where the gradi-ent of the electron density profile becomes shallow (i.e. lit-tle change in electron density with increasing height). In this case, plasma-line contributions from a range of alti-tudes add together to create enhanced power at that partic-ular plasma frequency. This method is sometimes referred to as the “spectral plasma-line” technique, described more fully by Showen (1979).
4 Experimental results
4.1 Results from the campaign of April/May 2004
The first attempts to observe SPEAR-induced nonlinear ef-fects in the ionosphere above Spitzbergen commenced at
12:00 UT on 27 April 2004. SPEAR was operated at
4.9 MHz in the following sequence: 4 min on in X-mode, 4 min on in O-mode, followed by 4 min off. The ERP dur-ing on periods in the first 12-min sequence was estimated at 10 MW. The SPEAR beam was directed along the geo-magnetic field, as was the ESR radar. An ionogram taken at 11:55 UT (Fig. 6) indicated a maximum plasma frequency of around 5.5 MHz, so the heating was over-dense. The up-shifted and downup-shifted plasma-line intensity spectra data from the ESR for the period from 12:00–12:12 UT, corre-sponding to the first 12-min sequence are illustrated in the two panels in Fig. 7. These panels show a clear intensifica-tion of the plasma-lines at ±4.9 MHz (within the frequency
ESR ION LINE
Ion Line Spectral Power for X-mode, O-mode and Heater-off for 1200-1212 UT on 27/04/2004
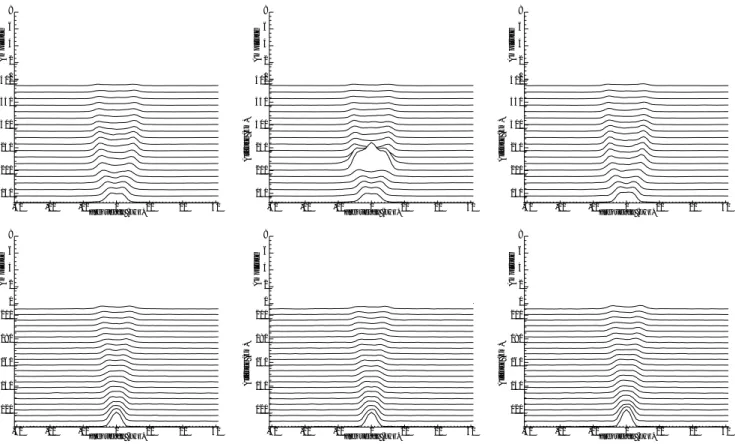
-30 -20 -10 0 10 20 30 Frequency (kHz) 150 200 250 300 350 400 Altitude (km) 0 2 4 6 8 Amplitude -30 -20 -10 0 10 20 30 Frequency (kHz) 120 140 160 180 200 Altitude (km) 0 2 4 6 8 Amplitude -30 -20 -10 0 10 20 30 Frequency (kHz) 150 200 250 300 350 400 Altitude (km) 0 2 4 6 8 Amplitude -30 -20 -10 0 10 20 30 Frequency (kHz) 120 140 160 180 200 Altitude (km) 0 2 4 6 8 Amplitude -30 -20 -10 0 10 20 30 Frequency (kHz) 150 200 250 300 350 400 Altitude (km) 0 2 4 6 8 Amplitude -30 -20 -10 0 10 20 30 Frequency (kHz) 120 140 160 180 200 Altitude (km) 0 2 4 6 8 Amplitude Fig 8
Fig. 8. ESR ion-line data for 12:00–12:12 UT, 27 April 2004. The upper panels correspond to the height range 129–757 km with a resolution
of 14 km and the lower to 105–210 km with a resolution of 5 km. The first column corresponds to SPEAR X-mode (12:00–12:04 UT), the second to O-mode (12:04–12:08 UT) and the third to off (12:08–12:12 UT).
resolution of 13 kHz) from the ESR transmitted frequency (500.3 MHz) during the O-mode heating between 12:04– 12:08 UT. A pair of continuous weakly-enhanced natural lines (upshifted and downshifted) with a frequency varying between about ±5.6–5.7 MHz is also visible in the ESR data. These correspond to the F-region maxima in the ionospheric plasma frequency which are consistent with the ionogram data in Fig. 6. These natural lines are visible due to the limb effect caused by the lower density gradients at the peak of the ionospheric plasma density.
The corresponding ESR ion-line data are displayed in Fig. 8. Here the data have been averaged over 4 min, corre-sponding to the three 4-min periods in the 12-min sequence described above. However in contrast to the plasma-line data, height information is included for the ion-line spectra. The six panels in Fig. 8 are arranged as follows. Each col-umn includes the two overlapping height ranges described in Sect. 3.2. The altitude values along the vertical axes of the plots are the lower edge of the range bins. So whereas the 200-km curve in the upper panel represents the range 200–214 km, the 200-km curve in the lower panel corre-sponds to 200–205 km. Time increases along the rows from
left to right. Clearly the X-mode (first column) and the
off-period (last column) are virtually indistinguishable, in-dicating no effect of the SPEAR beam during X-mode heat-ing. The height variation of the spectral shapes during these two periods is typical of the transition from single-humped spectra from the collisional E-region to double-humped in the F-region. However, equally clear is the strong modifi-cation of the ion spectrum for the period of O-mode heat-ing (middle column), at a height close to 200 km (upper panel), which corresponds to the SPEAR-ionosphere interac-tion height, close to where the plasma frequency is 4.9 MHz, in this instance. The reason why there is no enhancement in the corresponding 200-km curve in the lower panel (middle column) is probably due to the interaction layer being very narrow in altitude (Djuth et al., 1994) and, in this instance, its lying close to the upper edge of the range bin in the up-per panel, i.e. just below 214 km. The upup-per curve in the lower panel only covers the altitude range 205–210 km. The SPEAR-affected spectra show two clear characteristics. The spectral power is enhanced by a factor of between two and three and there is a central peak corresponding to the purely-growing mode (Fejer and Leer, 1972).
ESR SPECTRAL DATA
IL (U, C and D) and PL (U and D) on 27/04/2004
12:00 12:02 12:04 12:06 12:08 12:10 12:12
UT 0.1
1.0 10.0
Ion Line Amplitude
a
12:00 12:02 12:04 12:06 12:08 12:10 12:12 UT 0.1 1.0 10.0Ion Line Amplitude
b
12:00 12:02 12:04 12:06 12:08 12:10 12:12 UT 0.1 1.0 10.0Ion Line Amplitude
c
12:00 12:02 12:04 12:06 12:08 12:10 12:12 UT 0.01 0.10 1.00 10.00 100.00Plasma Line Amplitude
d
12:00 12:02 12:04 12:06 12:08 12:10 12:12 UT 0.01 0.10 1.00 10.00 100.00Plasma Line Amplitude
e
Fig 9
Fig. 9. Time series of amplitudes of ESR ion- and plasma-lines for 12:00–12:12 UT, 27 April 2004. Panel (a) contains the upshifted ion-line; (b), the unshifted ion-line centre frequency; (c), the down shifted ion-line; (d), the upshifted plasma-line and (e), the downshifted plasma-line.
Time-series of the amplitudes of various key components of ESR incoherent scatter spectrum are shown in Fig. 9. The upper three panels illustrate the amplitudes of three elements of the ion spectrum (upshifted ion-acoustic line,
centre-frequency and downshifted ion-acoustic line respec-tively) and the bottom two illustrate the amplitudes of the upshifted (+4.9 MHz) and downshifted (−4.9 MHz) plasma-lines, as functions of time from 12:00–12:12 UT. 4-min
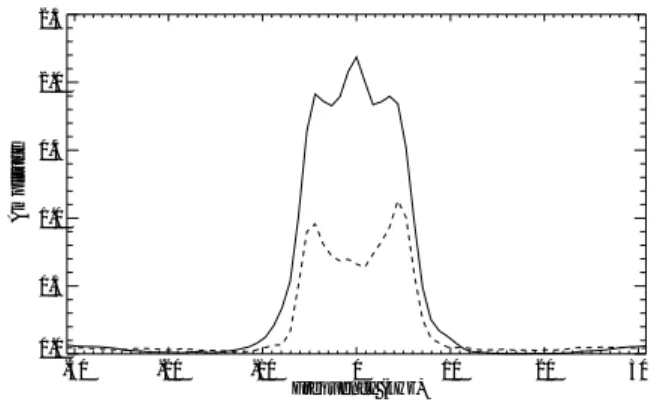
AVERAGED ESR ION LINE SPECTRA FROM 27/04/2004
Heater-on, 1204-1208 UT (solid), and heater-off, 1208-1212 UT (dashed), at 215 km altitude
-30 -20 -10 0 10 20 30 Frequency (kHz) 0.0 0.5 1.0 1.5 2.0 2.5 Amplitude Fig 10
Fig. 10. Comparison of average ion spectra for SPEAR on with that
for SPEAR off at 4.9 MHz for 12:04–12:12 UT, 27 April 2004.
averages are indicated by dashed horizontal lines. Significant enhancements in all these features are present throughout the SPEAR O-mode operation (12:04–12:08 UT) although the amplitudes vary considerably from dump to dump. The plasma-lines are enhanced by a factor of around ten, on av-erage, over the natural background levels (seen during the off-period from 12:08–12:12 UT), but there are peaks of up to about a hundred times background. Also, there is a high degree of correlation in all five elements of the spectrum, as well as a high degree of symmetry between the upshifted and downshifted elements.
A more detailed comparison between the average O-mode and the average off results for the ion spectra from the pe-riod above is displayed in Fig. 10. This shows that the pair of upshifted and downshifted ion-acoustic lines have been enhanced by a factor of two, whereas the centre frequency
has been enhanced by more than three times. It is also
clear that the separation of the two ion-lines has not been affected by SPEAR, which probably means that there has been no significant electron temperature change during the ’heating’ process. The results in Figs. 7 to 10 are consis-tent with the excitation of both the parametric decay insta-bility (Fejer, 1979) and the purely-growing mode instainsta-bility (Fejer and Leer, 1972) by three-wave interactions that also excite electron-acoustic (plasma) waves close to ±4.9 MHz. Strictly, the parametric decay instability excites plasma-lines which are shifted from those excited by the purely-growing instability by around half the ion spectral-width, i.e., by a few kHz. However the plasma-line spectral resolution of 13 kHz, available in the present experiments, is insufficient to resolve this separation.
Although further transmissions of the same 12-min se-quences were subsequently attempted during the course of the 27 April and the next two days, similar results to those seen during 12:00–12:12 UT on 27 April were seen only spasmodically. This was partly due to deteriorating iono-spheric conditions but also due to technical difficulties which led to a slowly reducing number of operating transmitters.
AVERAGED ESR ION LINE SPECTRA FROM 27/04/2004
Heater-on, 1307-1308 UT (solid), and heater-off, 1308-1309 UT (dashed), at 215 km altitude
-30 -20 -10 0 10 20 30 Frequency (kHz) 0 1 2 3 4 Amplitude Fig 11
Fig. 11. As for Fig. 10, but at 5.2 MHz for 13:07–13:09 UT, 27
April 2004.
There was however a short burst of enhanced spectral power observed for a few data dumps between 13:08 and 13:09 UT on 27 April while SPEAR was operating at 5.2 MHz. The av-erage ion spectra from the 4 min of O-mode heating and the 4 min of off are illustrated in Fig. 11. The results are similar to those in Fig. 10, but the enhancements are even greater.
The final point to make about the results from the first campaign is that no SPEAR-induced CUTLASS backscat-ter was seen at all. The reasons for this negative result are not entirely clear. It is possible that the beam produced by the incomplete SPEAR antenna array had an adverse effect on the production of striations, although, the positive results from the ESR show that there were no such adverse effects on the instabilities responsible for field-parallel scatter. An-other possibility is that adverse propagation conditions from the CUTLASS radar sites to Svalbard were responsible for the lack of coherent scatter, although this is not at all obvious from the ionogram information taken at the time.
4.2 Results from the campaign of September/October 2004
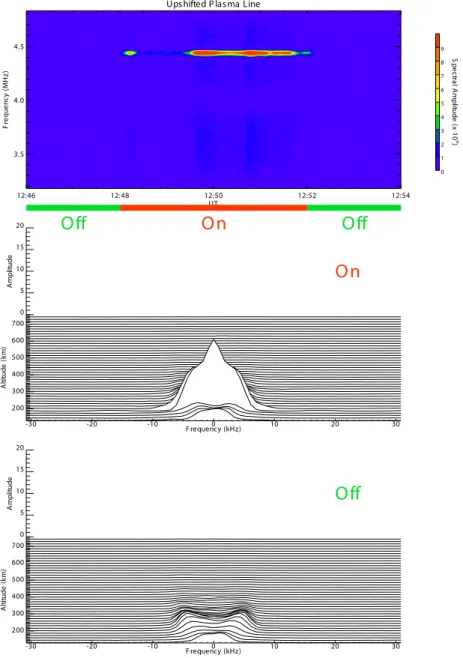
In contrast to the first SPEAR campaign, for the second cam-paign the SPEAR 6×4 antenna-array was complete. This allowed slightly higher powers (15 MW ERP) to be used. Apart from a slightly different choice of SPEAR operating frequency, the only other differences in the way the experi-ments were conducted was that for the second campaign an 8-min heater sequence of 4-min on in O-mode and 4-min off was chosen. In many respects the results of ESR observa-tions from the second campaign mirrored those of the first. A particularly strong example of the excitation of plasma-lines and ion spectral modification is illustrated in Fig. 12 (only the upshifted plasma-line is illustrated and the altitude of the strongly enhanced averaged ion-line spectrum was close to 200 km) for the period from 12:46–12:54 UT on 1 Oc-tober 2004. Here SPEAR was operated at 4.45 MHz in an ionosphere with a maximum plasma frequency of 5.5 MHz. The amplitudes of five spectral elements of ESR scatter are shown in Fig. 13 for the period 12:46–12:54 on 1 October
ESR PLASMA AND ION LINES
PL Amplitude and IL Spectra for SPEAR (On and Off) 01/10/2004
Upshifted P lasma Line12:46 12:48 12:50 12:52 12:54 UT 3.5 4.0 4.5 F re q u e n cy ( M H z)
Off
On
Off
-30 -20 -10 0 10 20 30 F requency (kHz) 200 300 400 500 600 700 A lti tu d e ( km ) 0 5 10 15 20 A m p lit u d eOn
-30 -20 -10 F requency (kHz)0 10 20 30 200 300 400 500 600 700 A lti tu d e ( km ) 0 5 10 15 20 A m p lit u d eOff
0 1 2 3 4 5 6 7 8 9 S p e ctr a l A m p litu d e (x 1 0 4 ) Fig 12Fig. 12. ESR plasma-line is shown in the upper panel during 12:46–12:54 UT 1 October 2004, together with the average ion-line spectra for
O-mode SPEAR-on (centre panel) and SPEAR-off (lower panel).
2004. Again highly variable but sustained enhancements are clear in all of the spectral features during O-mode heating. Also there is a high degree of correlation in all of the five elements as well as a high degree of symmetry between the upshifted and down shifted elements. Although during this particular period of heating, as throughout the first campaign, no SPEAR-induced CUTLASS backscatter was observed, it was observed for the first time during this second campaign.
Figure 14 illustrates the first distinct observation of SPEAR-induced CUTLASS backscatter from artificial
field-aligned striations. A sequence of three 4-min periods
of O-mode heating (separated by 4-min off-periods) at times between 13:15–13:45 UT on 28 September 2004, is included, while SPEAR was operating at 4.6 MHz. Clear artificial backscatter power signatures from channel-A of the CUTLchannel-ASS Finland radar, at frequencies between
ESR SPECTRAL DATA
IL (U, C and D) and PL (U and D) on 01/10/2004
12:46 12:48 12:50 12:52 12:54
UT 1
10 100
Ion Line Amplitude
a
12:46 12:48 12:50 12:52 12:54 UT 1 10 100Ion Line Amplitude
b
12:46 12:48 12:50 12:52 12:54 UT 1 10 100Ion Line Amplitude
c
12:46 12:48 12:50 12:52 12:54 UT 0.01 0.10 1.00 10.00 100.00Plasma Line Amplitude
d
12:46 12:48 12:50 12:52 12:54 UT 0.01 0.10 1.00 10.00 100.00Plasma Line Amplitude
e
Fig 13
Fig. 13. Time series of amplitudes of ESR ion- and plasma-lines for 12:46–12:54 UT, 1 October 2004. Panel (a) contains the upshifted
ion-line; (b), the unshifted ion-line centre frequency; (c), the down shifted ion-line; (d), the upshifted plasma-line and (e), the downshifted plasma-line.
11.075–11.275 MHz, can be seen between range-gates 41 to 50 during the first three transmission periods. The range resolution was 15 km. The actual location of the
backscat-ter is somewhat difficult to debackscat-termine precisely, due to the long ranges involved. The CUTLASS Finland radar is lo-cated at a ground range of 1800 km from the SPEAR site.
1315 1320 1325 1330 1335 1340 1345 UT 10 20 30 40 50 R a n g e g a te 1315 1320 1325 1330 1335 1340 1345 UT 10 20 30 40 50 R a n g e g a te O O O 0 3 6 9 12 15 18 21 24 27 P o w e r ( d B )
SPEAR and CUTLASS
Hankasalmi: 15 km Range gates
28 Sep 2004
Fig 14
Fig. 14. CUTLASS Finland radar range time amplitude plot showing the first observation of SPEAR induced scatter, 13:15–13:45 UT, 28
September 2004.
The long ranges involved, and the over-the-horizon propa-gation path, mean that the time-of-flight information is not sufficient to obtain the exact ground range of the backscatter over SPEAR. The fact that the CUTLASS signal can only reach SPEAR by reflection from both the sea surface and the ionosphere (see Fig. 5) also adds to the uncertainty. De-spite these complications, the group-propagation range was found to be approximately 230 km longer than that predicted by straight line propagation from CUTLASS Finland to an altitude 200 km directly above SPEAR. The continuous ter in the very near ranges in Fig. 14 is natural ground scat-ter. The CUTLASS Iceland radar was not operating during this period, due to power line maintenance that lasted from 10:00–17:00 UT on 28 September 2004.
During the sequences illustrated in Fig. 14, enhancements in the ESR plasma-line and ion spectral power were also observed in addition to the CUTLASS backscatter above. Time-series of the CUTLASS backscatter power (averaged over the heated patch) for channel-A, together with those for the five elements of the ESR backscatter data (as in Figs. 9 and 13) are shown in Fig. 15 for the period from 13:20 to 13:40 UT on 28 September 2004. Three periods of O-mode heating (13:20–13:24, 13:28–13:32 and 13:36–13:40 UT) are illustrated, separated by 4-min periods when SPEAR was off. SPEAR-enhanced CUTLASS (Finland) backscatter well in excess of 10 dB above background is evident in Fig. 15. All of the ESR spectral features also exhibit enhancement to some degree during SPEAR heating, though the variability in amplitude is greater than that in the corresponding CUT-LASS data (except during 13:36–13:40 UT). The enhance-ments in the ion-line spectra in Fig. 15 appear somewhat smaller than in previous examples above (apart from a large
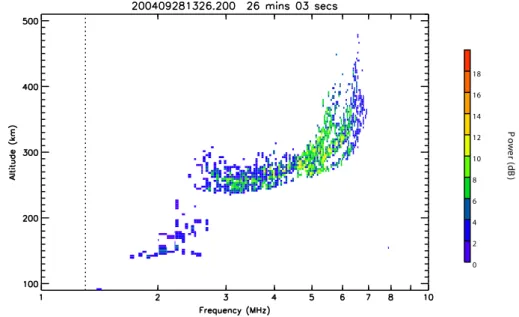
spike just after 13:31 UT), although the upshifted artificial plasma-line (panel e) is strongly enhanced. There is also sub-stantially more asymmetry between the upshifted and down-shifted plasma-line responses in this example than in others presented previously. These differences from previous exam-ples may have been due to ionospheric conditions as evinced by the ionogram in Fig. 16 for 13:26 UT on 28 September 2004, which was taken during a SPEAR-off period. This ionogram exhibits significant spreading, which is indicative of patchy and uneven plasma densities, even though the max-imum plasma frequency appears to be above the transmission frequency of SPEAR.
An example of a period of heating when SPEAR-induced backscatter was observed in both the Iceland and Finland CUTLASS radars is illustrated in the amplitude time-series in Fig. 17. The upper two panels show the Finland and Iceland backscatter data, respectively, and the bottom five panels contain the five ESR spectra similar to those in Figs. 9, 13 and 15, but here for 13:12–13:40 UT on 1 Oc-tober 2004, while SPEAR was operating at 4.45 MHz. The CUTLASS Finland data has 15 km range-resolution and 20 s time-resolution at frequencies between 11.075–11.275 MHz, while the Iceland data has 45 km range-resolution and 36 s time-resolution at frequencies between 12.6 to 13.3 MHz. The differences in these aspects of the two CUTLASS data sets are due to the fact that the artificial scatter was only clearly seen in each radar with the different modes that were described in Sect. 3.1 above. Ionospheric conditions were considerably more stable during this period, than they were for the results in Fig. 15, as is illustrated by the iono-gram data from 13:18 UT on 1 October 2004 (Fig. 18). Strong backscatter is seen in both of the CUTLASS radar
CUTLASS AND ESR BACKSCATTER DATA
BP, IL (U, C and D) and PL (U and D) on 28/09/2004
13:20 13:25 13:30 13:35 13:40 UT 1 10 100 Backscatter Power
a
13:20 13:25 13:30 13:35 13:40 UT 1 10 100Ion Line Amplitude
b
13:20 13:25 13:30 13:35 13:40 UT 1 10 100Ion Line Amplitude
c
13:20 13:25 13:30 13:35 13:40 UT 1 10 100Ion Line Amplitude
d
13:20 13:25 13:30 13:35 13:40 UT 0.01 0.10 1.00Plasma Line Amplitude
e
13:20 13:25 13:30 13:35 13:40 UT 0.01 0.10 1.00Plasma Line Amplitude
f
Fig 15
Fig. 15. Time series of amplitudes of CUTLASS Finland backscatter power (panel a), together with ESR ion- and plasma-lines for 13:20–
13:40 UT, 28 September 2004. Panel (b) contains the upshifted ion-line; (c), the unshifted ion-line centre frequency; (d), the down shifted ion-line; (e), the upshifted plasma-line and (f), the downshifted plasma-line.
data sets, during three periods of O-mode SPEAR heating (13:12–13:16, 13:20–13:24 and 13:28–13:32 UT). The am-plitudes seen from Iceland are somewhat larger than those
from Finland, which is rather puzzling, given that the ground ranges of two radars from SPEAR are similar (Finland is at 1800 km and Iceland is at 2018 km). This result may partly
0 2 4 6 8 10 12 14 16 18 P o w e r ( d B ) Fig 16
Fig. 16. Svalbard ionogram for 13:26 UT, 28 September 2004.
be explained by the range cells for the Iceland radar being three times longer than those at Finland. This increases the volume of scatter and hence the effective scattering section by the same factor, assuming the scattering cross-section to be homogeneous in range within a range-beam cell and the heated patch occupies several consecutive range gates (which it clearly does from Fig. 14). Artificial stria-tions are known to occupy a limited height range (Robinson, 1989) and so do not fill the radar beams as far as elevation is concerned. The vertical extent of the scatter is also limited by aspect-sensitivity and refraction effects. However, the heat-ing patch is wide enough to fill the CUTLASS beams as far as azimuth is concerned. This implies that the backscatter power should fall approximately at a rate inversely propor-tional to the third power of the range. On this basis it might be expected that the Iceland backscatter power be reduced by 30% over the Finland backscatter power due to the 10% increase in range from SPEAR. This suggests the Iceland power should be about twice those of Finland. The peak val-ues seen at Iceland certainly exceed those at Finland by more than this factor. This discrepancy probably deserves fur-ther investigation. However, absolute comparisons of pow-ers from two different radars are complicated by propaga-tion, especially with 1.5-hop modes over such large ranges, as well as the uncertainties introduced by aspect-angle con-siderations.
Also in Fig. 17, all the ESR spectral powers show strong enhancements during the O-mode heating, although there is huge variability, especially in the period from 13:12– 13:16 UT, where an intense enhancement appears for about 1 min after 13:14 UT. This enhancement also appears to co-incide with the rise of backscatter power in the CUTLASS Iceland data, though the corresponding Finland data appear more uniform in time. There is generally good correlation of the 4-min averaged data (corresponding to either
SPEAR-on or SPEAR-off periods) for all of the seven time-series in Fig. 17, though the ESR data are in general more variable on shorter time-scales.
5 Discussion and conclusions
The data presented above show clearly that the new SPEAR facility is capable of generating enhancements in field-aligned plasma density striations that produce artificial aspect-sensitive scatter in the CUTLASS radars and also of generating enhancements in ion-acoustic waves, purely-growing (ion) modes and electron-acoustic waves which give rise to enhanced ESR scatter. Since one of the main pur-poses of SPEAR is to create artificial scatter for purpur-poses of geophysical space plasma exploration with CUTLASS, it is useful to compare the efficiency of SPEAR with that of the Tromsø heater, with the proviso already mentioned concern-ing direct comparisons between results from different sites.
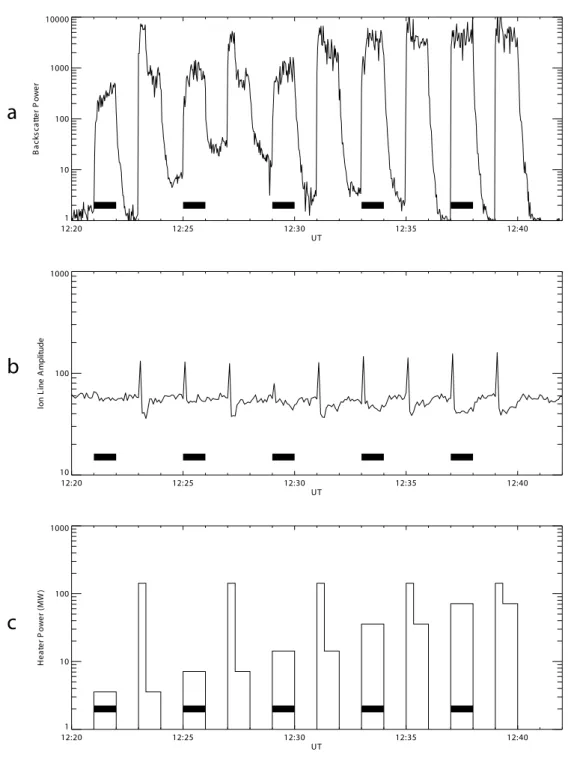
As has been pointed out already, the SPEAR heater has op-erated so far only at ERP levels of 15 MW, while the Tromsø heater is capable of 200 MW or more. An example of CUT-LASS (Finland) backscatter measurements at Tromsø on one of the few occasions when the heater there was operating at powers considerably less than this is illustrated in Fig. 19 for 12:20–12:40 UT on 7 October 1997. Even this experiment was not ideal for comparison with SPEAR, due to the nature of some of the heater-on periods, as described below.
The lower panel in Fig. 19 indicates the ERP level of the Tromsø heater. As is clear, the heater-on from 12:21– 12:22 UT was at a constant power level, as was each sub-sequent alternate heater-on. In between the constant power heater-on periods were interspersed more complicated power variations, which involved the heater being on initially at full-power for 20 s, before reverting to a lower power for
CUTLASS AND ESR BACKSCATTER DATA
BP (F and I), IL (U, C and D) and PL (U and D) on 01/10/2004
13:15 13:20 13:25 13:30 13:35 13:40 UT 1 10 100 Backscatter Power
a
13:15 13:20 13:25 13:30 13:35 13:40 UT 1 10 100 Backscatter Powerb
13:15 13:20 13:25 13:30 13:35 13:40 UT 1 10 100Ion Line Amplitude
c
13:15 13:20 13:25 13:30 13:35 13:40 UT 1 10 100Ion Line Amplitude
d
13:15 13:20 13:25 13:30 13:35 13:40 UT 1 10 100Ion Line Amplitude
e
13:15 13:20 13:25 13:30 13:35 13:40 UT 0.01 0.10 1.00 10.00 100.00 1000.00 10000.00Plasma Line Amplitude
f
13:15 13:20 13:25 13:30 13:35 13:40 UT 0.01 0.10 1.00 10.00 100.00 1000.00 10000.00Plasma Line Amplitude
g
Fig 17
Fig. 17. Time series of amplitudes of CUTLASS Finland (panel a) and Iceland (panel b) backscatter powers, together with ESR ion- and
plasma-lines for 13:12–13:40 UT, 1 October 2004. Panel (c) contains the upshifted ion-line; (d), the unshifted ion-line centre frequency; (e), the down shifted ion-line; (f), the upshifted plasma-line and (g), the downshifted plasma-line.
the rest of the heater on period. Only the constant power heater-on periods are useful for comparison with the SPEAR experiment and these periods are indicated by thick
hori-zontal bars in Fig. 19. The upper panel of Fig. 19 exhibits the corresponding CUTLASS backscatter power from the heater-induced irregularities. The range from the CUTLASS
0 2 4 6 8 10 12 14 16 18 P o w e r ( d B ) Fig 18
Fig. 18. Svalbard ionogram for 13:18 UT, 1 October 2004.
Finland site to that of the Tromsø heater is a little under 1000 km. On the basis of the inverse cube power law al-ready mentioned, this would mean that for the same scatter-ing cross-section, and the same range cell size, CUTLASS backscatter power from Tromsø should be around 7 to 8 times that from SPEAR. The Tromsø heater power levels in Fig. 19 which best compare with those at SPEAR occur in the interval from 12:29 to 12:30 UT when the Tromsø heater was transmitting 15 MW ERP. The corresponding enhance-ment in the CUTLASS backscatter was about 300 times above background. The corresponding levels for SPEAR are around 50 times (from Fig. 17). These levels are therefore roughly comparable with those which might be expected on the basis of the Tromsø results.
Also displayed in Fig. 19 (middle panel) are the central unshifted component of the ion-line backscatter data from the EISCAT UHF radar observed over the same period as the CUTLASS backscatter data. They exhibit very clearly the well-known ion-line overshoot phenomenon which has been a ubiquitous feature of heating experiments at Tromsø. It is typified by a strong enhancement of the ion-line power for a short period (usually no more than one data dump) immedi-ately after heater turn on, followed by the (almost complete) disappearance of the enhancement for the rest of the time the heater is on. There are a few observations at Tromsø that indicate that the ion-line does not entirely disappear, but rather its amplitude falls to a level 10 to 20 dB below its ini-tial peak (Djuth et al., 1994; Dhillon and Robinson, 2005). Ion-line overshoot effects are present at all ERP levels in Fig. 19, apart from the lowest of 3.5 MW which occurred between 12:21–12:22 UT. Notice also that there is no sign of any ion-line intensity enhancement after the overshoot spike in the Tromsø data in Fig. 19. Indeed, there is evidence that the ion-line power falls to levels below that during heater-off for a short time after the overshoot spike (although this
lat-ter effect in probably due to a reduction in the UHF radar power output as a result of switching on the heater). On this basis it might be expected that a strong overshoot effect should be discernable in the SPEAR ESR data. From what has been reported above this is clearly not the case. There is no sign of systematic overshoot occurring in the SPEAR ex-periments. There are a few periods when it might be argued that there are signs of it. For example, in Fig. 9, just after 12:04 UT, in Fig. 13, just after 12:48 UT and in Fig. 17 just after 13:20 UT. However, these are the only times when it appears after SPEAR is turned on amongst many other times when SPEAR is turned on without any sign of overshoot. Furthermore, in all of these cases there are several further spikes in the ESR spectral power while SPEAR is on, which is not seen in the data from Tromsø (Fig. 19).
There is evidence that overshoot related phenomena are absent when the heater frequency is very close to a harmonic of the electron gyro-frequency (Honary et al., 1999), but un-der these conditions field-aligned striations are not generated either and hence no aspect-sensitive scatter would be seen. Indeed, as has been pointed out in the introduction, it has been argued that overshoot is caused by anomalous absorp-tion of the heater wave due to the striaabsorp-tions at an altitude be-low that from which the non aspect-sensitive scatter comes. This is clearly inconsistent with the data from the SPEAR experiments where several examples of simultaneous CUT-LASS scatter and ESR scatter have been observed. Further, these results have been seen with several SPEAR operating frequencies, all of which have been chosen to avoid harmon-ics of the local electron gyro-frequency.
Another consideration in the context of the differences in heating effects seen at Tromsø and on Spitzbergen is the dif-ference between the operating frequencies of the ESR and mainland EISCAT radars. The ESR works at frequencies close to 500 MHz, whereas the UHF radar responsible for the
CUTLASS AND EISCAT UHF DATA
Power and Ion Line Amplitude for 1220-1242 UT on 07/10/1997
12:20 12:25 12:30 12:35 12:40 UT 1 10 100 1000 10000 B a ck sc a tt e r P o w e r
a
12:20 12:25 12:30 12:35 12:40 UT 10 100 1000 Io n L in e A m p lit u d eb
12:20 12:25 12:30 12:35 12:40 UT 1 10 100 1000 H e a te r P o w e r (M W )c
Fig 19Fig. 19. Amplitudes of CUTLASS Finland backscatter (panel a) and the unshifted centre frequency of the EISCAT UHF (Tromsø)
ion-line (panel b), together with the heater ERP levels (panel c) for 12:20–12:42 UT, 7 October, 1997. The EISCAT heater was operating at 4.544 MHz and the time and range resolution of the ESCAT UHF radar data were 5 s and 22 km, respectively.
data from Tromsø in Fig. 19 operates at 931 MHz. However, it is unlikely that these frequency differences explain the lack of overshoot in the ESR data, since the VHF EISCAT radar
at Tromsø, which operates at 224 MHz, also shows clear ev-idence of overshoot during heating experiments (Kohl et al., 1993).
Yet another consideration which might help to explain the apparent lack of overshoot during the SPEAR experiments is the condition of the ionosphere itself. There is no doubt that during all of the SPEAR observations undertaken so far, the amplitude data appear to exhibit rather high levels of vari-ability. The ionograms taken during both SPEAR campaigns also exhibited a level of spreading consistent with somewhat patchy plasma density distributions. This kind of structur-ing is to be expected in the polar ionosphere. This, together with the inevitable drifting of plasma under even weak nat-ural electric fields or neutral winds would mean that plasma would not be constantly heated. The plasma density variabil-ity would also lead to strong local fluctuations in the elec-tric field strength of the heater wave, due to focussing and defocusing effects, so that threshold levels required to trig-ger instabilities would only be exceeded for short periods within the whole of the 4-min on-period. Since the time-constant for the excitation of the instabilities which give rise to the ESR scatter, as discussed in the introduction, is much shorter than that for the instabilities which give rise to the CUTLASS scatter, the ESR data would be expected to be much more variable than the CUTLASS data, because the instabilities involved would be continually being excited and decaying on short time-scales. The longer time-scales for the CUTLASS-related instabilities would have a relative smoothing effect on the CUTLASS backscatter amplitudes. This difference in variability could be further exaggerated in the ESR data by the small ESR beam cross-sectional area
(about 1 km2)compared to the CUTLASS range-beam cell
area (about 200 km2). Sampling over a larger area would
also have a smoothing effect on the CUTLASS amplitude data, which is consistent with what is observed. However, this latter explanation of the lack of consistent overshoot during SPEAR heating is rather speculative and not entirely convincing. It thus must remain tentative in the absence of any other experimental evidence. Further observations of the type reported above are essential, hopefully involving more stable ionospheric conditions as we move towards solar max-imum and also higher SPEAR transmitter powers, as confi-dence is gained in operating the new system.
Finally, as mentioned earlier, there is no evidence of bulk heating effects, such as large-scale changes in electron tem-perature or density occurring, so far, during heating experi-ments with SPEAR. Experience with the Tromsø heater has shown that large changes in these parameters can occur. Ri-etveld et al. (2003) have reported temperature changes of sev-eral thousands of degrees, although Robinson et al. (1997), reported much smaller bulk effects at similar heater pow-ers. The response to heating depends on both the transmitted power of the heater and ionospheric conditions. The absence of large-scale heating effects with SPEAR is most likely due to a combination of lower transmitted power compared to the Tromsø heater as well as the generally more variable iono-spheric conditions above Svalbard, already mentioned.
Acknowledgements. The SPEAR facility is supported on grant
PPA/Z/O/2002/00668 by the Particle Physics and Astronomy Re-search Council (PPARC, UK). EISCAT is an International Associ-ation supported by Finland (SA), France (CNRS), the Federal Re-public of Germany (MPG), Japan (NIPR), Norway (NFR), Swe-den (VR) and the United Kingdom (PPARC). CUTLASS is sup-ported jointly by the United Kingdom (PPARC) and Finland (FMI, Helsinki). CUTLASS operations at Leicester are funded by PPARC on grant PPA/R/R/1997/00256. We thank P. Chapman, now of the University of Lancaster, for his development work on the SPEAR system. We would also like to thank all the academic staff, techni-cal team, postdoctoral research associate and postgraduate student members of the Radio and Space Plasma Physics Group, University of Leicester, whose hard work helped to make the SPEAR project possible.
Topical Editor T. Pulkkinen thanks F. Honary and M. Rietveld for their help in evaluating this paper.
References
Bond, G., Robinson, T. R., Eglitis, P., Wright, D. M., Stocker, A. J., Rietveld, M. T., and Jones, T. B.: Spatial observations by the CUTLASS coherent scatter radar of ionospheric modification by high power radio waves, Ann. Geophys., 15, 1412–1421, 1997,
SRef-ID: 1432-0576/ag/1997-15-1412.
Dhillon, R. S., Robinson, T. R., and Wright, D. M.: Radar ACFs and turbulence characteristics from artificially generated field-aligned irregularities, Geophys. Res. Lett., 29, 11-1–11-4, 2002.
Dhillon, R. S. and Robinson, T. R.: Observations of
time-dependence and aspect sensitivity of regions of enhanced UHF backscatter associated with RF heating, Ann. Geophys., 23, 75– 85, 2005,
SRef-ID: 1432-0576/ag/2005-23-75.
Djuth, F. T., Stubbe, P., Sulzer, M. P., Kohl, H., Rietveld, M. T., and Elder, J. H.: Altitude characteristics of plasma turbulence excited with the Tromsø superheater, J. Geophys. Res., 99, 333– 339, 1994.
Fejer, J. A.: Ionospheric modification and parametric instabilities, Rev. Geophys., 17, 135–153, 1979.
Fejer, J. A. and Leer, E.: Purely-growing parametric instability in an inhomogeneous plasma, J. Geophys. Res., 77, 700–708, 1972. Gordon, W. E. and Carlson Jr., H. C.: Arecibo heating experiments,
Radio Sci., 9, 1041–1047, 1974.
Greenwald, R. A., Baker, K. B., Dudeney, J. R., Pinnock, M., Jones, T. B., Thomas, E. C., Villain, J.-P., Cerisier, J.-C., Senior, C., Hanuise, C., Hunsucker, R. D., Sofko, G., Koehler, J., Nielsen, E., Pellinen, R., Walker, A. D., Sato, N., and Yamagishi, H.: DARN/SuperDARN: A global view of the dynamics of high-latitude convection, Space Sci. Rev., 71, 761–796, 1995. Honary, F., Robinson, T. R., Wright, D. M., Stocker, A. J., Rietveld,
M. T., and McCrea, I.: First direct observations of the reduced striations at pump frequencies close to the electron gyroharmon-ics, Ann. Geophys., 17, 1235–1238, 1999,
SRef-ID: 1432-0576/ag/1999-17-1235.
Isham, B., Kofman, W., Hagfors, T., Nordling, J., Thid´e, B., LaHoz, C., and Stubbe, P.: New phenomena observed by EISCAT during an RF ionospheric modification experiment, Radio Sci., 25, 251– 262, 1990.
Kohl, H., Kopka, H., Stubbe, P., and Rietveld, M. T.: Introduction to ionospheric heating experiments at Tromsø-II. Scientific prob-lems, J. Atmos. Terr. Phys., 55, 601–613, 1993.
Lester, M., Chapman, P. J., Cowley, S. W. H., Crooks, S. J., Davies, J. A., Hamadyk, P., McWilliams, K. A., Milan, S. E., Parsons, M. J., Payne, D. B., Thomas, E. C., Thornhill, J. D., Wade, N. M., Yeoman, T. K., and Barnes, R. J.: Stereo CUTLASS: A new capability for the SuperDARN radars, Ann. Geophys., 22, 459– 473, 2004,
SRef-ID: 1432-0576/ag/2004-22-459.
Minkoff, J., Kugelman, P., and Weissman, I.: Radio frequency scat-tering from a heated ionospheric volume, 1, VHF/UHF field-aligned and plasma-line backscatter measurements, Radio Sci., 9, 941–955, 1974.
Rietveld, M. T., Isham, B., Kohl, H., La Hoz, C., and Hagfors, T.: Measurements of HF-enhanced plasma and ion lines at EISCAT with high-altitude resolution, J. Geophys. Res., 105, 7429–7439, 2000.
Rietveld, M. T., Kosch, M. J., Blagoveshchenskaya, N. F., Ko-rnienko, V. A., Leyser, T. B., and Yeoman, T. K.: Ionospheric electron heating, optical emissions and striations induced by powerful HF radio waves at high latitudes: aspect angle depen-dence, J. Geophys. Res., 108, 1141, doi:10.1029/2002JA009543, 2003.
Rietveld, M. T., Kosch, M. J., Blagoveshchenskaya, N. F., Ko-rnienko, V. A., Leyser, T. B., and Yeoman, T. K.: Correc-tion to Rietveld et al. (2003), J. Geophys. Res., 109, A04306, doi:10.1029/2004JA010460, 2004.
Robinson, T. R.: The heating of the high latitude ionosphere by high power radio waves, Phys. Rep. 179, 79–209, 1989.
Robinson, T. R.: Effect of multiple scatter on the propagation and absorption of electromagnetic waves in a field-aligned-striated magnetoplasma: Implications for ionospheric modification ex-periments, Ann. Geophys., 20, 41–55, 2002,
SRef-ID: 1432-0576/ag/2002-20-41.
Robinson, T. R., Stocker, A. J., Bond, G., Eglitis, P., Wright D. M., and Jones, T. B.: O and X mode heating effects observed simultaneously with the CUTLASS and EISCAT radars and low power HF diagnostics at Tromsø, Ann. Geophys., 15, 134–136, 1997.
Robinson, T. R., Strangeway, R., Wright, D. M., Davies, J. A., Horne, R. B., Yeoman, T. K., Stocker, A. J., Lester, M., Rietveld, M. T., Mann, I. R., Carlson, C. W., and McFadden, J. P.: FAST observations of ULF waves injected into the magnetosphere by means of modulated RF heating of the auroral electrojet, Geo-phys. Res. Lett., 27, 3165–3168, 2000.
Showen, R. L.: The spectral measurement of plasma lines, Radio Sci., 14, 503–508, 1979.
Wright, D. M., Davies, J. A., Robinson, T. R., Chapman, P. J., Yeo-man, T. K., Thomas, E. C., Lester, M., Cowley, S. W. H., Stocker, A. J., Horne, R. B., and Honary, F.: Space Plasma Exploration by Active Radar (SPEAR): an overview of a future facility, Ann. Geophys., 18, 1248–1255, 2000,
SRef-ID: 1432-0576/ag/2000-18-1248.
Yeoman, T. K., Wright, D. M., Robinson, T. R., and Rietveld, M. T.: High spatial and temporal resolution observations of an impulse-driven field line resonance in backscatter radar artificially gener-ated with the Tromsø heater, Ann. Geophys., 15, 634–644, 1997,