HAL Id: hal-00618809
https://hal.archives-ouvertes.fr/hal-00618809
Submitted on 19 Dec 2015
HAL is a multi-disciplinary open access
archive for the deposit and dissemination of
sci-entific research documents, whether they are
pub-lished or not. The documents may come from
teaching and research institutions in France or
abroad, or from public or private research centers.
L’archive ouverte pluridisciplinaire HAL, est
destinée au dépôt et à la diffusion de documents
scientifiques de niveau recherche, publiés ou non,
émanant des établissements d’enseignement et de
recherche français ou étrangers, des laboratoires
publics ou privés.
small chain-like aggregate ice crystals and large ice
water contents near the top of a deep convective cloud
during the CIRCLE-2 experiment
Jean-François Gayet, Guillaume Mioche, L. Bugliaro, Alain Protat, A.
Minikin, M. Wirth, A. Dörnbrack, V. Shcherbakov, B. Mayer, Anne Garnier,
et al.
To cite this version:
Jean-François Gayet, Guillaume Mioche, L. Bugliaro, Alain Protat, A. Minikin, et al.. On the
ob-servation of unusual high concentration of small chain-like aggregate ice crystals and large ice water
contents near the top of a deep convective cloud during the CIRCLE-2 experiment. Atmospheric
Chemistry and Physics, European Geosciences Union, 2012, 12 (2), pp.727-744.
�10.5194/acp-12-727-2012�. �hal-00618809�
www.atmos-chem-phys.net/12/727/2012/ doi:10.5194/acp-12-727-2012
© Author(s) 2012. CC Attribution 3.0 License.
Chemistry
and Physics
On the observation of unusual high concentration of small chain-like
aggregate ice crystals and large ice water contents near the top of a
deep convective cloud during the CIRCLE-2 experiment
J.-F. Gayet1, G. Mioche1, L. Bugliaro2, A. Protat3, A. Minikin2, M. Wirth2, A. D¨ornbrack2, V. Shcherbakov1,4, B. Mayer2, A. Garnier3, and C. Gourbeyre1
1Laboratoire de M´et´eorologie Physique, UMR6016 CNRS/Universit´e Blaise Pascal, Clermont-Ferrand, France
2Institut f¨ur Physik der Atmosph¨are, Deutsches Zentrum f¨ur Luft- und Raumfahrt (DLR), Oberpfaffenhofen, Germany
3Laboratoire Atmosph`eres, Milieux, Observations Spatiales, UMR8190 CNRS/Universit´e Pierre et Marie Curie, France
4Laboratoire de m´et´eorologie Physique, Institut Universitaire de Technologie de Montluc¸on, Montluc¸on, France
Correspondence to: J.-F. Gayet ([email protected])
Received: 15 July 2011 – Published in Atmos. Chem. Phys. Discuss.: 25 August 2011 Revised: 1 December 2011 – Accepted: 30 December 2011 – Published: 16 January 2012
Abstract. During the CIRCLE-2 experiment carried out over Western Europe in May 2007, combined in situ and re-mote sensing observations allowed to describe microphysical and optical properties near-top of an overshooting convective
cloud (11 080 m/−58◦C). The airborne measurements were
performed with the DLR Falcon aircraft specially equipped with a unique set of instruments for the extensive in situ cloud measurements of microphysical and optical properties (Polar Nephelometer, FSSP-300, Cloud Particle Imager and PMS 2-D-C) and nadir looking remote sensing observations
(DLR WALES Lidar). Quasi-simultaneous space
obser-vations from MSG/SEVIRI, CALIPSO/CALIOP-WFC-IIR and CloudSat/CPR combined with airborne RASTA radar re-flectivity from the French Falcon aircraft flying above the DLR Falcon depict very well convective cells which over-shoot by up to 600 m the tropopause level. Unusual high values of the concentration of small ice particles, extinction,
ice water content (up to 70 cm−3, 30 km−1 and 0.5 g m−3,
respectively) are experienced. The mean effective diameter and the maximum particle size are 43 µm and about 300 µm, respectively. This very dense cloud causes a strong atten-uation of the WALES and CALIOP lidar returns. The SE-VIRI retrieved parameters confirm the occurrence of small ice crystals at the top of the convective cell. Smooth and featureless phase functions with asymmetry factors of 0.776 indicate fairly uniform optical properties. Due to small ice crystals the power-law relationship between ice water con-tent (IWC) and radar reflectivity appears to be very differ-ent from those usually found in cirrus and anvil clouds. For a given equivalent reflectivity factor, IWCs are significantly larger for the overshooting cell than for the cirrus. Assuming
the same prevalent microphysical properties over the depth of the overshooting cell, RASTA reflectivity profiles scaled
into ice water content show that retrieved IWC up to 1 g m−3
may be observed near the cloud top. Extrapolating the rela-tionship for stronger convective clouds with similar ice
parti-cles, IWC up to 5 g m−3could be experienced with
reflectiv-ity factors no larger than about 20 dBZ. This means that for similar situations, indication of rather weak radar echo does not necessarily warn the occurrence of high ice water con-tent carried by small ice crystals. All along the cloud pen-etration the shape of the ice crystals is dominated by chain-like aggregates of frozen droplets. Our results confirm pre-vious observations that the chains of ice crystals are found in a continental deep convective systems which are known generally to generate intense electric fields causing efficient ice particle aggregation processes. Vigorous updrafts could lift supercooled droplets which are frozen extremely rapidly
by homogeneous nucleation near the −37◦C level,
produc-ing therefore high concentrations of very small ice particles at upper altitudes. They are sufficient to deplete the wa-ter vapour and suppress further nucleation as confirmed by humidity measurements. These observations address scien-tific issues related to the microphysical properties and struc-ture of deep convective clouds and confirm that particles smaller than 50 µm may control the radiative properties in convective-related clouds. These unusual observations may also provide some possible insights regarding engineering is-sues related to the failure of jet engines commonly used on commercial aircraft during flights through areas of high ice water content. However, large uncertainties of the measured and derived parameters limit our observations.
1 Introduction
The size, shape and concentration of the ice crystals at the top of the ice clouds are among of the critical parameters which are important in cloud radiative forcing (see for in-stance Stephens et al., 1990) as well as for the reliability of remote retrieval techniques. Cloud in situ observations are one of the tools that may serve as a basis for the develop-ment of more accurate microphysical and radiation param-eterizations for regional climate models. In situ observa-tions have rarely been devoted to the description of near-top convective clouds and anvils over Western Europe. Most of the recent observations come from experiments carried out in different subtropical and Tropical regions and over the Great Plains of USA. For instance, during the extensive in situ measurements of the Central Equatorial Pacific EXperi-ment (CEPEX), particle concentrations measured by the 2-D probes did not exceed a few hundreds per liter and derived ice
water content (IWC) values were <0.3 g m−3 (McFarquhar
and Heysmfield, 1996). FSSP-300 particle concentrations
(exceeding 1 cm−3)were not included in the determination
of the total particle concentration. High ice particle con-centration have been reported by Connolly et al. (2005) dur-ing the Egret Microphysics with Extended Radiation and Li-dar experiment (EMERALD-II) in outflow cirrus from
Trop-ical multi-cell storms near Darwin. During the
SCOUT-AMMA campaign over West Africa in August 2006, Frey et al. (2011) reported measurements in a young mesoscale convective system (MCS) outflow with ice crystal
concen-trations of up to 8.3 cm−3, rimed ice particles with
max-imum dimensions exceeding 1.5 mm and a maxmax-imum ice
water content of 0.05 g m−3. The data collected during the
Tropical Composition, Cloud, and Climate Coupling (TC4) and the NASA African Monsoon Multidisciplinary Analyses (NAMMA) campaigns with a new 2-D-S probe (an optical imaging probe with improved response characteristics, Law-son et al., 2006a) report that small ice crystal rarely make a significant contribution to cloud extinction and optical depth (Lawson et al., 2010). Other observations are contrary to the above results which rather suggest that small ice crystals play a dominant role in governing the radiative properties of cirrus anvils (Garrett et al., 2003; Fridlind et al., 2004; Davis et al., 2009). Controversy remains over whether the high ice crys-tal concentrations are real or an artefact, particularly in con-ditions with lots of large ice crystals (Heymsfield and Milo-shevich, 1995). For instance Jensen et al. (2009) suggest that previous measurements of ice crystal concentration in anvil cirrus have often been hampered by ice particle shattering on probe tips.
Previous measurements addressed mostly the anvil part of the convective systems outside updraft regions, which remain poorly documented with accurate measurements. Strapp et al. (1999) found maximum ice water contents in excess of
1.3 g m−3, and often sustained ice water contents in excess
of 0.5 g m−3. Abraham et al. (2004) reported a broad area in
extratropical cyclones that were higher than 1 g m−3. The ice
water content values in these two papers are probably under-estimates given what is now known about the performance of the standard Nevzorov LWC/TWC probe (Korolev et al.,
2008). IWC from 1.5 to 2.5 g m−3were reported in intense
mid-latitude storms over the Great Plains of USA (Heyms-field and Palmer, 1986; Lawson et al., 1998). Likewise in Tropical convective turrets clouds, ice water content
exceed-ing 2 g m−3 and extinction up to 60 km−1 have been
mea-sured (Lawson et al., 2010). An early Royal Aircraft Es-tablishment report by McNaughton (1959), which has been used for years to provide some guidelines to aviation on ice water content, describes measurements made in convective clouds near Entebbe, Singapore and Darwin with total water
contents (probably mostly ice) exceeding 5 g m−3. Mazzawy
and Strapp (2007) summarize these and other measurements in order to come up with “Appendix D – An Interim Icing Envelope” which defines a mixed phase/glaciated icing en-vironment to be used by the aviation industry in certifying engines for operations in these conditions.
Early airborne measurements (Heymsfield, 1986) of cirrus from deep convection have shown that ice-crystal
aggrega-tion may be important at temperatures below −50◦C.
Crys-tal habit distributions in the anvil cirrus outflows of thunder-storms in general contain typically both compact or plate-like in maritime situations and a mixture of irregular crys-tals what appear to be aggregated plates in continental sit-uations (Lawson et al., 2003). The measurements by Stith et al. (2002) have highlighted that ice-crystal aggregates are
present only at lower temperatures (approximately −43◦C).
By comparing chains of ice crystals observed in clouds with previous laboratory experiments, Connolly et al. (2005) hy-pothesized that the ice particle aggregation processes are caused by intense electric fields.
In this paper we describe combined in situ and remote sensing observations for the characterization of the micro-physical and optical properties near the top of an overshoot-ing convective cell. The in situ measurements reveal un-usual high concentration of small chain-like aggregate ice crystals and large ice water content and extinction. These observations were obtained on 26 May 2007 over Germany during the coordinated German-French CIRrus CLoud Ex-periment (CIRCLE-2, Eichler et al., 2009). The objectives of this campaign were devoted to a better understanding of the processes involved in cirrus cloud life cycles, and to the validation of satellite observations (CALIPSO/CALIOP and CloudSat/CPR). Section 2 presents the field campaign and the aircraft and remote sensing measurements that are dis-cussed in this paper. Section 3 discusses the combined re-mote sensing observations (satellite and airborne data) and cloud in situ measurements related to the description of the properties of the convective cell which overshoots the tropopause. Section 4 gives a detailed description of the mi-crophysical and optical properties of the cloud with implica-tions regarding the ice water content – equivalent reflectivity
factor (IWC-Z) relationship. Finally, Sect. 5 gives an in-terpretation of the observations. Scientific issues related to the microphysical properties and structure of deep convec-tive clouds are discussed with some possible insights regard-ing engineerregard-ing issues related to the flights of commercial aircraft through areas of high ice water content (e.g. Lawson et al., 1998; Strapp et al., 1999 and Mason et al., 2006).
2 Field campaign and measurements 2.1 The CIRCLE-2 experiment
The CIRCLE-2 campaign and the satellite and aircraft co-location strategy were already described in detail (Mioche et al., 2010a). We recall that this campaign (held from 4 to 26 May 2007) involved two Falcon aircraft. The German Falcon operated by DLR (Deutsches Zentrum f¨ur Luft- und Raum-fahrt) was equipped with microphysical and optical in situ probes and with the DLR WALES Lidar (Water Vapour Lidar Experiment in Space, Wirth et al., 2009). The French Falcon operated by SAFIRE (Service des Avions Franc¸ais Instru-ment´es pour la Recherche en Environnement), was carrying remote sensing down-looking from the Radar-Lidar (RALI) system (Protat et al., 2004). The two aircraft were operated from Oberpfaffenhofen (near Munich, Germany) and from Creil (near Paris, France), respectively.
The two Falcon aircraft were co-ordinated to fly under CloudSat-CALIPSO tracks according to the cirrus cloud forecasts based on the European Centre of Medium Range Weather Forecasts (ECMWF) over Western Europe provided by DLR. On both aircraft, the altitude and position param-eters were measured by the airborne GPS systems with an accuracy of 50 m. This allowed us to accurately follow the satellite track for reliable comparisons and to get an accurate altitude reference for all observations. The DLR Falcon flight plan consisted of several in-cloud sequences at constant lev-els, first near the cloud top, and then at different lower levels depending on the cloud width. Each sequence lasted about 15 min–20 min (or 180–250 km long) with a U-turn manoeu-vre at the end of the sequence. The SAFIRE Falcon flight plan was to fly above the cirrus layer at the maximum ceiling (∼12 000 m) with nadir looking observations.
2.2 Instrumentation and measurements aboard the DLR Falcon
In order to characterize the cloud microphysical and opti-cal properties four independent techniques are used in this study: (1) the PMS FSSP-300 operated by DLR, (2) the Particle Cloud Imager (CPI), (3) the PMS 2-D-C and (4) the Polar Nephelometer probes, operated by the Laboratoire de M´et´eorologie Physique (LaMP). Thanks to the combina-tion of these techniques, a descripcombina-tion of particles within a range of diameters varying from a few micrometers (typi-cally 3 µm) to about 2 mm is possible.
The method of data processing, the reliability of the in-struments mounted on the Falcon aircraft and the uncertain-ties of the derived microphysical and optical parameters dur-ing CIRCLE-2 have been described in detail by Mioche et al. (2010a). The method of bulk parameters calculations is summarized in Appendix A. The derivation of the radar equivalent reflectivity factor from the CPI data having been thoroughly detailed by Gayet et al. (2009), we only recall here that the calculations were made for CloudSat/CPR val-idation purposes and consider therefore the dielectric factors of ice at 94 GHz and the ratio of Mie scattering to Rayleigh scattering at 94 GHz.
Because of some intermittent failures which occurred on the PMS 2-D-C data acquisition system, the available data are not discussed in this study but have been used to vali-date the CPI measurements (see Appendix B). Therefore the CPI data were used in order to derive the particle size dis-tributions and the microphysical parameters as Gallagher et al. (2005) in cirrus clouds. The method of calibration of the CPI is described in Appendix B with some results of com-parison with the 2-D-C. The overall uncertainties on derived microphysical parameters from FSSP-300 and 2-D-C/CPI in-struments are 75 %, 85 % and 100 % on particle concentra-tion, extinction coefficient and ice water content, respectively (Gayet et al., 2002). The uncertainty on the radar equiva-lent reflectivity factor calculated from the CPI data has been evaluated to ±4 dBZ (Mioche, 2010b). These error bars in-clude the uncertainties due to a poor statistical representa-tion of just a few large particles that may occur in our case study. Direct measurement of the scattering phase function from the Polar Nephelometer probe allows the calculation of the extinction coefficient and asymmetry parameter with accuracies evaluated to 25 % and 4 %, respectively (Gayet et al., 2002; Jourdan et al., 2010). The accuracies of the in situ measurements reported above could be drastically re-duced by the shattering of large ice crystals on probes with shrouded inlets (Polar Nephelometer, CPI and PMS FSSP and 2-D-C for instance). Appendix C discusses this problem in the context of the observations presented here and gives an assessment on the reliability of the cloud measurements.
The WALES lidar (downward oriented) uses a laser oper-ating at 1064 nm, with parallel and orthogonal polarization detectors (Wirth et al., 2009). The vertical resolution of the derived attenuated backscatter ratio is 15 m and the profiles are available every 0.2 s (∼40 m horizontal resolution). The lidar blind distance is typically 200 m.
Relative humidity was derived from measurements using a CR-2 frost point hygrometer (Buck Research Instruments, Busen and Buck, 1995). Depending on water vapor gradi-ents, the response time of the frost point hygrometer is in the order of few seconds to one minute. The uncertainty in rela-tive humidity with respect to ice RHi (including the temper-ature uncertainty ±0.5 K) amounts to ±11 %. The derivation method of the vertical airspeed from the Falcon aircraft mea-surements has been described in B¨ogel and Baumann (1991).
An error of ±10 cm s−1for a mean value within a flight path
of 200 km (or about 20 min flight duration) is generally ex-pected.
2.3 The RASTA radar onboard the SAFIRE Falcon
As indicated above, the French Falcon 20 was equipped
with the radar-lidar (RALI) instrument. This instrument
(described in details by Protat et al., 2004) is the airborne combination of two instruments: a multi-beam (three an-tennas pointing downward in three non-collinear directions, including one near-nadir pointing angle) 95-GHz Doppler cloud radar named RASTA (Radar SysTem Airborne, see Bouniol et al., 2008 and Protat et al., 2009 for further de-tails) and a triple-wavelength (355, 532, and 1064 nm) and dual-polarization (532 nm) backscatter lidar. Unfortunately, during the 26 May flight the lidar was not operational, so in this study only the Doppler cloud radar observations are used. The vertical and horizontal resolutions of the data
are 60 m and 150 m, respectively. The blind distance is
180 m. The RASTA radar has been calibrated using ocean surface backscatter at 95 GHz (Bouniol et al., 2008). The sensitivity of the airborne cloud radar during CIRCLE-2 was
−31.5 dBZ at 1 km range.
2.4 Satellite data
In this paper we use Meteosat-9 (MET-9), CALIPSO and
CloudSat observations. The MET-9 satellite’s main
pay-load is the optical scanning imaging radiometer, so-called Spinning Enhanced Visible and InfraRed Imager (SEVIRI). It provides image data in four visible and near-infrared channels (0.4–1.6 µm) and eight InfraRed channels (3.9– 13.4 µm). Sampling distances are 1 km for the High Resolu-tion Visible Channel and 3 km for the infrared and the three other visible channels, respectively.
The payload of the CALIPSO satellite includes the Cloud-Aerosol Lidar with Orthogonal Polarization (CALIOP), the Imaging Infrared Radiometer (IIR) and the Wide Field Cam-era (WFC). CALIOP is a laser opCam-erating at 532 nm and 1064 nm, with parallel and orthogonal polarization detec-tors at 532 nm (Winker et al., 2003; Hunt et al., 2009). The horizontal and vertical resolutions of the attenuated backscattering coefficient product used here are 5 km and
60 m, respectively. IIR is a nadir-viewing, non-scanning
imaging radiometer having a 69 km swath with a pixel size of 1 km which provides measurements at three channels in the thermal infrared window region at 8.65 µm, 10.6 µm, and 12.05 µm with a bandpass of 0.9 µm, 0.6 µm and 1 µm respec-tively (Winker et al., 2010). The CALIOP beam is nominally aligned with the center of the IIR image. WFC is a fixed, nadir-viewing imager with a single spectral channel cover-ing the 620–670 nm region, selected to match the band 1 of the MODIS (MODerate resolution Imaging
Spectroradiome-Figure 1
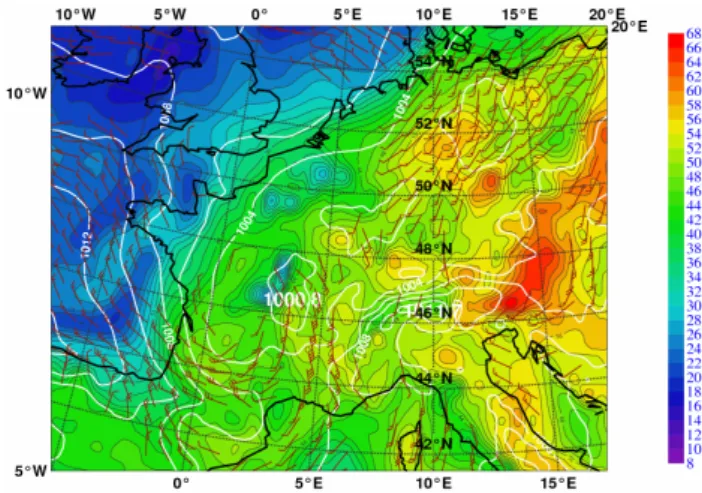
Fig. 1. Equivalent potential temperature (color shading,◦C), and
horizontal wind (barbs) at the 850 hPa pressure level on 26 May 2007, 12:00 UTC. White contour lines: mean sea level pressure in hPa.
ter) instrument on NASA’s Aqua satellite. The Instantaneous Field of View (IFOV)/swath is 125 m/61 km.
CloudSat carries a 94 GHz (3.2 mm) cloud profiling radar (CPR) to provide the vertical distribution of hydrometeors on a global scale (Stephens et al., 2002). The CPR has a nominal
vertical resolution of 500 m and a footprint of 1.4 × 1.7 km2
(cross and along track) for a CPR profile. The CIRCLE-2 observations gathered by RASTA under the CloudSat track have allowed a through validation of the calibration of the CloudSat radar (Protat et al., 2009) using common samples
of ocean surface returns and ice cloud reflectivities. An
agreement within 1 dB has been reached between RASTA and CloudSat.
2.5 Weather situation
As mentioned above the first part of the research flight on 26 May 2007 consisted of several sequences at different levels with quasi-collocated trajectories with the CALIPSO over-pass (12:32 UT) in the surrounding cirrus of the convective system (Mioche et al., 2010a). According to the ECMWF op-erational analyses, warm and humid air (see the high equiv-alent potential temperature in Fig. 1) originating from the Mediterranean had been advected over the Alps. This unsta-ble air mass preceded a slowly eastward propagating trough which was situated over France. Vertical profiles of air tem-perature and dew-point temtem-perature were measured by the Falcon aircraft during the descent sequence at the end of the flight (13:10–13:54 UT), see Fig. 2a. These profiles
in-dicate an unstable layer extending from about 2700 m (7◦C
at the cloud base) up to about 10 700 m altitude (−56◦C at
the tropopause). The vertically unstable stratification in the warm sector of the approaching cold front favoured the de-velopment of deep convective clouds already in the morning hours of this day. Figure 2b displays the theoretical adiabatic
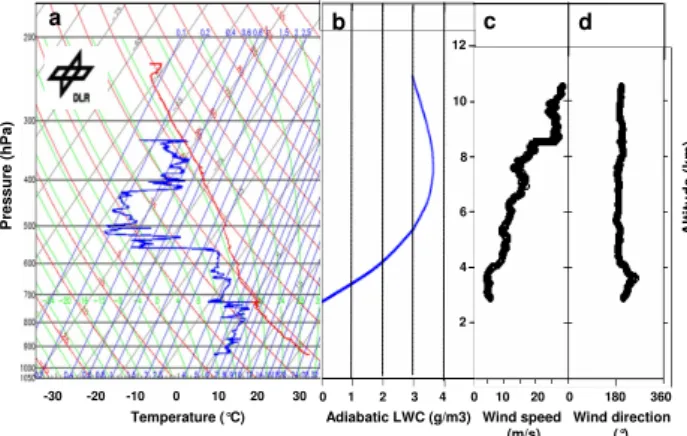
Temperature (°C) Adiabatic LWC (g/m3) Wind speed Wind direction (m/s) (°) -30 -20 -10 0 10 20 30 0 1 2 3 4 0 10 20 0 180 360 12 10 8 6 4 2 A lt it u d e ( k m ) P re s s u re ( h P a ) Figure 2 A lt it u d e ( k m ) a b c d
Fig. 2. Vertical profiles of (a): temperature and Dew-point mea-sured by the Falcon; (b): theoretical adiabatic liquid water con-tent (LWC); (c) and (d): wind speed and direction components, respectively.
liquid water content (LWC) assuming the thermodynamic properties of the cloud base as indicated above. A
maxi-mum adiabatic LWC of 3.6 g m−3is found at 7800 m altitude
(T = −32◦C). Figure 2c and d confirm the prevailing
south-westerly winds measured by the Falcon aircraft.
During the last part of the flight (∼35 min after the satel-lite overpass) the Falcon flew through an overshooting con-vective cell near the cloud top at 11 080 m altitude (T =
−58◦C). The subsequent in situ observations of this cloud
and their interpretation are the object of this paper.
3 Remote sensing observations
In this section we shall present combined remote sens-ing observations (satellite and airborne data) and cloud in situ measurements related to the description of the proper-ties of a convective cell which overshoots the tropopause. The SEVIRI, CALIPSO and CloudSat observations taken at 12:32 UT are first presented. Then the airborne radar RASTA aboard the SAFIRE aircraft performed at 12:57 UT are dis-cussed followed by the airborne measurements aboard the DLR Falcon (at 13:07 UT) including cloud in situ and remote data.
3.1 Analysis of the observations from SEVIRI, CALIPSO and CloudSat
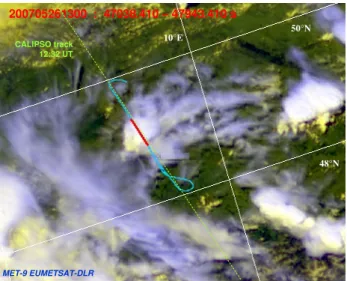
Figure 3 displays false color composites of MET-9/SEVIRI
observations (approx. 3.5 × 5 km2 pixel size) on 26 May
2007 at 13:00 UT. The Falcon trajectory between 12:45 and 13:15 UT is superimposed on the SEVIRI image. The red segment indicates the in-cloud measurements (13:07:30 to 13:10:30 UT) related to the penetration into the convective cloud. The flight trajectory prior to the convective cloud pen-etration, and partially represented on Fig. 3, was carried out
in an adjacent cirrus cloud located southwards to the con-vective cell. This flight pattern was designed to validate CALIPSO and CloudSat observations (Mioche et al., 2010a). Despite a weak temporal coincidence with the airborne measurements, the CALIPSO and CloudSat observations (12:32 UT) prove to be useful in obtaining overview and evo-lution of the cloud situation. Figure 4 displays a compos-ite representation (from top to bottom) of SEVIRI (taken at 12:30 UT, i.e. two frames before the image displayed on Fig. 3), WFC reflectance and IIR brightness temperature images and the vertical profiles from CALIOP (attenuated backscatter coefficient) and the equivalent reflectivity fac-tor from CloudSat. These observations, are plotted along
the CALIPSO track between 48.5 and 49.5◦N of latitude
(study area). The swath of WCF being 61 km wide, the SE-VIRI image has been sized accordingly. The results show that ∼35 min before the cloud in situ measurements, the CALIPSO/CloudSat satellites overpass the convective
sys-tem located around 49◦N.
The SEVIRI, WFC and IIR images give qualitatively a rather coherent picture of the cloud field. The WFC image (Fig. 4b) depict a typical feature of a convective system
(lo-cated between 48.85◦and 49.0◦N) with, at least, three
indi-vidual cells characterized by high reflectance near the cloud top indicating very dense clouds. Low IIR brightness tem-peratures of 218–220 K at 12.05 µm are found in these areas (Fig. 4c). Compared to the SEVIRI image at 13:00 UT (i.e. 28 min later or 7 min prior to the DLR Falcon in situ obser-vations), the cloud system is observed roughly at the same location whereas the surrounding cirrus clouds are advected
according to the main wind at these levels (25 ms−1/200◦).
CALIOP and CloudSat profiles exhibit very well the convec-tive cell with high values of the attenuated backscatter coef-ficient (β) with strong signal attenuation at lowermost lev-els over a distance of about 50 km along the satellite track. These anomalously high values of CALIOP integrated atten-uated backscatter near the top of center layers have recently be analyzed in mesoscale convective systems (MCS, Platt et al., 2011). The top of the overshooting cell is detected at 10 900 m whereas the altitude of the surrounding cirrus-cloud top is estimated at 10 700 m. It should be noted that the subsequent profile of the CALIOP depolarisation ratio (not shown here) does not reveal any indication of oriented pristine ice crystals and therefore cannot explain the high β values observed in the overshooting cell and in the
surround-ing cirrus (between 49.0 and 49.13◦N). The CloudSat profile
(Fig. 4e), reveals a low reflectivity (∼0 dBZ) near cloud top and a significant echo down to the surface due to precipi-tating particles. We shall strengthen these results with the airborne observations from the RASTA radar.
10°E 50°N 48°N 200705261300 : 47038.410 – 47943.410 s CALIPSO track 12:32 UT MET-9 EUMETSAT-DLR Figure 3
Fig. 3. False color composites of MET-9/SEVIRI observations from 26 May 2007 at 13:00 UT. The Falcon trajectory (between 12:45 and 13:15 UT) is superimposed (blue line). The flight segment in red color indicates the penetration in the convective cloud. The CALIPSO track (at 12:32 UT) is also displayed.
3.2 Airborne equivalent reflectivity measurements from RASTA
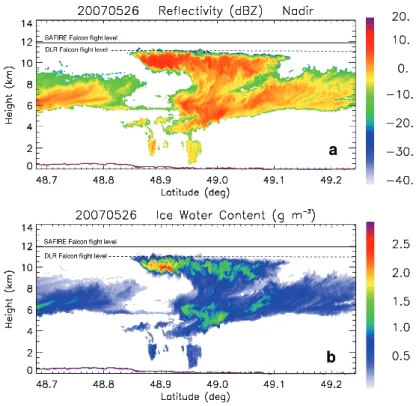
As mentioned above, the SAFIRE Falcon overpassed the cloud system following a flight trajectory co-located with the CALIPSO track. The observations were carried out at 12:57 UT, i.e. ∼25 min after the CALIPSO time and about 10 min prior to the DLR Falcon in situ measurements. Fig-ure 5a displays the vertical profile of the RASTA equivalent reflectivity factor measured along the SAFIRE Falcon trajec-tory. Compared to the CloudSat profile on Fig. 4e the differ-ences between the vertical cloud structures are likely due to the weak temporal coincidence with the satellite observations and subsequent combined time variations and advection of the cloud system. However, the overshooting cell is well de-scribed with rather large vertical gradients of the equivalent reflectivity factor near the cloud top detected at 11 300 m. Therefore, we may conclude that the convective cell over-shoots by up to 600 m the tropopause level (estimated at 10 700 m from the aircraft sounding, Fig. 2) whereas a sig-nificant increase of the high-reflectance horizontal area is ob-served from SEVIRI images between 12:30 and 13:00 UT (cf. Figs. 4a and 3, respectively). We shall describe now in detail the measurements performed with the DLR Falcon at 11 080 m, i.e. 200 to 300 m below the top of the overshooting cell.
3.3 Aircraft measurements on the DLR Falcon
Figure 6 (upper panel) represents the time-series (1 Hz) of cloud in situ parameters, namely: the concentration of ice particles with diameter larger than 3 µm and 100 µm (Conc
A lt it u d e ( k m ) 10 8 6 4 2 10 8 12 Latitude (°N) 48.5 49.0 49.5 CALIPSO 532 nm CloudSat 94 GHz WFC ββββ (m -1 s r-1 ) - 1.0 - 1.5 - 2.5 - 2.0 R e fl e c ti v it y fa c to r (d B Z ) 20 10 0 - 10 - 20 - 30 - 40 II R 30.5 0. 30.5 S w a th (k m ) 30.5 0. 30.5 S w a th (k m ) 330 K 200 K B ri g h t. T e m p . R e fl e c ta n c e 1 0 Figure 4 SEVIRI a b c d e
Fig. 4. Composite-latitude representations (between 48.5 and
49.5◦N, i.e. area study) of: (a) SEVIRI (color composite); (b)
Wide Field Camera (WFC) images; (c) Imaging Infrared Radiome-ter (IIR); (d) Vertical profile of the attenuated backscatRadiome-ter coefficient from CALIOP and (e) vertical profile of the equivalent reflectiv-ity factor from CloudSat. CALIPSO (WCF, IIR and CALIOP) and CloudSat observations were taken at 12:32 UT. The Falcon trajec-tory (from 12:15 to 12:45) is superimposed on the SEVIRI image (taken at 12:30 UT). The CALIPSO trace (red line) is reported on SEVIRI, WFC and IIR images.
and C100, respectively), both inferred from FSSP-300 and CPI data, the extinction coefficient and the asymmetry pa-rameter (Ext and g, respectively), derived from the Polar Nephelometer, the effective diameter (see definition in Gayet et al., 2004), the ice water content and the equivalent reflec-tivity factor (Deff, IWC and Z, respectively) calculated from FSSP-300 and CPI data. The results of two distinct cloud flight sequences are reported: firstly from 12:42–12:55 UT which relates cirrus observations (see horizontal trajectory on Fig. 3), and secondly from 13:03–13:13 UT with observa-tions during the convective cell penetration (see red segment on Fig. 3). We note in passing that no cloud was experi-enced between 12:55 and 13:03 UT, the two sequences have been separated for simplicity on Fig. 6. A first overview of
Fig. 5. Airborne RASTA radar observations along the SAFIRE aircraft trajectory at 12:57 UT. (a): Vertical profile of the equivalent reflec-tivity at 95 GHz and (b): Vertical profile of the retrieved ice water content. The flight altitudes of the SAFIRE and DLR Falcon aircraft are indicated with full and dotted lines, respectively.
the results highlights significant differences in microphysical and optical properties between the convective cell and cirrus. Unusual high values of ice particles concentration, extinc-tion and ice water content are experienced in the convective cell particularly when compared with the cirrus properties,
i.e. 54/6 cm−3, 19.8/3.1 km−1, 0.44/0.05 g m−3 (mean
val-ues) contrasting with smaller effective diameters (43/80 µm) and similar equivalent reflectivity factors (∼0 dBZ). These measurements will be discussed with details in Sect. 4 be-low.
Figure 6 (middle panel) displays the vertical profile of the attenuated backscatter ratio (at 1064 nm) from the WALES li-dar along the flight trajectory. The altitude of the Falcon (also reported on Fig. 6: black curve) shows that during the first
se-quence the flight altitude increases from 8100 m/−33◦C to
10 800 m/−56◦C. The second sequence was performed at a
constant level: 11 080 m/−58◦C. The cirrus optical depth (in
the visible) underneath the flight level has been evaluated to 3 from averaged in situ extinction profiles. Therefore the lidar signal can describe all the cirrus depth. To the contrary, the lidar returns are fully attenuated as soon as the aircraft pene-trates the convective cell (see microphysical measurements on the upper panel from 13:07:30 to 13:10:30 UT). This nicely confirms the CALIOP observations reported above (see Fig. 4d) with high attenuated backscatter values (up to
0.67 km−1sr−1) and high depolarization ratio (up to 0.7).
These properties are expected especially for small ice crys-tals (Mishchenko and Sassen, 1998). In this way, the in situ observations of the high concentration of small ice particles are further evidenced by the observation of the high depo-larisation ratio for this specific deep convection cloud. Fur-thermore the global survey of CALIOP linear depolarisation ratios by Sassen and Zhu (2009) shows that high depolarisa-tion ratios are found predominantly at low latitudes, a region where deep convection is most frequent.
As for the cloud particles, they are definitively ice
crys-tals since the temperature is −58◦C, a value much below the
temperature for which the supercooled liquid water droplets
freeze by homogeneous nucleation (−37◦C). On the other
hand, the asymmetry factor is smaller than 0.8 (see Fig. 6) in-dicating ice crystals occurrence as confirmed by CPI images (see Sect. 4.1). A careful examination of the measurements indicates that the aircraft was flying just above the convective cloud top from 13:10:30 UT (as soon as it leaves the cell) to 13:11:05 UT (end of attenuated lidar returns).
Figure 6 (bottom panel) represents the time-series of re-trieved parameters from SEVIRI observations along the hor-izontal Falcon trajectory, namely: the effective radius, the optical depth and the brightness temperature (green curve) in the IR channel at 10.8 µm with the air temperature mea-sured by the Falcon (black curve). The inversion technique of the SEVIRI spectral data has been described by Bugliaro
Figure 6
Fig. 6. 1st panel: Time-series of cloud in situ parameters: Conc and C100: Concentration of ice particles (d > 3 µm and d > 100 µm, respectively); Ext: Extinction, g: Asymmetry parameter; Deff : Effective diameter; IWC: Ice water content and Z: Reflectivity factor. 2nd panel: Attenuated backscatter ratio (at 1064 nm) from WALES lidar. 3rd panel: Time-series of retrieved parameters from SEVIRI observations along the Falcon flight: Effective radius, Optical depth and Brightness temperature (green curve) in the IR channel (10.8 µm) with the air temperature measured by the Falcon (black curve). The first sequence reports cirrus (12:42–12:55 UT). The sequence from 13:03
to 13:13 UT describes the overshooting convective cloud sampled near the top at 11 080 m/−58◦C level.
et al. (2011) for the retrieval of the cloud properties (top height, thermodynamic phase, optical thickness, effective ra-dius, cloud water path, . . . ). For validation purposes, this technique can provide retrieved cloud products along aircraft research flights by navigating the flight trajectory within the satellite coordinates. Because the SEVIRI data are available every 15 min, errors in collocation could be considered due to differences between SEVIRI and Falcon data acquisition times (±7.5 min maximum time lag). The SEVIRI retrieved parameters confirm the occurrence of small ice crystals in the convective cell compared to the cirrus (effective radius of
∼15 µm versus 60 µm) with high optical thickness (40). The
IR brightness temperature fits remarkably well with the in situ temperature measurements near the top of the convective
cell (215 K, −58◦C). We note in passing that the
tempera-ture retrieved from IIR is greater (−53◦C/220 K, see Fig. 4c)
maybe because the lower altitude of the cloud top (10 900 m) detected by CALIOP 28 min earlier.
CPI Conc = 54 cm-3 C100 = 192 l-1 FSSP-300 CPI
a
Figure 7 Ext = 19.8 km-1 g = 0.776 T = - 58°C Conc = 6 cm-3 C100 = 12 l-1 FSSP-300 Ext = 3.1 km-1 g = 0.773 T = - 33°Cb
c
d
e
f
1 10 100 1000 1 10 100 1000 0 60 120 180 10 1 10-1 10-5 10-3 E x ti n c ti o n ( k m -1 µµµµ m -1) 10-7 10-8 10-11 10-9 10-10 A n g u la r S c a tt te ri n g c o e f. ( µµµµ m -1 s r -1) Scattering angle (°) Diameter (µµµµm) Diameter (µµµµm) 10 5 10 3 10-3 101 10-1 C o n c e n tr a ti o n ( l -1 µµµµ m -1) FSSP-300 CPI IWC = 0.44 g/m3 Deff = 43 µµµµm FSSP-300 CPI IWC = 0.05 g/m3 Deff = 80 µµµµm CPI 1 10 100 1000 1 10 100 1000 0 60 120 180 Scattering angle (°) Diameter (µµµµm) Diameter (µµµµm) 10 5 10 3 10-3 101 10-1 C o n c e n tr a ti o n ( l -1 µµµµ m -1) 10 1 10-1 10-5 10-3 E x ti n c ti o n ( k m -1 µµµµ m -1) 10-7 10-8 10-11 10-9 10-10 A n g u la r S c a tt te ri n g c o e f. ( µµµµ m -1 s r -1)Fig. 7. Mean microphysical and optical properties of the overshooting cell (13:08:15–13:08:40 UT) and the cirrus (12:43:30–12:46:40 UT): (a) and (d) Particle size distributions; (b) and (e): Particle extinction distributions; and (c) and (f): Scattering phase functions, respectively. The mean values of the parameters over the indicated cloud sequences are reported. Conc: Ice partice concentration; C100: Concentration of particles with d >100 µm; IWC: Ice water content; Deff : Effecive diameter; Ext: Extinction coefficient; g: Asymmetry parameter; and T : Temperature.
4 Cloud in situ measurements and retrieved observations
4.1 On the microphysical and optical properties
In the following we focus on the cloud in situ measurements performed near the top of the overshooting convective cell (from 13:07:50 to 13:09:10 UT, see Fig. 6). For comparison purposes the properties of the surrounding cirrus cloud (from 12:43:30 to 12:46:40 UT) will also be discussed. Coming back to Fig. 6, the results show that the aircraft penetration of the overshooting cell lasted 3 min (13:07:30–13:10:30 UT) which corresponds to a horizontal distance of 36 km. Un-usual high values of the ice particle concentration, extinction,
ice water content (up to 70 cm−3, 30 km−1and 0.5 g m−3,
re-spectively) are experienced. The frequency of occurrence of
IWC shows that IWCs larger than 0.3 g m−3occurred 50 %
of the penetration time. From our knowledge these values were never observed in convective clouds at mid-latitude
in Western Europe at such low temperature (−58◦C). IWC
from 1.5 to 2.5 g m−3were reported in anvils of intense
mid-latitude storms over the Great Plains of USA (Heymsfield and Palmer, 1986; Lawson et al., 1998). Likewise in Trop-ical convective turrets clouds, ice water content exceeding
2 g m−3 and extinction up to 60 km−1 have been measured
(Lawson et al., 2010). High concentration of small ice
crys-tals (up to 100 cm−3) have been measured near the top of
Tropical cumulonimbus (Knollenberg et al., 1993). In
sub-tropical and Tropical convection Heymsfield et al. (2005) and Heymsfield et al. (2006) reported high concentration of small
ice crystals in the order 50 cm−3and even in maritime
Trop-ical convective updrafts (Heymsfield et al., 2009).
Figure 7 displays the mean microphysical and optical properties of the overshooting cell (13:08:15–13:08:40 UT) and the cirrus (12:43:30–12:46:40 UT) with the representa-tions of: (a) and (d) the particle size distriburepresenta-tions, (b) and (e) the extinction size distributions and (c) and (f) the scat-tering phase functions, respectively. The mean values of the parameters over the indicated cloud sequences are also re-ported. The results show that the rather narrow particle size distribution observed in the overshooting cell (Fig. 7a) car-ries about 10 times more ice particles (and subsequent bulk parameters) than the values of the cirrus cloud with a much broader size spectrum (Fig. 7d). The corresponding effective diameters are 43 µm and 80 µm and the maximum particle sizes are ∼300 µm and ∼1 mm, respectively. The extinction size distributions for the two clouds (Fig. 7b and e) show rather acceptable qualitative agreements in the probe size-bins overlapping. It should be noted that in both cases most of the extinction is carried by particles with effective diam-eters between about 15 and 35 µm. We recall that this size range is the most affected by the inherent shortcomings on probes and data processing, which limit the accuracy of de-rived microphysical and optical parameters reported in this paper.
a b
Figure 8 Fig. 8. Examples of ice crystal images measured by the CPI in-strument. (a): Chain-like aggregates observed near the top of the
overshooting cell (11 08 0m/−58◦C). (b): Bullet-Rosettes sampled
near −45◦C in the cirrus.
Smooth and featureless phase functions (Fig. 7c and f) with similar asymmetry factors (0.776 and 0.773, respec-tively) indicate fairly uniform optical properties. This con-firms previous observations (Gayet et al., 2011) that parti-cles with imperfect or complex shapes are prevalent in ice clouds. Indeed, examples of ice crystal images measured by the CPI instrument are displayed on Fig. 8. While
Bullet-Rosettes are observed in the cirrus near −45◦C (Fig. 8b), a
common feature for in situ cirrus forming (see among others, Sassen et al., 2001), typical chain-like aggregates ice crystals are highlighted near the top of the overshooting convective cloud (Fig. 8a). Chains of ice crystals have already been
ob-served at low temperatures (below −43◦C) in anvils from
continental deep convective clouds by Stith et al. (2002), Lawson et al. (2003) and Connolly et al. (2005). From the particle samples displayed on Fig. 8a the distinction between typical chains of particles and aggregates with heavy irreg-ular shapes could be somewhat arbitrary. The largest par-ticles are qualitatively recognized having mostly 3D irregu-lar shapes resembling sometimes to “graupels” although they have no definite central crystal seed. A visual classification roughly gives a proportion of 70 % of typical chains of ice crystals and ice particles exhibiting a faceted shape have been rarely observed. These properties are experienced all along the overshooting cloud penetration. The explanation for the occurrence of chain-like aggregate ice crystals will be dis-cussed in Sect. 5 below.
4.2 On the IWC-Z relationship and application to radar measurements
The IWC-Z relationships are key issues for deriving the cloud ice water content from retrieved equivalent reflectiv-ity factors obtained with remote sensing (airborne or space-borne) observations. The cloud in situ measurement data set reported above can be used in order to assess these IWC-Z relationships. Figure 9 displays the results with both param-eters calculated from the FSSP-300 and CPI instruments at
Reflectivity factor (dBZ)
L
o
g
1 0(I
W
C
)
(g
/m
3
)
-50 -40 -30 -20 -10 0 10 20 1 0 -1 -2 -3 -4Figure 9
Log10IWC = 0.0486 Z - 0.220 σ= 0.61 Log10IWC = 0.0536 Z -0.971 σ= 0.63Fig. 9. IWC-Z relationships for the convective overshooting cloud and the cirrus observations (red and blue symbols, respectively). The slope parameters and correlation coefficients are reported. Hor-izontal and vertical bars represent the uncertainties on the equiva-lent radar reflectivity (±4 dBz) and on the ice water content (100 %) derivations, respectively.
1 Hz frequency. Two distinct linear tendencies are clearly sorting out according to the considered cloud types with dif-ferent power-law curves fitted through the data. It should be noted that the relationship for the cirrus is similar to the results from previous works related to cirrus cloud observa-tions (see among others Protat et al., 2007 and Sayres et al., 2008). For a given equivalent reflectivity factor, IWCs are significantly larger for the overshooting cell than for the cir-rus. Indeed, Z and IWC being proportional to the 6th and 3rd moment of the size distribution respectively, the differ-ences in the respective power-laws are explained by smaller particle sizes (see Fig. 7a and b) in the convective cloud.
It is interesting now to apply the above results to the avail-able equivalent reflectivity measurements from the airborne RASTA radar (see Sect. 3.2). We recall that the highest cloud tops were detected near 11 300 m, meaning that the in situ DLR Falcon observations were performed 200 to 300 m low the cloud top. Nevertheless, the direct comparisons be-tween radar and in situ data are hampered by the weak tem-poral coincidence (∼10 min) of the combined observations and the combined-accuracies of both aircraft altitude mea-surements (±100 m) which are critical in this issue due to strong vertical gradients of the reflectivity near the cloud top (see Fig. 5a). Applying the IWC-relationship experienced in the convective cloud from in situ measurements (see Fig. 9),
the RASTA equivalent reflectivity radar profiles could be scaled into ice water content assuming, of course, same prevalent microphysical properties over the cloud depth. The results are displayed on Fig. 5b and show that IWC up to
1 g m−3may be observed within a layer depth of ∼300 m
be-low the cloud top. IWCs up to 2 g m−3 (corresponding to
radar reflectivities of about 15 dBZ) are retrieved over a dis-tance of 2.5 km at the 10 000 m level.
Extrapolating the relationship for stronger convective
sys-tems with similar ice particles, IWC up to 5 g m−3could be
experienced with reflectivity factor no larger than 20 dBZ. This means that for similar situations, indication of rather weak radar echo does not necessarily warn the occurrence of high ice water content carried by small ice crystals. This is maybe the reason why the DLR Falcon’s pilots decided to safely fly into the storm having no significant or warning-indicative signal returns from the onboard radar. These un-usual observations could be important regarding engineering issues related to the failure of jet engines commonly used on commercial aircraft during flights through areas of high ice water content as reported by Lawson et al. (1998), Strapp et al. (1999) and Mason et al (2006). From the analysis of 46 jet engine power loss events, Mason et al. (2006) mentioned that no flight-radar echoes at the location and altitude of the event is part of common observations in transport aircraft. The events were recorded over continental areas with some of them over Western Europe.
Nevertheless we must keep in mind the large uncertain-ties of the relationships above (i.e. data dispersion on Fig. 9) mainly due to probe shortcomings and errors in deriving IWC and Z associated to the hypothesis in crystal mass-size varia-tions and ice density. Furthermore a just a few large particles can swamp the reflectivity calculations as exemplified by the reflectivity distribution on Fig. B1d (Appendix B) measured in the overshooting cell. The results show a poor statistical representation of particles larger than about 250 µm due to the CPI sampling volume. This is confirmed by the careful examination of the CPI ice-crystal images (recorded in the convection cell penetration), which did not reveal particles larger than 300 µm. Considering a subsequent
underestima-tion about 30 % of the reflectivity expressed in mm6m−3,
this correspond to 50 % on dBZ, a value which is within the error bars of the measured reflectivity. The reflectivity factor derivation considers a 94 GHz wavelength (CloudSat radar) for which the Mie effects become important for par-ticles larger than ∼500 µm (Boudala et al., 2006). Usually, the relationships describing the properties of deep convective systems are drawn up from C-band radars which are dedi-cated to precipitation observations (see for instance Bringi et al., 1984).
5 Interpretation of the observations of the overshooting cell
The overshooting convective cloud sampled near the top at
11 080 m/−58◦C level is coherently described by combined
in situ and remote sensing observations. These observations highlight very high concentration of small ice crystals with mostly chain-like aggregate shape measured all along the cloud penetration. As mentioned above chains of ice crys-tals have already been observed at low temperatures (below
−43◦C) in continental anvils. Connolly et al. (2005)
re-ported that chain crystals were a very small fraction of the to-tal population from measurements performed outside updraft regions (due to safety constraints). In our case the Falcon ex-perienced the core of the cloud (see Fig. 3) during the over-shooting phase of the convective system, explaining a much higher proportion of chains of ice crystals (see Fig. 8a). Our measurements confirm that chains of ice crystals are found in a continental deep convective system, which has presumably high concentration of aerosols. Although no direct obser-vations of cloud electrical activity are available, these con-ditions are likely favourable for lightning occurrence. This feature is confirmed from the satellite climatology results by Sherwood et al. (2006) who found that lightning counts ap-pear related to the amount of small ice (effective diameter <30 µm) that appears at (continental) cloud top. Indeed, fol-lowing the detailed discussion by Connolly et al. (2005) the ice particle aggregation processes are caused by intense elec-tric fields. These researchers conclusively compared chains of ice crystals observed in cloud with previous laboratory experiments (see for instance Saunders and Wahab, 1975). Our measured ice number concentrations being high, this fulfils the requirement of Wahab (1974) for electrically
en-hanced aggregation (>2 cm−3). No laboratory observations
being available at temperature lower than −20◦C, the
ques-tion whether the aggregaques-tion process is efficient at low tem-perature remains unanswered (Connolly et al., 2006).
The careful examination of the ice crystal images from the CPI clearly shows chains of particles of up to several tens of individual particles long (see typical examples on Fig. 10). The individual particles can easily be recognized to be frozen droplets, which often remain with a quasi-spherical shape and a diameter of 15–20 µm. These observations may be ex-plained by vigorous updrafts which lift supercooled droplets.
Once they reach the −37◦C level (8300 m in our case) the
extremely rapid freezing of these droplets by homogeneous nucleation leads to very high concentration of small ice par-ticles at upper levels. The aggregation process then takes
place in presence of intense electric field. The
observa-tion of high ice water contents (up to 0.5 g m−3)near the
cloud top compared to the maximum value of the
theoret-ical adiabatic liquid water content at 8300 m (∼3.6 g m−3)
may be an indication of the entrainment of dry environmen-tal air near the cloud top. At lower altitudes, the retrieved
closer to the adiabatic value. This feature does not seem to be confirmed by measurements of the relative humidity (over ice) performed by the CR2 instrument (RHi) aboard the Falcon. Figure 11 displays the time-series of RHi with the vertical airspeed component, ice water content, effective diameter and asymmetry parameter. The results show that RHi remains close to 100 % (with uncertainties of ±11 %) over about 30–40 % of the cloud penetration. Another ob-servation which is important to underscore is the fact that extremely rare ice particles exhibit a faceted shape indicat-ing that the growth regime via vapour deposition was defi-nitely not efficient during the updraught lift. Therefore high concentrations of small ice particles typically produced by homogeneous nucleation are sufficient to deplete the water vapour (as confirmed with RHi measurements) and suppress further nucleation, even in very strong updrafts as discussed by Heymsfield et al. (2005). The vertical wind component on
Fig. 11 rather shows moderate updrafts (up to 2 m s−1) with
horizontal wind shear of ±2 m s−1likely because the
obser-vations address the cloud top properties. This may not pre-clude the possibility that much stronger updraughts occurred at lower levels which generated electric field high enough for enhancing ice particle aggregation process.
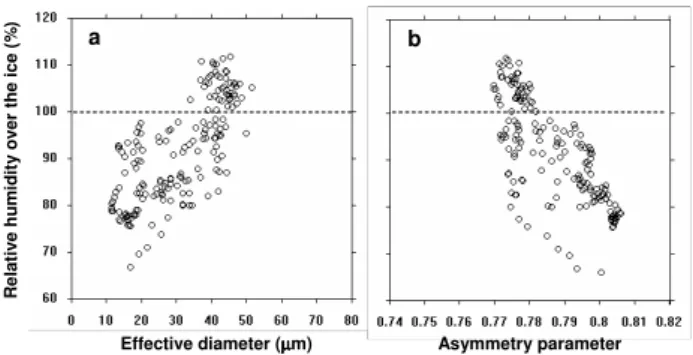
Figure 12a and b display the effective diameter and the asymmetry parameter as a function of RHi. The decrease of the effective diameter with decreasing RHi (<100 %, Fig. 12a) is obviously an indication that the particles are sublimating. Conversely, the asymmetry parameter increases with RHi because the optical properties are controlled by the smallest particles, which have probably smoothed irregular shape compared to the largest chain ice crystals (see Fig. 10). These features occur preferentially outside the denser part of
the cloud (i.e. IWC <∼0.3 g m−3, see Fig. 11).
Despite large uncertainties on quantitative values of mi-crophysical and optical parameters (ice particle concentra-tion, extinction coefficient, ice water content), the combined in situ measurements and remote observations lead to a co-herent description of the properties of the overshooting con-vective cloud. The strong attenuation of the WALES lidar returns even in the first lowermost cloud layers undoubtedly confirms a very dense cloud with high concentration of small ice particles and high extinction. A similar feature is ob-served from CALIOP data and the SEVIRI retrieved param-eters confirm the occurrence of small ice crystals near the top the convective cell. These numerous small ice crystals may carry significant ice water content with conversely a low equivalent reflectivity factor. These observations address scientific issues related to the microphysical properties and structure of deep convective clouds and confirm that parti-cles smaller than 50 µm may control the radiative properties in convective-related clouds.
Figure 10
Fig. 10. Typical examples of chain-like aggregates ice crystals from 2 up to 15 individual frozen droplets.
Figure 11 Fig. 11. Time-series of parameters measured in the overshooting cell (13:07–13:10 UT): Vw: wind component, RHi: Relative hu-midity over ice, IWC: ice water content, Deff: effective diameter and g: asymmetry parameter.
6 Conclusions
In this paper we described combined in situ and remote sens-ing observations for the characterization of the
microphysi-cal and optimicrophysi-cal properties near the top (11 080 m/−58◦C) of
an overshooting convective cell in mid-latitude continental area over Europe. Quasi-simultaneous spaceborne observa-tions from SEVIRI, CALIPSO and CloudSat combined with airborne RASTA radar reflectivity depict very well the con-vective cells which overshoot by up to 600 m the tropopause level estimated at 10.7 km, i.e. the altitude of the surrounding cirrus cloud top.
Unusual high values of the ice particle concentration,
ex-tinction, ice water content (up to 70 cm−3, 30 km−1 and
0.5 g m−3, respectively) are experienced. Ice water contents
larger than 0.3 g m−3occurred 50 % of the penetration length
R e la ti v e h u m id it y o v e r th e i c e (% )
Effective diameter (µµµµm) Asymmetry parameter
Figure 12
b a
Fig. 12. (a) Effective diameter and (b) asymmetry parameter versus the relative humidity over the ice. The data concerns the overshoot-ing cell.
were never observed in convective clouds at mid-latitude in
Western Europe at such low temperature (−58◦C). These
values, which characterize a very dense cloud, are confirmed by a strong attenuation of the WALES lidar returns, even in the first lowermost cloud layers. A similar feature is observed from the CALIOP data. The mean effective diameter is of 43 µm and the maximum particle size is ∼300 µm. The SE-VIRI retrieved parameters confirm the occurrence of small ice crystals at the top of the convective cell. Smooth and featureless phase functions with asymmetry factors of 0.776 indicate fairly uniform optical properties. This confirms pre-vious observations that particles with imperfect or complex shapes are prevalent in ice clouds.
Two distinct linear tendencies of the IWC-Z relationships (ice water content – equivalent reflectivity factor) character-ize the overshooting cell and the surrounding cirrus clouds. For a given equivalent reflectivity factor, IWCs are signif-icantly larger for the overshooting cell than for the cirrus. The differences in the respective power-laws are explained by smaller particle sizes in the convective cloud. Assum-ing same prevalent microphysical properties over the cloud depth, RASTA reflectivity profiles scaled into ice water
con-tent show that retrieved IWC up to 1 g m−3may be observed
near cloud top.
Extrapolating the relationship for stronger convective
sys-tems with similar ice particles, IWC up to 5 g m−3could be
experienced with reflectivity factor no larger than 20 dBZ. This means that for similar situations, indication of rather weak radar echo does not necessarily warn the occurrence of high ice water content carried by small ice crystals. These observations could be important regarding engineering issues related to the failure of jet engines commonly used on com-mercial aircraft during flights through areas of high ice water content.
The other interesting observation concerns the shapes of the ice crystals, which are dominated by chain-like aggregate ice particle measured all along the cloud penetration. The ice crystal images from the CPI clearly show chains of particles
of up to several tens of individual particles long. The individ-ual particles are recognized to be frozen droplets which still remain with a quasi-spherical shape and a diameter of 15– 20 µm. Our results confirm previous observations that the chains of ice crystals are found in continental deep convec-tive systems which are known generally to be very electri-cally active. By comparing chains of ice crystals observed in cloud with previous laboratory experiments, Connolly et al. (2005) hypothesized that the ice particle aggregation pro-cesses are caused by intense electric fields.
The observations above suggest that the supercooled droplets lifted in the vigorous updrafts are frozen extremely
rapidly by homogeneous nucleation near the −37◦C level,
producing therefore high concentrations of very small ice particles. The aggregation process then takes place in pres-ence of intense electric field. The observed ice water contents
lower than the adiabatic values (0.5 g m−3versus 3.6 g m−3)
near the cloud top may be an indication of the entrainment of dry environmental air near. This feature does not seem to be confirmed by measurements of the relative humidity (over ice) which remains close to 100 % over about 30–40 % of the cloud penetration. Because ice particles exhibiting faceted shapes were rarely observed, this means that the growth regime via vapor deposition was definitely not efficient dur-ing the updraft lift. Therefore high concentrations of small ice particles typically produced by homogeneous nucleation are sufficient to deplete the water vapor (as confirmed by the RHi measurements) and suppress further nucleation, even in very strong updrafts.
Although large uncertainties about quantitative values of microphysical and optical parameters (ice particle concen-tration, extinction coefficient, ice water content), the com-bined in situ measurements and remote observations coher-ently describe the properties of the overshooting convective cloud. These observations address scientific issues related to the microphysical properties and structure of deep convec-tive clouds and confirm that particles smaller than 50 µm may control the radiative properties in convective-related clouds.
Appendix A
Derivation of the ice extinction coefficient and ice water content
In the present study the contributions of both the FSSP-300 and the CPI measurements have been considered for the derivation of the extinction coefficient and the ice water con-tent. The size calibration of the FSSP-300 used during pre-vious works in cirrus and contrails with the DLR Falcon air-craft was described with detail by Gayet et al. (2002). We recall that the size calibration for aspherical particles con-sider the size-bin proposed by Borrmann et al. (2000) (i.e. T-matrix method). Differences in the size response between the calibrations for aspherical and spherical ice particles are
Figure B1 Diameter (µµµµm) C o n c e n tr a ti o n ( l -1 µµµµ m -1) CPI 2D-C
a
C100 Ext IWC (l-1) (km-1) (mg/m3) CPI 1.5 0.16 8 2DC 0.8 0.13 6 0Polar Neph. Extinction (km-1)
F S S P + C P I E x ti n c ti o n ( k m -1 ) 0 10 20 30 40 40 30 20 10 y = 0.94 x σ σσ σ = 0.98
b
1 10 100 1000 Diameter (µµµµm) Diameter (µµµµm) 1 10 100 1000 Ic e W a te r C o n te n t (g /m 3µµµµ m -1) R e lf e c ti v it y (m m 6/m 3µµµµ m -1) FSSP-300 CPI FSSP-300 not represented CPI 10-1 10-2 10-4 10-3 10-5 10-6 101 10-1 10-3 10-5c
d
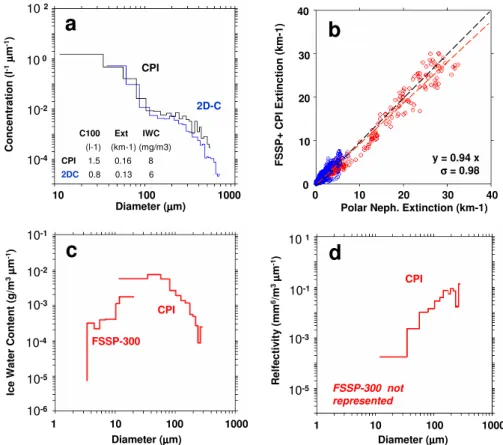
10 100 1000 102 100 10-2 10-4Fig. B1. (a): Composite representation of the size distributions measured simultaneously by the CPI and the 2-D-C probes (CIRCLE-2 16 May flight, 8:57:00–9:01:30 UT); (b): Comparison between extinction coefficients from Polar Nephelometer probe and combined FSSP-300 and CPI instruments. The red and blue dots relate the overshooting cell and the cirrus measurements, respectively. The slope parameters and correlation coefficients are reported; (c): Ice water content size distributions (overshooting cell) and (d): Reflectivity factor size distribution (overshooting cell).
little for sizes smaller than 4 µm but then significantly in-crease with size. Shcherbakov et al. (2005) refined the upper size limit of last FSSP-300 channel (21.8 µm) in order to ob-tain a good agreement with the first channel of the 2-D-C probe in terms of particle concentration, extinction and ice water content. Particles larger than 3 µm diameter have been assumed to be ice crystals with an extinction efficiency of 2
(large particle assumption) and a density of 0.9 g cm−3.
As for the CPI, the IWC derivation involves the particle mass (M). M is calculated from the mass-size relationship which depends on the particle shape:
M = αDβ (A1)
where D is particle length, and α and β are constants deter-mined by linear regression. The values for small columns of
α =0.206 and β = 2.91 (see Mitchell et al., 1990) have been
considered as the best compromise with regards to the few available relationships for small ice crystals and our obser-vations of chain-like aggregate ice crystals with dimensions ranging from 30 to 200 µm. This parameterisation gives the best (or the least worst) agreement in extinction comparisons (see Fig. B1b) and in the spectra behaviours of extinction
(see Fig. 7b) and mass (see Fig. B1c) at the overlap between the FSSP-300 and the CPI.
Appendix B
Validation of the CPI data
In this work, since the PMS 2-D-C measurements are not re-liable (see Sect. 2.2), the CPI data (with those from the PMS FSSP-300) are used to derive the particle size distributions and the microphysical parameters. The CPI calibration tech-nique has already been thoroughly described in a previous paper (Gayet et al., 2009). We recall this technique aimed to reduce uncertainties on size distributions particularly for particles smaller than about 100 µm from optical bench mea-surements which use calibrated glass beads and ice analogs (Connolly et al., 2007). As reported in Gayet et al. (2009), the calibration results were conclusively validated by com-paring the CPI size distributions to available 2-D-C data as exemplified on Fig. B1a. We note in passing that Lawson et al. (2006b) scaled the CPI particle size distribution (PSD)