HAL Id: hal-00740333
https://hal.archives-ouvertes.fr/hal-00740333
Submitted on 9 Oct 2012
HAL is a multi-disciplinary open access
archive for the deposit and dissemination of
sci-entific research documents, whether they are
pub-lished or not. The documents may come from
teaching and research institutions in France or
abroad, or from public or private research centers.
L’archive ouverte pluridisciplinaire HAL, est
destinée au dépôt et à la diffusion de documents
scientifiques de niveau recherche, publiés ou non,
émanant des établissements d’enseignement et de
recherche français ou étrangers, des laboratoires
publics ou privés.
Small ScaleTurbulence Observed Simultaneously by
Radiosondes and the MU Radar
Richard Wilson, Hubert Luce, H. Hashiguchi, Francis Dalaudier, F. Fukao, F.
Nakajo, F. Shibagaki, F. Yabuki, F. Furumoto
To cite this version:
Richard Wilson, Hubert Luce, H. Hashiguchi, Francis Dalaudier, F. Fukao, et al.. Small
ScaleTurbu-lence Observed Simultaneously by Radiosondes and the MU Radar. 9th International Symposium on
Tropospheric Profiling (ISTP), Sep 2012, L’Aquila, Italy. 3 p. �hal-00740333�
SMALL SCALE TURBULENCE AND INSTABILITIES OBSERVED SIMULTANEOUSLY
BY RADIOSONDES AND THE MU RADAR
R. Wilson1, H. Luce2, H. Hashiguchi3, F. Dalaudier4, F. Fukao5, F. Nakajo6, F. Shibagaki7, F. Yabuki8, and F. Furumoto9
1,4LATMOS-IPSL, University Pierre and Marie Curie, Paris, France 2University Sud Toulon-Var, La Garde, France
3,8,9Research Institute for Sustainable Humanosphere, Kyoto University, Uji, Japan
5,6Department of Electrical, Electronics and Computer Engineering, Fukui University of Technology, Fukui, Japan 7Osaka Electro-Communication University, Negagawa, Japan
ABSTRACT
A Japanese-French field campaign devoted to study small-scale turbulence and instabilities in the lower at-mosphere was conducted in September 2011 for three weeks at Shigaraki MU observatory (34.85N, 136.15E; Japan). The VHF MU radar was operated in range imag-ing mode [e.g. 1] for turbulence observations at high tem-poral (∼ 25 s) and high range (typically ∼ 30 m) resolu-tions. In addition, 59 balloons instrumented with RS92G Vaisala radiosondes were succesfully launched during the campaign when the radar was operated. Reference [2] showed that turbulence can be detected from raw verti-cal profiles of temperature measured from standard ra-diosoundings through the detection of overturns using the so-called Thorpe analysis [3]. In the present work, we shall present some comparison results between ra-diosonde and MU radar data.
Key words: Turbulence, Observations, ST radar, ra-diosoundings.
1. INTRODUCTION
Soon after their conceptions, ST (Stratosphere-Tropopshere) VHF radars have been used simultaneously with instrumented balloons for measuring atmospheric parameters. Intercomparisons improved our knowledge on the radar backscattering mechanisms at VHF which, in turn, provided some information on atmospheric dynamics and structures at various scales. A variety of methods was then developed for retrieving small-scale turbulence parameters from ST radars. However, the dominant sources and characteristics of the turbulent events detected by ST radars in the troposphere are still poorly documented partly due to the lack of temporal and range resolutions of these instruments (typically a few minutes and 150 m, respectively). Recently, the MU radar has been upgraded for being operated in range
imaging mode (called Frequency domain radar Inter-ferometry Imaging -FII-), allowing a range resolution of several ten meters and a time resolution of several ten seconds [1; 4]. A Japanese-French field campaign devoted to the study of turbulence and instabilities in the troposphere and the lower stratosphere with the MU radar in FII mode was conducted in September 2011 for three weeks at the Shigaraki MU observatory (Japan). Turbulent events could also be detected from temperature profiles collected from 59 RS92G radiosondes launched at the radar site by applying a Thorpe analysis to the raw data sampled at 1 Hz (corresponding to a vertical resolution of 3-6 m depending on the vertical velocity ascent of the balloons). Turbulent events are expected to produce local superadiabatic lapse rates (overturns) in the potential temperature profiles. An original and objective processing method for selecting real overturns from those produced by instrumental noise in weakly stratified regions was successfully developped [5; 2]. In addition, Brunt-Vaisala frequency and and Richardson number profiles can be estimated in the vicinity or even within the turbulent layers. The dataset collected in September 2011 helped us to characterize the turbulent events detected by the MU radar and the background atmospheric conditions in which they occurred. We shall present some results of this campaign including direct comparisons between observables collected simultaneously by radiosondes and MU radar.
2. DATASET
The 59 RS92G Vaisala radiosondes were launched every three hours mainly during night periods. The measure-ments consist of temperature, pressure, relative humid-ity (and horizontal wind) at a vertical sampling of 1 Hz (i.e. 3-5 m). Based on these observables, we computed profiles of dry and moist (saturated) adiabatic lapse rates for dry and saturated layers [6]. Potential temperature profiles were estimated by a numerical integration of the vertical profiles of lapse rates. The effect of saturation on
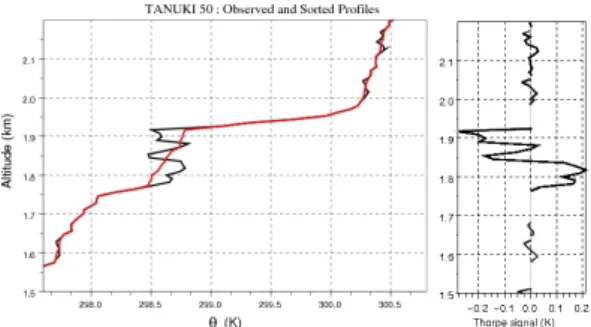
Figure 1. Exemple of detection of an overturn based on the Thorpe sorting. The red curve shows the reference (i.e. sorted) potential temperature profile, the black curve showing the observed profile.
the static stability was thus taken into account.
The MU radar is a flexible and fast beam-steering Doppler pulsed radar operating at 46.5 MHz (6.45 m radar wavelength, 3.5-MHz bandwidth and 1-MW peak output power) [7, e.g.]. The radar beamwidth is 3.6o. The FII technique consists in transmitting several closely-spaced frequencies switched pulse to pulse. The col-lected data at the various frequencies are processed us-ing the adaptive Capon processus-ing method [1]. The radar was operated with five equally spaced frequencies from 46.0 MHz to 47.0 MHz (i.e., with a frequency spacing of 0.25 MHz). Range sampling was performed from 1.32 km up to 20.37 km ASL with a step of 5 m (the initial range resolution was 150 m). The radar antenna beam was steered into three directions (one vertical and two oblique directions at 10ooff zenith toward North, East) so
that winds could be estimated and echo powers between directions could be compared. The number of coherent integrations was set equal to 32 and one profile was ac-quired every 24.5 s at a time sampling of 6.14 s.
3. BALLOON DATA PROCESSING METHOD
The Thorpe method consists in comparing the observed profile θ(z) to a reference profile θs(z), the reference
profile being obtained par sorting the θ profile. Small scale turbulence is expected to induce local overturns within the θ profile. Identification of the turbulent layers is based on the identification of these overturns by per-forming the difference between the observed and sorted profiles (Figure 1). Such a method has been used mostly in oceanic studies, and more recently in an atmospheric context [8; 9]. It was suggested by [10] to apply the Thorpe detection to standard radiosoundings. However, this method cannot be blindly applied to any radiosound-ing profile because instrumental noise effects must be carefully considered. [5, 2] proposed an objective and robust method based on both an optimal filtering and on a statistical test ensuring the rejections of artificial over-turns produced by noise. This detection method makes it possible to detect turbulent layers or patches typically deeper than ∼ 40 m in the troposphere and ∼ 15 m in the
Figure 2. Top: histogram of radar aspect ratios (see text). Bottom: histogram of radar aspect ratios measured in the altitude ranges of the layers selected from radiosondes.
lower stratosphere.
4. STATISTICAL RESULTS
For each selected turbulent layer, the time lag for which the corresponding air mass passed the nearest to the radar has been estimated. We thus constructed a composite profile of the radar echo power corresponding to the bal-loon flight. The radar aspect ratio is defined as the ratio between radar echo powers measured from the vertical beam to an off-vertical beam. An aspect ratio of unity (i.e. 0 dB) is expected for echoes backscattered from refractive index irregularities produced by isotropic tur-bulence. The top panel figure 2 shows the histogram of aspect ratios for the overall radar profiles during the bal-loon flights. The bottom panel shows the corresponding histogram obtained when selecting the altitude ranges of the turbulent layers detected from the radiosondes. In this latter case, the distribution of aspect ratios appears to be almost symmetrical with respect to 0 dB as expected for nearly isotropic turbulence. Such a result strongly sup-ports that nearly isotropic turbulence produced the radar echoes.
Another result (not shown) is a significantly high positive correlation between radar echo power and the refractive index structure constant C2
n inferred from the
tempera-ture variance within the turbulent layers independently detected by balloons. Also, the dynamics of both quanti-ties is very similar, allowing an indirect calibration of the radar. These first results appear very encouraging.
5. CONCLUSIONS
The data of the September 2011 campaign were collected during various meteorological conditions. In the present work, we focused on statistical comparisons of quantities related to the energy of small scale turbulence observed independently by both the MU radar and radiosondes. We found an overall satisfying agreement between radar
and balloon observables, giving thus strong credence in the proposed detection method. Further studies will be performed from this dataset and will aim at identifying the mechanisms of generation of turbulence in various weather conditions.
ACKNOWLEDGMENTS
The work was financially supported by RISH (Kyoto Uni-versity) and LATMOS (UPMC). The MU radar belongs to and is operated by RISH (Kyoto University).
REFERENCES
[1] Luce, H., Yamamoto, M., Fukao, S., Helal, D., and Crochet, M. (2001) A frequency domain radar inter-ferometric imaging (FII) technique based on high-resolution methods. J. Atmos. Sol. Terr. Phys., 61, 2885–2896.
[2] Wilson, R., Dalaudier, F., and Luce, H. (2011) Can one detect small-scale turbulence from standard me-teorological radiosondes?. Atmos. Meas. Tech., 4, 795–804, doi:10.5194/amt–4–795–2011.
[3] Thorpe, S. A. (1977) Turbulence and mixing in a Scottish Lock,. Philos. Trans. Roy. Soc. London, 286A, 125–181.
[4] Luce, H., Hassenpflug, G., Yamamoto, M., and Fukao, S. (2006) High-resolution vertical imaging of the troposphere and lower stratosphere using the new MU radar system. Ann. Geophys., 24, 791–804. [5] Wilson, R., Luce, H., Dalaudier, F., and Lefr`ere, J. (2010) Turbulent Patch Identification in Potential Density/Temperature Profiles. J. Atmos. Oceanic Technol.,26, 977–993.
[6] Durran, D. R. and Klemp, J. (1982) On the effects of Moisture on the Brunt-V¨ais¨al¨a Frequency. J. Atmos. Sci.,39, 2152–2158.
[7] Fukao, S., Sato, T., Tsuda, T., Yamamoto, M., Tamanaka, D., and Kato, S. (1990) MU radar: New capabilities and system calibration. Radio Sci., 25, 477–485.
[8] Luce, H., Fukao, S., Dalaudier, F., and Crochet, M. (2002) Strong mixing events observed near the tropopause with the MU radar and hight-resolution Balloon techniques. J. Atmos. Sci., 59, 2885–2896. [9] Gavrilov, N. M., Luce, H., Crochet, M., Dalaudier,
F., and Fukao, S. (2005) Turbulence parameter es-timation from high-resolution balloon temperature measurements of the MUTSI-2000 campaign. An-nales Geophysicae,23, 2401–2413.
[10] Clayson, C. A. and Kantha, L. (2008) On Turbu-lence and Mixing in the Free Atmosphere Inferred from High-Resolution Soundings. J. Atmos. Ocean. Technol.,25, 833–852.