HAL Id: inserm-00128648
https://www.hal.inserm.fr/inserm-00128648
Submitted on 6 Jun 2007
Association between socioeconomic status and adiposity
in urban Cameroon.
Leopold Fezeu, Etienne Minkoulou, Beverley Balkau, André-Pascal Kengne,
Paschal Awah, Nigel Unwin, George Alberti, Jean-Claude Mbanya
To cite this version:
Leopold Fezeu, Etienne Minkoulou, Beverley Balkau, André-Pascal Kengne, Paschal Awah, et al..
Association between socioeconomic status and adiposity in urban Cameroon.. International Journal of
Epidemiology, Oxford University Press (OUP), 2006, 35 (1), pp.105-11. �10.1093/ije/dyi214�.
�inserm-00128648�
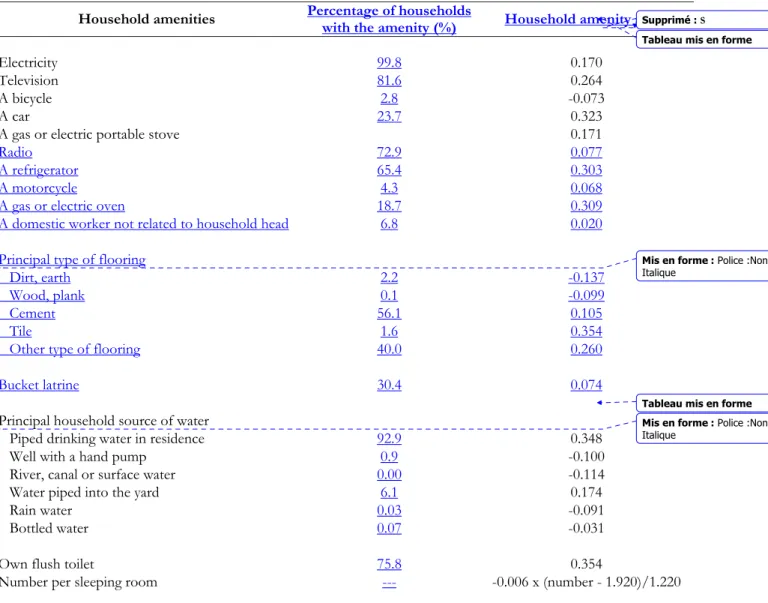
Table 1: Summary of amenities and scores used in the analyses,
and perecentage of
household with each amenities.
Cameroon Study
19Household amenities
Percentage of households
with the amenity (%)
Household amenity s
core
Electricity
99.8
0.170
Television
81.6
0.264
A bicycle
2.8
-0.073
A car
23.7
0.323
A gas or electric portable stove
0.171
Radio
72.9
0.077
A refrigerator
65.4
0.303
A motorcycle
4.3
0.068
A gas or electric oven
18.7
0.309
A domestic worker not related to household head
6.8
0.020
Principal type of flooring
Dirt, earth
2.2
-0.137
Wood, plank
0.1
-0.099
Cement
56.1
0.105
Tile
1.6
0.354
Other type of flooring
40.0
0.260
Bucket latrine
30.4
0.074
Principal household source of water
Piped drinking water in residence
92.9
0.348
Well with a hand pump
0.9
-0.100
River, canal or surface water
0.00
-0.114
Water piped into the yard
6.1
0.174
Rain water
0.03
-0.091
Bottled water
0.07
-0.031
Own flush toilet
75.8
0.354
Number per sleeping room
---
-0.006 x (number - 1.920)/1.220
Tableau mis en forme
Mis en forme : Police :Non Italique
Tableau mis en forme Mis en forme : Police :Non Italique
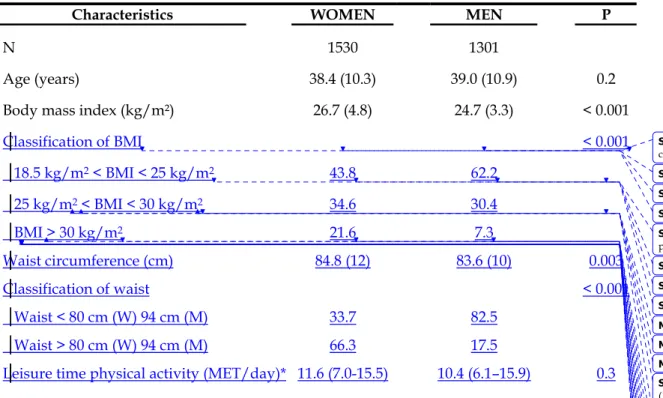
Table 2
a
:
Clinical
characteristics of the study population by sex in urban Cameroonians
aged 25 years and above:
Characteristics
WOMEN
MEN
P
N
1530
1301
Age (years)
38.4 (10.3)
39.0 (10.9)
0.2
Body mass index (kg/m²)
26.7 (4.8)
24.7 (3.3)
< 0.001
Classification of BMI
< 0.001
18.5 kg/m
2< BMI < 25 kg/m
243.8
62.2
25 kg/m
2< BMI < 30 kg/m
234.6
30.4
BMI > 30 kg/m
221.6
7.3
Waist circumference (cm)
84.8 (12)
83.6 (10)
0.003
Classification of waist
< 0.001
Waist < 80 cm (W) 94 cm (M)
33.7
82.5
Waist > 80 cm (W) 94 cm (M)
66.3
17.5
Leisure time physical activity (MET/day)* 11.6 (7.0-15.5)
10.4 (6.1–15.9)
0.3
Data are mean (SD), median* (25
th- 75
thpercentile) or percentages.
Mis en forme : Exposant Mis en forme : Soulignement Mis en forme : Exposant
Mis en forme : Soulignement Supprimé : Socio-demographic and anthropometric Supprimé : Waist circumference (cm) Supprimé : 84.8 (12) Supprimé : 83.6 (10) Supprimé : 0.003 Supprimé : Leisure time physical activity (MET/day)* Supprimé : 11.6 (7.0-15.5) Supprimé : 10.4 (6.1–15.9) Supprimé : 0.3
Supprimé : Occupational level (%) Supprimé : < 0.001 Supprimé : Low Supprimé : 37 Supprimé : 29 Supprimé : High Supprimé : None Supprimé : Primary Supprimé : 23 Supprimé : 19 ... [2] ... [3] ... [1]
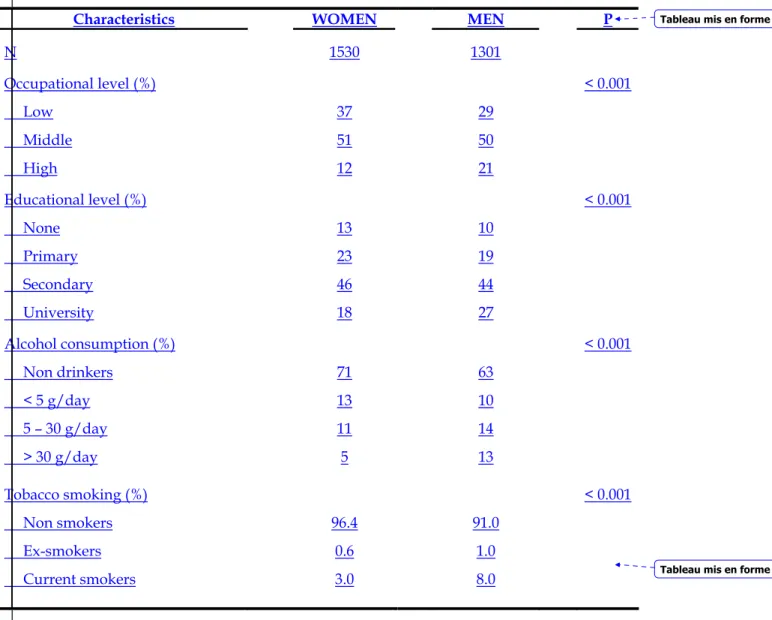
Table 2b: Socio-demographic characteristics of the study population by sex in urban
Cameroonians aged 25 years and above:
Characteristics
WOMEN
MEN
P
N
1530
1301
Occupational level (%)
< 0.001
Low
37
29
Middle
51
50
High
12
21
Educational level (%)
< 0.001
None
13
10
Primary
23
19
Secondary
46
44
University
18
27
Alcohol consumption (%)
< 0.001
Non drinkers
71
63
< 5 g/day
13
10
5 – 30 g/day
11
14
> 30 g/day
5
13
Tobacco smoking (%)
< 0.001
Non smokers
96.4
91.0
Ex-smokers
0.6
1.0
Current smokers
3.0
8.0
Data are percentages.
Tableau mis en forme
22
Table 3: Odds ratios (95% confidence intervals) between overweight, obesity and abdominal obesity an
factors by sex in urban Cameroonians aged 25 years and above:
Women Men
Dependent variables
Overweight + Obesity Obesity Abdominal obesity Overweight + Obesity Obesity
Age classes in years
25-34 1 1 1 1 1
35-44 2.0 (1.5 – 2.5) 3.5 (2.5 – 4.9) 2.5 (1.9 - 3.2) 3.1 (2.3 – 4.2) 5.1 (2.6 – 10
45-54 2.7 (2.0 – 3.8) 5.9 (4.0 – 8.8) 3.2 (2.2 – 4.5) 4.5 (3.3 – 6.1) 12.0(6.3 - 22
55 + 1.7 (1.1 – 2.6) 3.2 (1.8 – 5.4) 3.7 (2.2 – 6.2) 2.7 (1.8 – 4.1) 5.4 (2.4 – 12
P* < 0.001 < 0.001 < 0.001 < 0.001 < 0.001
Quartiles of leisure time physical activities
1sst quartile 1 1 1 1 1 2nd quartile 1.13 (0.84–1.50) 1.4 (1.0 – 2.1) 0.7 (0.5 – 0.9) 1.3 (0.9 – 1.8) 1.4 (0.8 – 2 3rd quartile 1.10 (0.83–1.48) 1.31(0.89–1.93) 0.9 (0.6 – 1.2) 0.9 (0.6 – 1.2) 0.9 (0.5 – 1 4th quartile 1.11 (0.84–1.50) 1.32 (0.90–1.94) 0.7 (0.5 – 0.9) 0.7 (0.5 – 0.9) 0.5 (0.2 – 0 P* 0.8 0.3 0.04 0.003 0.01 Tobacco smoking Non-smokers 1 1 1 1 1 Smokers 0.6 (0.3 – 1.1) 1.4 (1.0 – 1.9) 0.8 (0.4 – 1.5) 0.7 (0.5 – 1.3) 1.0 (0.6 – 1 P* 0.08 0.03 0.5 0.2 1.0 Alcohol consumption Non-drinker 1 1 1 1 1 < 5g/day 1.7 (1.2 – 2.4) 1.7 (1.2 – 2.6) 1.1 (0.8 – 1.5) 0.8 (0.5 – 1.2) 0.8 (0.4 – 1 5 – 30 g/day 1.3 (0.9 – 1.8) 1.3 (0.8 – 2.0) 1.3 (0.9 – 1.9) 1.1 (0.8 – 1.6) 0.9 (0.5 – 1 > 30 g/day 0.8 (0.4 – 1.3) 1.1 (0.6 – 1.9) 1.2 (0.7 – 1.8) 1.4 (1.0 – 1.9) 1.3 (0.7 – 2 P* 0.006 0.06 0.5 0.1 0.6 * p for difference.
23
Table 4: Adjusted# odds ratios (95 % CI) associated with markers of adiposity and studied socio-econo
in urban Cameroonians aged 25 years and above:
Women
Socio-economic
variables n Overweight
+ Obesity Obesity Abdominal obesity n Overweight + Obesity O
Household amenities quartiles
First (poorest) 379 1 1 1 330 1 Second 382 1.5 (1.1 – 2.0) 1.9 (1.2 – 2.8) 1.2 (0.9 – 1.7) 320 1.7 (1.2 – 2.4) 1.5 ( Third 387 1.5 (1.1 – 2.0) 2.0 (1.3 – 3.0) 1.3 (1.0 – 1.8) 327 1.6 (1.1 – 2.3) 2.1 ( Fourth (richest) 382 1.5 (1.1 – 2.0) 1.8 (1.2 – 2.8) 1.7 (1.2 – 2.4) 324 2.3 (1.6 – 3.2) 2.4 ( P* 0.03 0.005 0.03 < 0.001 Occupational level Low 572 1 1 1 376 1 Middle 769 1.1 (0.9 – 1.4) 1.1 (0.8 – 1.5) 1.0 (0.8 – 1.3) 644 1.2 (0.9 – 1.5) 2.1 High 189 0.8 (0.6 – 1.2) 0.9 (0.5 – 1.4) 0.9 (0.6 – 1.3) 281 1.6 (1.2 – 2.3) 3.8 P* 0.2 0.5 0.7 0.02
Reference category is normal weight for overweight and obesity, waist < 80 cm (women) and < 94 cm ( obesity.
#Odds ratios are adjusted for age classes, leisure time physical activity quartiles, classes of alcohol cons
classes of tobacco smoking. * p for difference.
Page 21: [1] Supprimé Kamadjeu 11/06/2004 11:08
Middle
51
50
Page 21: [2] Supprimé Kamadjeu 11/06/2004 10:55
High
12
21
Educational level (%)
< 0.001
Page 21: [3] Supprimé Kamadjeu 11/06/2004 10:55
None
13
10
Page 21: [4] Supprimé Kamadjeu 11/06/2004 10:55