HAL Id: insu-01986113
https://hal-insu.archives-ouvertes.fr/insu-01986113
Submitted on 27 Feb 2019
HAL is a multi-disciplinary open access
archive for the deposit and dissemination of
sci-entific research documents, whether they are
pub-lished or not. The documents may come from
teaching and research institutions in France or
abroad, or from public or private research centers.
L’archive ouverte pluridisciplinaire HAL, est
destinée au dépôt et à la diffusion de documents
scientifiques de niveau recherche, publiés ou non,
émanant des établissements d’enseignement et de
recherche français ou étrangers, des laboratoires
publics ou privés.
thermodynamics model
Benoit Bevillard, Guillaume Richard, Hugues Raimbourg
To cite this version:
Benoit Bevillard, Guillaume Richard, Hugues Raimbourg.
Rock strength and texture evolution
during deformation in the Earth’s ductile lithosphere: a two-phase thermodynamics model.
Geo-chemistry, Geophysics, Geosystems, AGU and the Geochemical Society, 2019, 20 (2), pp.1095-1137.
�10.1029/2018GC007881�. �insu-01986113�
Thermodynamics Model
Benoit Bevillard1 , Guillaume Richard1 , and Hugues Raimbourg1
1Institut des Sciences de la Terre d'Orléans, UMR 7327 CNRS/Université d'Orléans 1A rue de la Férollerie, Orléans Cedex 2, France
Abstract
Building upon the two-phase and grain damage theory, we propose a new formulation allowing to track the evolution of phase mixing/segregation during ductile deformation of a two-phased aggregate. Our model is based on a set of variables characterizing a rock texture: the mean grain sizes and the phase proportion. During ductile deformation, activation of different micromechanical processes impacts the aggregate texture. Dislocation and diffusion creep are the two main deformation processes considered. We only account for the effect of Zener pinning in slowing down grain growth and allow for active grain-size reduction mechanisms in the diffusion creep domain. For this purpose, an equation is proposed to track the phase mixing evolution during ductile deformation. Numerical application using anorthite rheology shows that any grain reduction mechanisms that could be active in the diffusion creep regime requires a very high partition fraction in order to reach the grain size predicted by the feldspar piezometer. Application of this model to gabbroic composition, relevant for the ductile crust, demonstrates that the strong coupling between phases grain sizes and interface evolution results in steady-state grain sizes far below the field boundary. This effect is coeval with an important increase of mixing between the two phases. In addition, accounting for the phase mixing results in a drop of the global aggregate stress during deformation. This model allows for further comparison of mylonitized textures evolution with natural shear zones at the local and regional scales.Plain Language Summary
In the Earth lower crust, the rocks deform by slow creep instead of breaking due to high temperature and pressure. Observations of natural material deformed in such conditions show that deformation concentrates on narrow-banded structures. At small scales (1 cm to 1𝜇m), these shear bands generally present a very fine mean crystal size and a very good mixing of the minerals. These features are characteristic of deformed rocks, but their origins and consequences on geological structures at larger scales (1 m to 100 km) are yet to be fully understood. In this study we propose a physical model (a mathematical representation of reality) that allows to represent a rock consisting of two minerals, their mean crystal sizes and proportions and the quality of their mixing. This is based on parameters constrained experimentally for each pure mineral. Using this model, we are able to track the evolution of these rocks microscopical characteristic and their consequences on the rock strength during deformation. Eventually, the results allow us to refine our understanding of the implied processes by comparing the computed variables to measures performed on rock samples. The physical equations proposed could then be used to model the rock strength in geodynamical models at larger scales.1. Introduction
Since the development of the theory of plate tectonics, the lithosphere is described as the upper bound-ary layer of mantle convection. Within this layer, the stress field induced by the motion of convective asthenosphere is mainly accommodated by deformation at plate boundaries. Within the Earth crust, this deformation appears heterogeneously distributed. This is evidenced by large-scale geological structures such as mountain ranges, rifts, oceanic margins, strike-slip faults, or subduction trenches which exhibit intense deformation and bound regions of much weaker strain. While the uppermost part of the crust exhibits brit-tle deformation, the lower crust and lithospheric manbrit-tle are considered to accommodate tectonic stresses through plastic deformation and creep flow (Kohlstedt et al., 1995; Wilks & Carter, 1990). The rheology of Key Points:
• The presented model adresses the evolution of mylonite texture during ductile deformation
• This model tracks the role of creep mechanisms on the mixing state evolution of the aggregate
• An effective viscosity that depends on the mixing degree of the two-phase increases stress weakening
Correspondence to: B. Bevillard,
benoit.bevillard@cnrs-orleans.fr
Citation:
Bevillard, B., Richard, G., & Raimbourg, H. (2019). Rock strength and texture evolution during deformation in the Earth's ductile lithosphere: A two-phase
thermodynamics model. Geochemistry, Geophysics, Geosystems, 20.
https://doi.org/10.1029/2018GC007881
Received 16 AUG 2018 Accepted 10 JAN 2019
Accepted article online 16 JAN 2019
©2019. American Geophysical Union. All Rights Reserved.
such materials is classically approximated by viscous flow with an effective viscosity depending on the inten-sive parameters and/or the properties of the material (Kohlstedt, 2007; Nabarro, 1967; Weertman, 1957). Numerous control factors play a role in the rheology of lithospheric rocks.
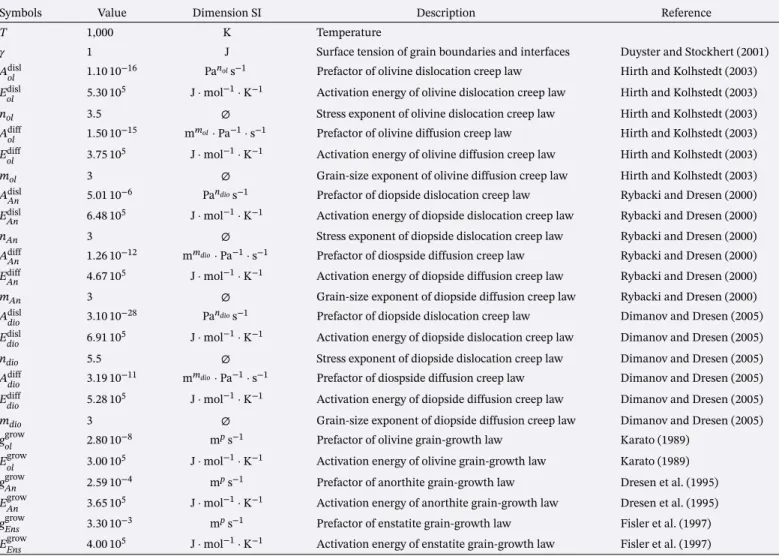
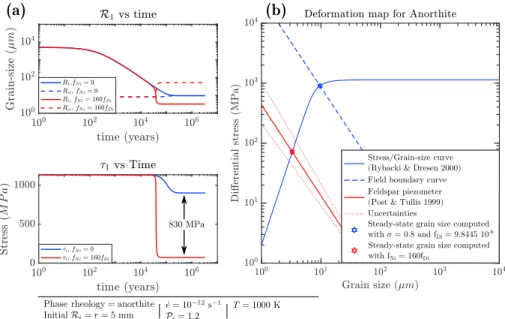
Deformation experiments (Hirth & Kolhstedt, 2003; Karato et al., 1986) on olivine aggregates described its rheology as a combination of power-law and Newtonian behavior. In the case of lower crust materials, simi-lar experiments involving plagioclase yielded simisimi-lar conclusions (Rybacki & Dresen, 2000, 2004; Tullis et al., 1991). The power-law rheology generally corresponds to dislocation (grain size insensitive) creep where the material undergoes dynamic recrystallization and grain-size reduction. On the other hand, at lower strain rate or higher temperature, the deformation is dominated by diffusion (grain size sensitive) creep, and the material displays a Newtonian behavior. These studies provided empirical flow laws which remain an essential tool in order to understand the ductile behavior of the rocks composing the lithosphere. Figure E1 displays a stress/grain-size deformation map for anorthite (Rybacki & Dresen, 2000), illustrating the rheol-ogy resulting from a combination of these two mechanisms. These rheological laws yield an Arrhenius-type dependence on the temperature which has been demonstrated to control the effective viscosity of rock at large scale (Kameyama et al., 1997; Kaus & Podladchikov, 2006; Leloup et al., 1999; Schubert & Yuen, 1978). Field studies on ductilely deformed rocks widely support the characteristic grain size as a crucial parameter controlling effective viscosity, especially at scales at which the thermal diffusion would prevent significant viscous drop due to temperature. Indeed, natural shear zones or shear bands from the scale of a few centime-ters to regional scale commonly exhibit very high and localized grain-size reduction (Carreras, 2001; Fossen & Cavalcante, 2017; Pennachioni & Mancktelow, 2007). This characteristic defines the mylonitic fabric. The dependence of grain size on the driving stress promoted the use of grain-size measurements as piezometers in natural mylonites (Stipp & Tullis, 2003; Twiss, 1977).
Grain-size reduction usually results from dislocation creep through dynamic recrystallization (Derby, 1991; Derby & Ashby, 1987; Drury & Urai, 1990; Shimizu, 1998, 2008; Twiss, 1977). On the other hand, Newto-nian creep is highly dependent on the grain size because of diffusion processes (Herring, 1950; Nabarro, 1967), but in the absence of a grain reduction mechanism, it results in grain growth. It has been proposed that the coupling between dynamic recrystallization and grain-size sensitive creep can explain plastic weak-ening at small scales (Drury et al., 1991; Poirier, 1980; Van der Wal et al., 1993). Dislocation creep allows the mean grain size to decrease deep into the diffusion creep domain thus producing stress weakening. Figure E1 green arrow (1) illustrates such an evolution toward the Post and Tullis (1999) piezometer (red line) in the case of a feldspar aggregate. However, Austin and Evans (2007) and Ricard and Bercovici (2009) proposed that the steady-state grain size depends on the rate of deformational work instead of the stress alone, regarding the steady-state grain size as a paleo-wattmeter instead of a paleo-piezometer. Furthermore, De Bresser et al. (2000) emphasized that such an interaction between dislocation and diffusion creep results in a grain-size equilibrium at the transition between the two mechanisms and prevents any significant weak-ening as schematized in Figure E1 green arrow (2). Therefore, explaining both the observed grain sizes and the formation of shear bands imposes a grain-size reduction mechanism occurring below the grain size insensitive/grain size sensitive transition grain size (Bercovici & Ricard, 2012; Platt, 2015; Rutter & Brodie, 1988).
The nature of this mechanism and its potential control factors remains an important question. The complete grain-size distribution and not only a characteristic grain size (Czaplinska et al., 2015; Herwegh et al., 2005; Karato, 1984; Rozel et al., 2011; Ter Heege et al., 2004) and the presence of secondary phases, a common characteristic of very fine grained shear zones (Herwegh et al., 2011; Hiraga et al., 2010; Linckens et al., 2015; Platt, 2015) have been proposed to play a role in the transition between grain-size insensitive (dislocation) to grain-size sensitive (diffusion) creep. Bercovici and Ricard (2012) proposed that grain splitting because of pinning by a second phase could reduce grain size in the diffusion creep regime. More recently, Precigout and Stunitz (2016) documented a possible grain nucleation mechanism triggered by grain boundary sliding in diffusion creep domain. This mechanism is likely to produce important grain-size reduction. High strain experiments of Cross and Skemer (2017) also produce well-mixed mylonitized textures.
The numerous studies on secondary phases, pinning, and phase mixing advocate for models with a more complete description of deforming aggregates, taking into account grain-size distributions, secondary phases, and the mixing state between them, that could be efficiently compared to field and experimental
observations. A two-phase theory was proposed by Bercovici and Ricard (2012) using a continuum descrip-tion of the system and involving the mean curvature of the interface as a measure of the phases mixing. This theory encompasses the effect of pinning and provides an easily scalable framework to compare numerical models of texture evolution to statistical measures on natural samples.
Our main objective is to propose a model allowing to compare numerical application with natural shear zones. The two-phase damage theory (Bercovici & Ricard, 2012) was developed specifically for large-scale purposes such as plate tectonics generation and persistence (Bercovici & Ricard, 2013). In this study, we adapt it by using the smaller-scale model to compute a texture-dependent viscosity that could be imple-mented in a geodynamical model and compared to field observations at both the textural and local/regional scales. We choose to account for the interdependence between interface density and the phases mean grain sizes in the entropy production equation. A modification of the equations for grain size and interface mean curvature evolution is proposed, in order to limit the effect of Zener pinning to grain growth. To account for the possible effect on the material viscosity of grain-size reduction mechanisms potentially active in the diffusion creep domain (Bercovici & Ricard, 2012; Menegon et al., 2015; Precigout & Stunitz, 2016; Tasaka et al., 2017), we introduce another generic deformation partition coefficient. Furthermore, we propose an equation for the effective viscosity of the material that not only depend on the effective viscosity of the two phase but also on their mixing state. For two phases A and B, this mixing state is measured from the rel-ative quantity of AB and AA, BB grain-boundaries densities (Heilbronner & Barrett, 2014). Eventually, we modify the scale numbers proposed in Bercovici and Ricard (2012) in order to account for different min-eral rheologies. The variables used are specifically designed to be measurable on natural samples in order to provide useful constraints from both natural and experimental data. We finally present simple numerical applications, to display and discuss the general behavior of the equations.
2. Continuum Description of Grained Rocks
2.1. Grains Properties and Size Distributions
Following the formalism described in Bercovici and Ricard (2012, appendix A), within a control volume𝛿V, all the macroscopic variables and their derivatives are considered continuous. In the following description, all variables accented as ̆Xare related to one grain of specific size ̆R, variables accented ̃Xare related to interfaces, and variables indexed Xiare phase dependent (i = 1or2, see Appendix E and Table E3). We
consider two immiscible phases represented by a function𝜑isuch that𝜑i = 1where only the phase i is
present and 0 where not. Therefore, the volume of phase i in𝛿V is 𝛿Vi= ∫
𝛿V𝜑idV =𝜙i𝛿V, (1)
and𝜙isatisfy
∑2
i=1𝜙i=1. Any variables summed over the two phases is written X = ∑
i𝜙iXi. The volume
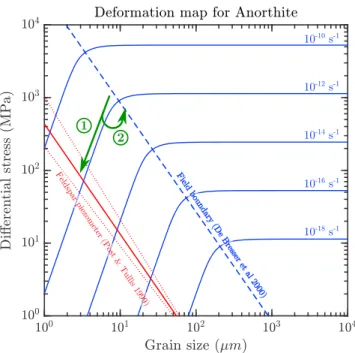
and surface area of one grain of phase i are written as the following: ̆Vi= 4 3𝜋 ̆R 3 i, (2) ̆ i= ̆AĭPi=4𝜋 ̆R2ĭPi, (3)
which defines the grain-size variable ̆Riand the grain “roughness” or “shape factor” ̆Pi. The grain-size vari-able ̆Ricorresponds to the radius of the sphere with a volume equivalent to the grain as schematized by Figure E3a. The grain roughness ̆Piaccounts for the amount of area in excess from the minimum area com-patible with the grain volume (the area of a sphere of radius ̆Ri). All grains of a size ̆Rishare an identical roughness ̆Pi. This is also illustrated in Figure E3a. Therefore, the grain volume and associated quantities only involve the variable ̆Ri, while grain surface depends on both ̆Riand ̆Pi. The mean curvature of one grain reads ̆Ki= d ̆i d ̆Vi =2 ̆Pi ̆Ri. (4)
Each phase within a control volume is described by a continuous and convergent distribution𝜈iof grain size
grain size and the variableithe mean grain roughness of the phase i grain population (Appendix B). The volume of phase i reads (see; Bercovici & Ricard, 2012, appendix B, equation B.3)
𝛿Vi= ( ∫ ∞ 0 ̆Vi𝜈id,R ) 𝜙i𝛿V, (5)
which because of equation (1) yields
∫ ∞ 0
̆V𝜈idR = 1, (6)
implying that there is no void of any kind between the grains. The two phases being considered incompress-ible, we will write all mass-dependent quantities as volume dependent. The general equations concerning grain-size distributions are displayed in Appendix B.
2.2. Interface Density and Mean Radius of Curvature
Accounting for the effect of phase mixing on the rheology of two mineral phases materials such as the one displayed in Figure E3b is one of our objectives. The interface area is defined as the sum of all the surfaces separating a grain of phase A from a grain of the phase B in a given volume as illustrated by the red lines in Figure E3b. On the other hand, the intraphase boundary area is defined as the sum of all the surfaces separating two grains of the same phase (green and olive green lines in Figure E3). The amount of mixing between the two phases is related to the relative quantity of interfacial area (AB) with respect to intraphase grain boundaries AA or BB (Heilbronner & Barrett, 2014, chapter 18). The grain boundary area defines the sum for one phase of the interface and intraphase boundary area. The total interface area𝛿AIin the control
volume𝛿V is written (Bercovici & Ricard, 2012, appendix A, equation A.3) 𝛿AI= ∫
𝛿V𝛼dV, (7)
which defines the interface density𝛼 as the total interface area normalized by the considered volume. A grain-boundary density𝛼iis similarly defined and corresponds to the sum of interface and intraphase grain boundary area for all the phase i grains:
𝛼i= ∫
∞ 0
i𝜈idR. (8)
The phase grain boundary area density is𝜙i𝛼i, and the total grain boundary surface of phase i yields
𝛿Ai= ∫
𝛿V𝜙i𝛼idV. (9)
The interface density should be a function of the phase volume fraction𝜙i, the phase mean grain sizesi,
and mean roughnessi. Furthermore,𝛼 must vanish if either 𝜙1or𝜙2 = 0which advocate for𝛼 = 𝑓
( 𝜙1𝜙2) (Bercovici et al., 2001; Bercovici & Ricard, 2012). If the interface density has to be a function of the phases proportions and grain-size distributions, another independent variable is required in order to describe the mixing state of the phase. On the basis of the work done by Ganesan and Poirier (1990), Bercovici et al. (2001), and Bercovici and Ricard (2005), Bercovici and Ricard (2012) propose the general formula:
𝛼 = 3𝜙1𝜙2 = 3𝜙1𝜙2r , (10)
thus introducing the interface mean radius of curvature r as an independent variable measuring the interface coarseness (inverse of interface fineness). However, in the following development, we will consider the interface density as a function of not only phases volumic fractions𝜙iand interface mean radius of curvature rbut also of the mean grain sizesi, that is,𝛼 = 𝑓(𝜙i, r, i).
3. Thermodynamics of Coupled Two-Phase Deformation
3.1. Damage, Self-Similarity, and Entropy Production
Grain “damage” is related to the processes affecting grains evolution during deformation (Ricard & Bercovici, 2009). The damage theory is generally based on the proposition that the internal energy E of a
given system depends on its entropy S and density𝜌 but also on a third state variable related to damage, that is, E =𝑓(S, 𝜌, ). However, if𝜌 and S are clearly conjugated to the pressure P and the temperature T, the conjugate variable of is only defined by the partial derivative of the internal energy with respect to . The approach proposed by Bercovici et al. (2001) considers the damage variable as the quantity of interfa-cial surface energy present in the system. Thus, the internal energy is now written as E =𝑓 (S, 𝜌, 𝛼) where 𝛼 is the interfacial area density. The conjugate variable of𝛼 becomes ̃𝛾Ithe interfacial surface tension. There-fore, grain damage results in storage of deformation energy as surface tension energy through the creation of grain boundary area. Even if mylonitized rocks exhibit a strong anisotropic fabric, we follow Bercovici and Ricard (2012) and assume a scalar𝛼 (grains properties are isotropic). As they demonstrated, mass con-servation implies to split the grain-size fluxes in the grain-size space into continuous (grains vanishing or growing) and discontinuous fluxes (grains breaking or fusing, see Appendix A for further details).
Furthermore, Rozel et al. (2011) consider that the grain-size distribution remains self-similar through-out deformation (all distribution moments are only function of the mean). The self-similar grain-size distribution function𝜈ireads
𝜈i=B
( i
)
H (u). (11)
The function B is an amplitude depending only oni, H is the shape function of the distribution which
depends on the self-similarity variable u = ̆R∕i. Rozel et al. (2011) comes up with an equation for grain-size
evolution where the continuous fluxes of grain size are related to grain coarsening and the discontinuous fluxes corresponds to grain damage:
di dt =C ( i ) −D(i ) , (12)
where C(i)and D(i), respectively, represent the continuous and discontinuous fluxes of mean grain sizesi(see section B2 and equation (B11)). The two phases grain-size distributions are assumed to be log-normal (Rozel et al., 2011), which allows to compute the various integrands related to grain-size distri-bution. From these leading hypothesis, it becomes possible to write the entropy production within a control volume under deformation (section C2) and to use it in order to derive phenomenological evolution laws for mean grain sizes and interface density. The main difference with the previous model at this stage is that we consider the interface density alpha to depend not only on phase volumic fractions𝜙iand interface mean
curvature r but also on the phases mean grain sizei. As a consequence, we cannot assume the mean grain
size and interface density to satisfy entropy positivity independently. However, using Onsager's phenomeno-logical relations requires each thermodynamical flux to be independent from the other. We therefore rewrite the interface density𝛼 as the sum of all its partial derivative with respect to the grain size i, the phase volu-mic fraction𝜙i, and the interface mean radius of curvature r. Assuming that the grain-size distribution of each phase remain self-similar, assuming that these grain-size distributions are log-normal and neglecting heat production and transfer terms, because the thermal diffusion overcomes the heat produced by viscous dissipation (high Brinkmann number) at the scales of interest,
yields the equation for the production of entropy (see section C2 and equation (C20)):
Σ =∑ i [ 3𝜆2𝜙i𝛾ii 𝜆32 i −𝛾I 𝜕𝛼 𝜕i ] di dt −𝛾I 𝜕𝛼 𝜕r𝜕r𝜕t− ( 𝛾I𝜕𝜙1𝜕𝛼 + ΔΠ ) ̃D𝜙1 ̃Dt +𝜓∗⩾ 0. (13)
The first term corresponds to the processes related to grain-size evolution and encompasses the inter-face variation due to grain size (−𝛾I𝜕𝛼∕𝜕iterm). The second term corresponds to processes that modify
interface density independently of grain size (for instance, phase mixing at constant mean grain sizes). The third term is relative to phase volumic fraction, ΔΠ being the effective pressure difference defined as ΔΠ = Π2 − Π1and Πi = Pi+𝛾ii(see sections C1 and C2, the mean grain curvatureiis defined by
equation (4)). The intraphase boundary surface tension energy is𝛾i, while the true interfacial energy is ̃𝛾i.
However, in the following development, the surface tension energy related to interface area corresponds to an effective surface tension energy𝛾I = ̃𝛾I−
∑
i𝛾i(Bercovici & Ricard, 2012, appendix E.1, equation E.1). The
log-normal shape of the grain size allows to compute the grain-size distribution nth moment (section B2): 𝜆n= ∫
∞ 0
where again u is the self-similarity variable (see equation (11)), and𝜎 is the dimensionless variance. An important quantity is the grain boundaries density𝛼ithat is computed from the equations (8) and (11) for self-similar log-normal distribution (see section B1 and equation (B6) for the form of𝜈i):
𝛼i= ∫ ∞ 0 i𝜈idR = 3𝜆2i 𝜆3i . (15)
Similarly, from equation (4), the mean grain boundaries curvatureireads i= ∫ ∞ 0 ̆Ki𝜈idR = 2𝜆2i 𝜆3i . (16) 3.2. Nonequilibrium Thermodynamics
In order to use the equation (13) to derive evolution equations foriand r, we consider that there are only linear and homogeneous (phenomenological) kinetic relations between thermodynamical fluxes J and dissipative forces X. Under this hypothesis, the entropy production equation is written as a scalar product of thermodynamical fluxes and dissipation forces yielding:
Σ = 4 ∑
k=1
JkXk+𝜓∗⩾ 0. (17)
According to Onsager (1931), satisfying the positivity of entropy production requires to write the thermody-namical fluxes J as
Jk=
∑
l
KklXl, (18)
where K is a positive definite square matrix. Therefore, the entropy production reads
Σ =∑
k,l
XkKklXl⩾ 0. (19)
The positive definiteness of K is sufficient to ensure the positiveness of Σ. The Onsager's reciprocal relations also imply that K is symmetrical. The thermodynamical fluxes are generally defined as the whole material derivative ̇Y of the state variables Y (Fischer et al., 2014), which reads
Y = ⎛ ⎜ ⎜ ⎜ ⎜ ⎝ 1 2 r 𝜙1 ⎞ ⎟ ⎟ ⎟ ⎟ ⎠ ̇Y = ⎛ ⎜ ⎜ ⎜ ⎜ ⎝ ̇1 ̇2 ̇r ̇𝜙1 ⎞ ⎟ ⎟ ⎟ ⎟ ⎠ . (20)
The effective deformational work rate,𝜓∗, is defined as the tensorial product of the strain-rate tensoṙe with the effective stress tensor𝜏∗, that is,
𝜓∗=𝜏∗∶ ̇e (21)
(see section 3.5.3 and equation (122)). It is generally considered that the strain-rate tensor corresponds to the thermodynamical flux associated to a dissipative force that is the stress tensor (De Groot & Mazur, 1984). When writing the Onsager's matrix, this results in a rheological equation relating the strain-rate tensor to a linear function of all the dissipative forces including the stress tensor. However, in the case of deforming mineral aggregates, the rheologies are nonlinear (see sections 3.5.3 and D2). Furthermore, assuming the strain rate as the thermodynamical flux induces two other questions. First, fluxes and forces that are not of the same tensorial order should be decoupled (De Groot & Mazur, 1984). As the considered medium is assumed isotropic (mean grain sizes are scalars), this implies that the mean grain-sizes evolution equations should be decoupled from stress. Second, Austin and Evans (2007) and Ricard and Bercovici (2009) show that mean grain sizes depend on deformational work rate rather than stress alone. Keeping with this result and the phenomenological hypothesis implies that the dissipative force in that case has to be the deforma-tional work which in turn implies the conjugated thermodynamical flux to be 1 so that the thermodynamical fluxes are written as linear functions of the deformational work rate. We acknowledge the exotic char-acter of this choice but will demonstrate that this assumption allows to recover the general forms of the
equations proposed by Bercovici and Ricard (2012) and Rozel et al. (2011). Therefore, we choose to define the thermodynamical fluxes J and dissipative forces X as follows:
Jk= ̇Yk for k =1, … , 4, (22)
J5=1, (23)
Xk=𝑓k for k =1, … , 4, (24)
X5=𝜓∗. (25)
Taking into account equations (13) and (26), the forces are thus given by
f = ⎛ ⎜ ⎜ ⎜ ⎜ ⎜ ⎜ ⎜ ⎜ ⎝ (3𝜆 2𝜙1𝛾11 𝜆32 1 −𝛾I 𝜕𝛼 𝜕1 ) ( 3𝜆2𝜙2𝛾22 𝜆32 2 −𝛾I 𝜕𝛼 𝜕2 ) −𝛾I𝜕𝛼 𝜕r − ( 𝛾I𝜕𝜙𝜕𝛼1+ ΔΠ ) 𝜓∗ ⎞ ⎟ ⎟ ⎟ ⎟ ⎟ ⎟ ⎟ ⎟ ⎠ . (26)
This yields the entropy production equation: Σ( ̇Y, Y)=
4 ∑
k=1
𝑓k̇Yk+𝜓∗⩾ 0. (27)
The Onsager's reciprocal relations imply Kkl = Klk, yielding the corresponding system of phenomenological relations: ̇1=K11𝑓1+K12𝑓2+K13𝑓3+K14𝑓4+K15𝜓∗, (28) ̇2=K12𝑓1+K22𝑓2+K23𝑓3+K24𝑓4+K25𝜓∗, (29) ̇r = K13𝑓1+K23𝑓2+K33𝑓3+K34𝑓4+K35𝜓∗, (30) ̇𝜙1=K14𝑓1+K24𝑓2+K34𝑓3+K44𝑓4+K45𝜓∗, (31) 1 = K15𝑓1+K25𝑓2+K35𝑓3+K45𝑓4+K55𝜓∗, (32) where we should have Kkk⩾ 0 and KkkKll⩾ 14
( Kkl+Klk
)2
for K to be positive definite.
3.3. Phases Proportions
As we neither consider phase transition nor any mass transfer between the two phases, and we assume equivalent velocities between the two phases (see section 3.2), we prescribe ̃D𝜙i∕ ̃Dt =0in a given control
volume. Furthermore, we consider all the equations (28)–(30), and (32) to be decoupled from ̇𝜙1(31) which imposes Kk4 = 0. The phases volumic fractions𝜙iwill be considered as constant parameters. The system
thus reduces to ̇1=K11𝑓1+K12𝑓2+K13𝑓3+K15𝜓∗, (33) ̇2=K12𝑓1+K22𝑓2+K23𝑓3+K25𝜓∗, (34) ̇r = K13𝑓1+K23𝑓2+K33𝑓3+K35𝜓∗, (35) ̇𝜙1=0, (36) 1 = K15𝑓1+K25𝑓2+K35𝑓3+K55𝜓∗. (37)
To achieve the ̇𝜙1=0condition, either K44or f4or both has to be 0. The condition
𝑓4=0, (38)
taking into account the expression of the dissipation force𝔣4(equation (26)) yields −𝛾I 𝜕𝛼
𝜕𝜙1 = ΔΠ. (39)
According to Bercovici and Ricard (2012), the pressure difference term reads ΔΠ = Π2− Π1where Πiis an effective pressure taking into account the effect of surface tension, that is, Πi=Pi+𝛾ii(see Appendix C).
Equation (39) describes the equilibrium between the variation of surface tension on the interface and the pressure difference on both side of the interface. It is equivalent to Bercovici and Ricard (2012, appendix E, equation E.23a) and corresponds to the Laplace quasi-static equilibrium across the interface.
3.4. Grain-Size Evolution Equation Without Deformation
The system now reads
̇
1=K11𝑓1+K12𝑓2+K13𝑓3+K15𝜓∗, (40)
̇2=K12𝑓1+K22𝑓2+K23𝑓3+K25𝜓∗, (41)
̇r = K13𝑓1+K23𝑓2+K33𝑓3+K35𝜓∗, (42)
1 = K15𝑓1+K25𝑓2+K35𝑓3+K55𝜓∗. (43)
At this point, we assume that the diffusion processes occurring in each phase are independent, the phases are only coupled through the evolution of interface density, this assumption implies K12 = 0, and the system comes down to ̇ 1=K11𝑓1+K13𝑓3+K15𝜓∗, (44) ̇2=K22𝑓2+K23𝑓3+K25𝜓∗, (45) ̇r = K13𝑓1+K23𝑓2+K33𝑓3+K35𝜓∗, (46) 1 = K15𝑓1+K25𝑓2+K35𝑓5+K55𝜓∗. (47) 3.4.1. Mono-Phase Aggregate
For one phase (𝜙1 = 1), considering the continuous and discontinuous grain-size fluxes to independently satisfy the positivity of entropy (Ricard & Bercovici, 2009), and if there is no deformation, we are left with
̇
1=K11𝑓1+K13𝑓3, (48)
which, once introduced the expression of the forces (equation (26)) and taking into account that𝛼 must vanish if either𝜙1or𝜙2 = 0, yields
̇ 1= 3𝜆2𝜙1𝛾11 𝜆32 1 K11. (49)
This equation appears similar to the equation (12) proposed by Rozel et al. (2011) in the case of no deformation ((i ) =0): ̇i=C ( i ) . (50)
Following Ricard and Bercovici (2009) and Rozel et al. (2011), we consider that, in the absence of deforma-tion, the grain size evolution results from mass diffusive transfer driven by surface tension minimizadeforma-tion,
that is, classical grain growth. This implies that the coefficient K11should be related to the rate of growth of the grains volume and yields
̇ 1=C ( 1 ) = 3𝜆2𝜙1𝛾11 𝜆32 1 K11 = G1 pp−1 1, (51)
where G1is the rate ([m]2.[s]−1) at which the mean grain size grows in order to decrease surface tension and pis the grain-growth power exponent (Bercovici & Ricard, 2012; Rozel et al., 2011). Taking all these remarks into account yields a K11coefficient of the form:
K11=
𝜆3G11
6𝜙1𝜆21. (52)
3.4.2. Two-Phase Aggregate
3.4.2.1. Grain-Size Evolution Equation
The discontinuous fluxes which depend on deformational work rate are related to grain damage (Ricard & Bercovici, 2009; Rozel et al., 2011). In the absence of deformation, the deformation work terms in the system vanish, which, using the equation 52 and the expressions for the thermodynamical forces of the equation (26), yields the system:
̇1= ( 3𝜆2𝜙1𝛾11 𝜆32 1 −𝛾I 𝜕𝛼 𝜕1 ) K11−𝛾I𝜕𝛼 𝜕rK13, (53) ̇2= ( 3𝜆2𝜙2𝛾22 𝜆32 2 −𝛾I 𝜕𝛼 𝜕2 ) K21−𝛾I𝜕𝛼 𝜕rK23, (54) ̇r = ( 3𝜆2𝜙1𝛾11 𝜆32 1 −𝛾I 𝜕𝛼 𝜕1 ) K13+ ( 3𝜆2𝜙2𝛾22 𝜆32 2 −𝛾I 𝜕𝛼 𝜕2 ) K23−𝛾I𝜕𝛼𝜕rK33. (55)
During grain growth, the presence of interfacial area related to the second phase particles is likely to impede the migration of grain boundaries allowing the mean grain size to reach a steady-state at smaller size. This mechanism called Zener pinning has been described by Smith (1948) and widely investigated for metallur-gical purposes as it constrains the influence of impurities on the rheology of metallic alloys (see; Roberts, 2008; Smith, 1948, for instance). It occurs when a migrating grain boundary passes through a smaller inclu-sion which increases the interface curvature, thus increasing surface teninclu-sion energy and impeding grain growth (Herwegh et al., 2005; Mehl & Hirth, 2008). In geological materials, this process extends to the grain effect of one phase on the other during grain growth. In classical grain-growth theories, the Zener pinning effect involves the second phases particles that are very small in size and proportions with respect to the major phase in such a way that they do not evolve during the coarsening of the opposite phase. In this case Hillert (1965) proposes that the pinning effect could be represented by an equation of the form:
d2 dt =G [ 1 − z ( cr )2] , (56)
thus allowing a steady-state when the major phase grain-size reach a given critical size cr. Additionally,
Bercovici and Ricard (2012) build a micromechanical model for Zener pinning allowing the two phases to be of relative equivalent proportions and grain sizes and end up with a comparable equation:
di dt = Gi pp−i 1 [ 1 − z(1 −𝜙i) ( i r )2] = Gi pp−i 1i, (57)
where the critical grain sizecrcorresponds to the interface mean curvature radius r. The coefficient z reads z = 3b𝔫𝜆𝔫+1
2 (𝔫 + 3) 𝜆2
, (58)
where𝔫 depends on the assumed function accounting for the evolution of grain surface curvature during pinning (Bercovici & Ricard, 2012, appendix F.4, equation F.27). We assume that each thermodynamic flux satisfies the positivity of entropy independently. The coefficients K13and K23which couple the grain size iand the mean radius of curvature r evolution equations are thus imposed to be 0 (K13 = K23 = 0). Substituting equation (52) in (53) and (54) and factorizing reads
̇1= G1 pp−1 1 ( 1 − 𝛾I𝜆3 2 1 3𝜆2𝜙1𝛾11 𝜕𝛼 𝜕1 ) , (59) ̇2= G2 pp−2 1 ( 1 − 𝛾I𝜆3 2 2 3𝜆2𝜙2𝛾22 𝜕𝛼 𝜕2 ) , (60) ̇r = −𝛾I𝜕𝛼𝜕rK33. (61)
In the case of grain growth alone, we aim to recover the form of the Zener pinning coefficient proposed by Bercovici and Ricard (2012). Comparing equations 59 and (60) with (57) yields
1 − z(1 −𝜙1) ( 1 r )2 =1 − 𝛾I𝜆3 2 1 3𝜆2𝜙1𝛾11 𝜕𝛼 𝜕1, (62) 1 − z(1 −𝜙2) ( 2 r )2 =1 − 𝛾I𝜆3 2 2 3𝜆2𝜙2𝛾22 𝜕𝛼 𝜕2, (63)
and thus allows to constrain the partial derivatives of the interface density: 𝜕𝛼 𝜕1 = 3𝜆2𝜙1𝜙2z𝛾11 𝜆3𝛾Ir2 , (64) 𝜕𝛼 𝜕2 = 3𝜆2𝜙1𝜙2z𝛾22 𝜆3𝛾Ir2 . (65)
The simplest solution of this system is
𝛼 =3𝜆2𝜙1𝜙2z 𝜆3𝛾Ir2 ( ∑ i 𝛾iii ) +∑ i Ii, (66)
with Ii being the integrand constant relative to phase i. This expression appears consistent with the form of the interface density𝛼 used by Bercovici and Ricard (2012) to derive their two-phase model (see equation (7)). In the absence of a better choice, we will further assume the two integrand constants Iito
be zero.
3.4.2.2. Interface Mean Radius of Curvature Evolution
From deriving the equation (64) with respect to the interface mean curvature radius r, one can write 𝜕𝛼 𝜕r = − 6𝜆2𝜙1𝜙2z 𝜆3𝛾Ir3 ∑ i 𝛾iii, (67)
which yields from equation (61):
̇r = 6𝜆2𝜙1𝜙2z 𝜆3r2
∑
i
𝛾iiiK33. (68)
According to Bercovici and Ricard (2012, appendix E, equation E.23b), the coarsening term of the interface evolution equation reads
̇r = 3𝜙1𝜙2̂GI
To remain consistent with this expression but keeping with the dependence of𝛼 on i, we impose that K33= ̂GI
4 , (70)
which provided that the interface coarsening contributions of phases 1 and 2 written as GIi∕𝛾iare equal to
the interface coarsening rate ̂GI:
GI1 𝛾1 =
GI2
𝛾2 = ̂GI, (71)
and that q = 4 yields the interface coarsening expression: ̇r = 6𝜙1𝜙2𝜆2z ̂GI
𝜆3qrq−1 ∑
i
ii. (72)
3.5. Grain Growth and Damage Evolution Laws
3.5.1. Time Evolution of a Mono-Phase Aggregate With Deformation
Using equation (52) and considering that𝛼 = 0 if 𝜙1or𝜙2 = 0leads from equations (44) and (47) to ̇ 1= G1 pp−1 1+K15𝜓 ∗, (73) 1 = K153𝜆2𝜙1𝛾11 𝜆32 1 +K55𝜓∗. (74)
The last term in equation (73) depending on𝜓∗is related to damage. It has to be negative as damage must reduce grain size (see equation (12)), but the deformation work rate𝜓∗is positive. Thus, the coefficient K
15 must be negative. Recasting the equation (74) as
K15 3𝜆2𝜙1𝛾11 𝜆32 1 =1 − K55𝜓∗, (75) it implies that 1 − K55𝜓∗⩽ 0. (76)
In order to remain consistent with the Rozel et al. (2011) formalism, this condition is satisfied provided that {
K55 =𝜓X∗
X ⩾ 1 . (77)
Furthermore, we assume that damage to grains occurs through two mechanisms: 1. Dynamic recrystallization in the dislocation creep domain; and
2. Potential grain reduction mechanisms in the diffusion creep domain (Bercovici & Ricard, 2012; Menegon et al., 2015; Precigout & Stunitz, 2016; Tasaka et al., 2017).
To account for these mechanisms, we propose to write the function X as X =(1 +𝔣D1
)
F +(1 +𝔣N1 )
(1 − F), (78)
where fD1accounts for the storage of deformation energy due to dynamic recrystallization during dislocation creep, while fN1corresponds to the possible grain-size reduction mechanisms active in diffusion creep. This yields the phenomenological coefficient K55:
K55= [( 1 +𝔣D1 ) F +(1 +𝔣N1 ) (1 − F)] 𝜓 ∗ , (79) where 0 ⩽ 𝔣D1⩽ 1, (80) 0 ⩽ 𝔣N1⩽ 1. (81)
The function F must constrain the activation domains of each mechanisms (Figure E1); to stay consistent with Rozel et al. (2011) equation, we set
F = x 1 x c1+x1 , (82) 1 − F = x c1 x c1+x1 , (83)
wherec1is the transition grain size between the two mechanisms (field boundary grain size), defined by the equation (section D2 and equation (D13)):
ci= ( bi ai𝜏 ni−1 i )1∕mi , (84)
and x is an exponent controlling the sharpness of the transition, F→ 1 if 1⋙ c1and F→ 0 if 1⋘ c1. Substituting equations (82) and (83) into (79) yields the phenomenological coefficient:
K55= [( 1 +𝔣D1) x1 x c1+x1 +(1 +𝔣N1) xc1 x c1+x1 ] 𝜓∗ , (85)
which allows to constrain K15from equation (75): K15 3𝜆2𝜙1𝛾11 𝜆32 1 = x 1 x c1+ x 1 + x c1 x c1+ x 1 −[(1 +𝔣D1 ) x 1 x c1+ x 1 +(1 +𝔣N1 ) x c1 x c1+ x 1 ] K153𝜆2𝜙1𝛾11 𝜆32 1 = − 𝔣D1 x 1 x c1+x1 − 𝔣N1 x c1 x c1+x1 , (86) K15= − 𝜆32 1 ( 𝔣D1x1+𝔣N1xc1 ) 3𝜆2𝜙1𝛾11(x c1+ x 1 ) . (87)
If we do not consider any grain-size reduction mechanism in the diffusion creep domain (𝔣N1 = 0) and consider spherical grains (i=1), we recover the grain-size evolution law proposed by Rozel et al. (2011):
̇ 1= G1 pp−1 1− 𝜆32 1𝜓∗ 3𝜆2𝜙1𝛾11 FD1, (88) where FD1is defined by FD1= 𝔣D1x1 ( x c1+ x 1 ) . (89)
On the other hand, the existence of a nucleation mechanism yields ̇ 1= G1 pp−1 1− 𝜆32 1𝜓∗ 3𝜆2𝜙1𝛾11 ( FD1+FN1), (90) with FN1defined by FN1= 𝔣N1xc1 ( x c1+x1 ) . (91)
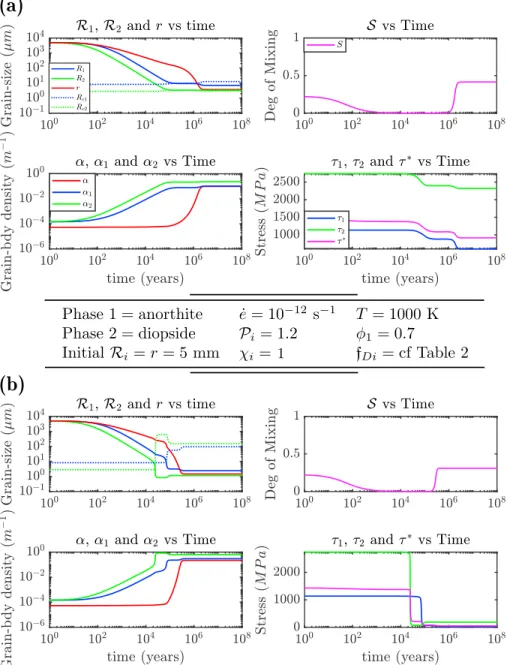
We are only interested here in accounting for such mechanisms and their potential roles and magnitudes in producing the textural variations observed in natural mylonites (see Figure E2). It is not in the scope of this study to propose a complete micromechanical model at grain-size scale explaining these processes, even if it could be added later by relating the partition functions𝔣D1and𝔣N1to grain-scale micromechanical models.
3.5.2. Time Evolution of a Two-Phase Aggregate With Deformation
Reintroducing all the interface dependent terms in the system yields ̇1= G1
pp−1 11
̇2= G2 pp−2 12+K25𝜓 ∗, (93) ̇r = 6𝜙1𝜙2𝜆2z ̂GI 𝜆3qrq−1 ∑ i ii+K35𝜓∗, (94) 1 = K153𝜆2𝜙1𝛾11 𝜆32 1 1+K25 3𝜆2𝜙2𝛾22 𝜆32 2 2−K35 6𝜆2𝜙1𝜙2z 𝜆3r3 ( 𝛾111+𝛾222 ) +K55𝜓∗. (95)
Again, we recast the equation (95) in the same form than in equation (75) yielding: 1 − K55𝜓∗=K 15 3𝜆2𝜙1𝛾11 𝜆32 1 1+K25 3𝜆2𝜙2𝛾22 𝜆32 2 2−K35 6𝜆2𝜙1𝜙2z 𝜆3r3 ( 𝛾111+𝛾222 ) . (96)
Because the coefficients Ki5must be negative and to remain consistent with Bercovici and Ricard (2012) formalism, we propose to write the phenomenological coefficient K55:
K55= 𝜙1[(1 +𝔣D1 ) x 1+ ( 1 +𝔣N1 ) x c1 ] 𝜓∗(x 1+xc1 ) +𝜙2 [( 1 +𝔣D2 ) x 2+ ( 1 +𝔣N2 ) x c2 ] 𝜓∗(x 2+xc2 ) , (97)
with𝔣Dithe deformational work partition fraction relative to dislocation creep and dynamic recrystallization processes and𝔣Nia deformational work rate partition fraction accounting for grain-size reduction mecha-nisms occurring in the diffusion creep domain. In each case a portion of this energy is stored by creating intraphase grain boundaries, while the rest of available energy is stored through the creation of interface surface. In order to account for these energy storage processes, we introduce the forms
𝔣Di= 𝔣𝛼i𝔣Di+ ( 1 −𝔣𝛼i)𝔣Di, (98) 𝔣Ni= 𝔣𝛼i𝔣Ni+ ( 1 −𝔣𝛼i)𝔣Ni. (99)
Taking into account equation (97), the left-hand side of equation (96) becomes 1 − K55𝜓∗= −𝜙1[𝔣 𝛼1 ( FD1+FN1)+(1 −𝔣𝛼1) (FD1+FN1)] −𝜙2[𝔣𝛼2(FD2+FN2 ) +(1 −𝔣𝛼2) (FD2+FN2 )] , (100)
where FDiand FNiare defined by equations (89) and (91). By comparing this expression with the right-hand
side of equation (96), we propose K15 3𝜆2𝜙1𝛾11 𝜆31 1= −𝜙1𝔣𝛼1(FD1+FN1 ) , (101) K25 3𝜆2𝜙2𝛾22 𝜆32 2= −𝜙2𝔣𝛼2(FD2+FN2 ) , (102) K356𝜆2𝜙1𝜙2z 𝜆3r3 ( 𝛾111+𝛾222 ) = −∑ i 𝜙i ( 1 −𝔣𝛼i) (FDi+FNi), (103) which yields the following expressions for the phenomenological coefficients:
K15= − 𝜆32 1𝔣𝛼1 3𝜆2𝛾111 ( FD1+FN1 ) , (104) K25= − 𝜆3 2 2𝔣𝛼2 3𝜆2𝛾222 ( FD2+FN2), (105) K35= − 𝜆3r3[∑ i𝜙i ( 1 −𝔣𝛼i) (FDi+FNi)] 6𝜆2𝜙1𝜙2z(𝛾111+𝛾222) . (106)
Replacing equations (104), (105), and (106) into, respectively, (92), (93), and (94), the set of evolution equations reads ̇1= G1 pp−1 11− 𝜆32 1𝔣𝛼1 3𝜆2𝛾111 ( FD1+FN1 ) 𝜓∗, (107) ̇2= G2 pp−2 12− 𝜆32 2𝔣𝛼2 3𝜆2𝛾222 ( FD2+FN2 ) 𝜓∗, (108) ̇r = 6𝜙1𝜙2𝜆2z ̂GI 𝜆3qrq−1 ∑ i ii− 𝜆3r3∑ i𝜙i ( 1 −𝔣𝛼i) (FDi+FNi ) 6𝜆2𝜙1𝜙2z(∑i𝛾iii ) 𝜓∗. (109)
We consider the Zener pinning effect to be only related to grain growth, and we therefore aim to limit the effect of Zener pinning to the grain-growth member of the grain-size evolution equation (C(i
) equation 12). For this purpose, a variable change is necessary in order to allow for the Zener coefficienti to decrease interface curvature which is an expected effect of Zener pinning (distorting interface), while grain-size damage is the result of deformation energy storage on grain boundaries. To do so, we write𝔣𝛼ias
𝔣𝛼i=𝜒i−𝜒i𝜙iz ( i r )2 . (110) This yields 1 −𝔣𝛼i=1 −𝜒i+𝜒i𝜙iz ( i r )2 . (111)
Eventually, substituting equation (111) into (107)–(109), the final set of evolution equations reads ̇1= G1 pp−1 11− 𝜆32 1𝜒1 3𝜆2𝛾11 ( FD1+FN1 ) 𝜓∗, (112) ̇2= G2 pp−2 12− 𝜆32 2𝜒2 3𝜆2𝛾22 ( FD2+FN2)𝜓∗, (113) ̇r = 6𝜙1𝜙2𝜆2z ̂GI 𝜆3qrq−1 ∑ i ii− 𝜆3r3∑ i𝜙i ( 1 −𝜒ii ) ( FDi+FNi ) 6𝜆2𝜙1𝜙2z∑i𝛾iii 𝜓∗. (114)
3.5.3. Two-Phase Deformational Work Rate 3.5.3.1. Mixing Variables
For two phases A and B, the mixing state of the aggregate is defined by the relative quantity of interfacial area AB and intraphase grain boundaries areas AA and BB (Heilbronner & Barrett, 2014, chapter 18). Normalized by the volume, these quantities are the interface density𝛼 and the intraphase grain boundaries densities 𝛼11 and𝛼22(which are different from the phases grain boundaries densities𝛼1and𝛼2). According to Heilbronner and Barrett (2014, chapter 18), a relevant way to estimate the mixing state is to compute the ratio of the interface area over the sum of interface and both intraphase grain boundaries areas:
S = 𝛼
𝛼 + 𝛼11+𝛼22. (115)
The interface density is given by the equation (66), and the phase intraphase grain boundaries densities could be estimated as the phase grain boundaries density minus the interface density. This is only an estimation because of the grains that are cut by the control volume surfaces; however, for very large number of grains, this error should be small (i.e., if L the volume characteristic length is much larger thani, which is already
a necessary condition for continuous grain-size distributions). S therefore reads
S = 𝛼
where𝛼iis given by equation (15). For a given phase volume fraction, the mixing state of the aggregate is therefore only dependent on the evolution of both phases mean grain size and interface mean curvature radius. Grain growth by removing primarily intraphase grain boundaries (coalescence of neighboring grains) increases the mixing of the phases. In two phase aggregates, dislocation creep which involves grains splitting either by subgrains rotation or bulging (Shimizu, 2008) creates intraphase grain boundaries and results in clusters formation (Raimbourg et al., 2008) thus decreasing the phase mixing. In the diffusion creep domain, the evolution of the mixing state must depend on the mechanism considered. However, fine-grained mylonite often exhibits well-mixed pattern that advocate for a grain reduction mechanism with important creation of interface such as nucleation (Dimanov et al., 2007; Precigout & Stunitz, 2016).
3.5.3.2. Phases Effective Viscosities
It is now necessary to define the form of the deformational work𝜓∗. Even if numerous microscopic, ele-mentary processes are simultaneously involved in ductile rock deformation (dislocation glide and climb, diffusion through grain boundaries or interiors, and grain boundary sliding), the macroscopic deformation and associated flow laws are classically classified under two main types:
1. dislocation or grain size insensitive creep; and 2. diffusion or grain-size sensitive creep.
The effective viscosities associated with these two mechanisms reads (see section D2): 𝜇disl i = 1 2 ( ai𝜏 ni−1 i )−1 , (117) 𝜇diff i = 1 2 ( mi bi ) , (118)
with𝜏ibeing the second invariant of the stress tensor in phase i. We consider that within a phase i, all
grains share a stress̆𝜏iequivalent to the macroscopic stress𝜏∗(Bercovici & Ricard, 2012; Rozel et al., 2011). Furthermore, the deformation of a grain can be due to the two mechanisms acting simultaneously, thus the total strain rate is assumed to be the sum of the strain rate related to each deformation mechanism. We therefore use a composite rheology of the form:
̇e = ̇edisl
i +̇e diff i = ( ai𝜏ni−1 i + Bi mi i ) 𝛕i, (119)
where the coefficient Bi =bi𝜆3−m
𝜆3 accounts for the effect of grain-size distribution variance on the overall rheology (Rozel et al., 2011). This relation defines the phase i global viscosity:
𝜇i= 1 2 ( ai𝜏 ni−1 i + Bi mi i )−1 . (120)
3.5.3.3. Effective Deformational Work Rate
The simplest hypothesis is to assume the aggregate effective viscosity𝜇∗ to be a volume average of the phases viscosities, we get𝜇∗=𝜇 =∑
i𝜙i𝜇iand𝜓∗=𝜓 (Bercovici & Ricard, 2012). However, the influence
of phases mixing on the material rheological behavior may be taken into account in defining the effective deformational work rate. Therefore, the aggregate viscosity𝜇∗is written as a function of phases viscosities 𝜇i, volume fractions𝜙i, and the variable S quantifying the degree of mixing between the phases.
Evaluat-ing the rheology of heterogeneous materials requires a complex mathematical treatment (Drew & Segel, 1971; Hill, 1965; Ravichandran & Seetharaman, 1993). Here the effective viscosity is considered to be a function of the two pure phase end-members viscosities, whose relative contributions is a function of the aggregate “mixing pattern” depicted by the variable S. The aggregate is considered to evolve between two end-member cases:
1. The phase tends toward clustering (see Figures E2b and E2e), when → 0 (i.e., intraphase boundaries are dominant); and
2. The phase tends toward maximum mixing (see Figures E2c and E2f), when → 1 (i.e., interface boundaries are dominant).
If interface grain boundaries are dominant, the variable S tends toward unity (the case S = 1 corresponds to the perfect mixing state where there is no intraphase boundaries anymore akin to the chessboard pattern). In
contrast, even if the texture includes large clusters, the presence of two phases implies a nonzero amount of interface. As a consequence, if S could be low depending on the amount and size of grains clusters, it cannot reach zero. The evolution of the aggregate mixing state is likely to be controlled by the dominant deformation mechanism acting on each of the two phases. In order to compute the material effective viscosity, we consider that in case (1) the whole rheology is dominated by the clusters (or layers) of the weakest phase, while the homogeneous mixing of case (2) is likely to results in an average of the two phases viscosities. These remarks lead us to propose the following expression for the aggregate effective viscosity:
𝜇∗=(𝜙1𝜇1+𝜙2𝜇2)+ (1 −)
( 𝜇1𝜇2
𝜙1𝜇2+𝜙2𝜇1 )
. (121)
Thus, when the phases are clustered ( → 0), the first term is negligible, and the rheology is dominated by the weakest phase (harmonic mean). On the contrary, when the phase are well mixed ( → 1), the viscosity is approximated by the first term and results from a volume average of the two phases viscosities. This averaging hypothesis on the rheology of the general aggregate is still linear with respect to the strain rate, thus the total work rate acting on the control volume reads
𝜓∗=𝜏∗∶ ̇e =2𝜇∗̇e2 =2̇e2 [ (𝜙1𝜇1+𝜙2𝜇2)+ (1 −) ( 𝜇1𝜇2 𝜙1𝜇2+𝜙2𝜇1 )] . (122)
4. Application of the Model in Mono and Two-Phase Cases
4.1. Dimensionless Equations and Solving Method
In deriving dimensionless relations, we account for the possibility of different phases rheological laws. The phase 2 rheological parameters a2 =𝔞2exp(−Edisl
2 ∕RT )
, b2 = 𝔟2exp(−Ediff 2 ∕RT
)
are scaled using the cor-responding parameters of the phase 1, thus the imposed strain ratėe and the rheological parameters of the phase 1, a1=𝔞1exp ( −Edisl 1 ∕RT ) and b1=𝔟1exp ( −Ediff 1 ∕RT )
are our main scaling parameters:
̇e = ̇eṡe′ with ̇es= ̇e, (123)
t = tst′ with t s= 1 ̇e, (124) 𝜏 = 𝜏s𝜏′ with 𝜏s= ( ̇es a1s )1 n1 , (125) = s′ with s= ( b1s 𝜏s ̇es )1 m1 , (126) a1=a1sa′1 with a1s=a1, (127) B1=B1sB′1 with B1s=B1, (128) a2=a2sa′2 with a2s= ̇es 𝜏n2 s = ̇e 1−n1 n2 s a− n1 n2 1 , (129) B2=B2sB′2 with B2s= m2 s ̇e 𝜏s =B m2 m1 1 ̇e m2(1−n1)+m1(n1−1) m1n1 a m2−m1 m1n1 1 , (130) where Bi= 𝜆3−mi 𝜆3 bi. (131)
Using these scaling parameters, the rheological equation does not change and yields ̇e′=a′ i𝜏 ′ni i + B′ i ′mi i 𝜏′ i. (132)
From equations (112) and (113), using the scaling parameters described above, the grain size evolution law reads ̇i ′ = Gi p(sp−1)̇es [ 1 − z(1 −𝜙i) ( ′ r′ )2] −𝜆3 ( 1 −𝜒1)′2 i s𝜏s 3𝜆2𝛾ii ( FDi+FNi ) 𝜓′∗, (133) ̇i ′p =CiZi−Di ′(p+1) 1 ( FDi+FNi ) 𝜓′∗, (134)
where Ci, Zi, and Diare given by
Ci= Gi 2 ṡes , (135) Zi=1 − z ( 1 −𝜙i ) ( ′ i r′ )2 , (136) Di= p𝜆3𝜒is𝜏s 3𝜆2𝛾ii . (137)
The dimensionless mean radius of curvature equation reads from equation (114): ̇r′= 3𝜙1𝜙2𝜆2z ̂GI 𝜆3qr′(q−1)q ṡes ∑ i ii− q𝜆3r′3 s𝜏s ∑ i𝜙i ( 1 −𝜒iZi ) ( FDi+FNi ) 6𝜆2𝜙1𝜙2z∑i𝛾iii 𝜓 ′∗, (138) ̇r ′q=C I ∑ i ii−DI r′ (q+2))∑ i𝜙i ( 1 −𝜒iZi ) ( FDi+FNi ) ∑ i𝛾iii 𝜓′∗, (139)
with the coefficients:
CI= 3𝜙1𝜙2𝜆2z ̂GI 𝜆3q ṡes , (140) DI= q𝜆3s𝜏s 6𝜆2𝜙1𝜙2z. (141)
To evaluate the behavior of the model, we assume velocity boundaries conditions to be v = u(𝑦)̂x (simple shear), applied to a horizontal layer infinite in x and finite in y. The medium is considered uniform in both xand y directions so the volume fractions𝜙 and 𝜙2 = 1 −𝜙 remain constant and uniform throughout the calculation. Therefore, all material derivatives become only dependent on time t, and we have
D Dt =
d
dt (142)
In simple shear and zero dimension, the only imposed strain-rate tensor component is ̇e = 1 2
𝜕u
𝜕𝑦. Thus, the
only component of stress tensor is given by 𝜏i= ( ̇e ai+Bi −mi i 𝜏 1−ni i )1∕ni , (143)
which is evaluated numerically using a Picard fixed point scheme. This yields the deformational work on each phase i through
𝜓i=2̇e𝜏i. (144)
Then, the total deformational work rate𝜓∗is computed using equation (115) which then allows to calculate the time evolution of1,2(equation (134)), and r (equation (139)) using a fourth-order Runge-Kutta explicit iterative scheme. The code was developed with using Matlab©.
4.2. Model Parameters
4.2.1. General Parameters and Rheological Laws
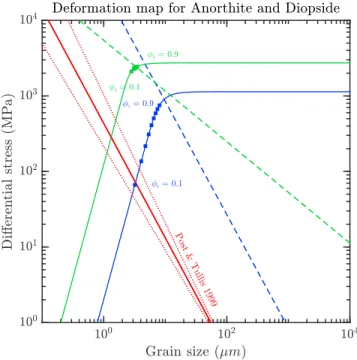
The role of the grain-size distribution dispersion during two-phase material deformation could be important (Rozel et al., 2011). Accordingly, we choose to use rheological laws for dislocation and diffusion creep derived from the same starting material. We use the rheological parameters from Hirth and Kolhstedt (2003) for olivine flow laws, Rybacki and Dresen (2000) for anorthite, and Dimanov and Dresen (2005) for diopside. For grain-growth laws, we use the parameters proposed by Karato (1989) for olivine using an activation energy of 3105Jmol−1K−1(Bercovici & Ricard, 2012). The growth laws used for anorthite and diopside are from Dresen et al. (1995) and Fisler et al. (1997), respectively. The experimental parameters are summarized in Table E1. A rough estimate from Hidaka gabbro thin section measurement (ratio of measured grain perimeter over the perimeter of a circle of equivalent area, 2-D measures) yields a value of 1.2 for the grain roughnessi, which we will adopt for our computations. Grain boundaries and interfaces surface tension energy differences are assumed close enough to be assumed equal to 1J (Bercovici & Ricard, 2012; Duyster & Stockhert, 2001). As the medium is considered incompressible, we do not account for activation volume and also neglect the possible effect of water fugacity. All the parameters are summarized in Table E1 below. The rheological laws for plagioclase, diopside, and olivine are plotted in a deformation map (stresses as a function of grain size) in Figure E5. We impose throughout the computation a constant strain rate of 10−12s−1as a reasonable order of magnitude for geological deformation processes.
4.2.2. Zener Pinning Parameters
The value of the pinning coefficient z is computed using the value of n = 1 which yields bn = 1∕20and z = 3𝜆4
160𝜆2. The exponent of the mean interface curvature radius is q = 4 as comes out of our equation (72) and was also proposed by Bercovici and Ricard (2012). To determine the interface mean curvature radius growth rate ̂GIby comparing the model to the grain growth experiments of Hiraga et al. (2010), Bercovici
and Ricard (2012) proposed the form
GI =
qGi
p250̃r
(q−p), (145)
where Githe phase growth rate considered identical for the two phases, p is the grain growth exponent
considered to be 2 (Hashim, 2016), and̃r is the experimental interface roughness considered to be of the order 1𝜇m (Bercovici & Ricard, 2012, 2013). In the current case, in order to account for different grain-size growth rates, we propose
̂GI=gI(𝜙2G1+𝜙1G2), (146)
because in the case of𝜙i>>> (1 − 𝜙i)), the interface growth rate should be dominated by the less abundant phase. This equation imposes a linear dependence of ̂GIon the phases volumic fractions. Another possibility can be ̂GI=gI ( G 1G2 𝜙1G1+𝜙2G2 ) , (147)
which yields a hyperbolic relationship between ̂GIand𝜙i. These equations are likely to be valid when𝜙i→ 0, but in the limit case where𝜙i = 0, the whole equation for the interface mean radius of curvature r vanishes,
and this equation does not make sense anymore. We will choose the equation (146) as the simplest choice for the following numerical applications. The parameter gI is fixed to 7.910−2because lower values yield
unphysical negative value of the Zener coefficienti. The grain growth rate Giis given by
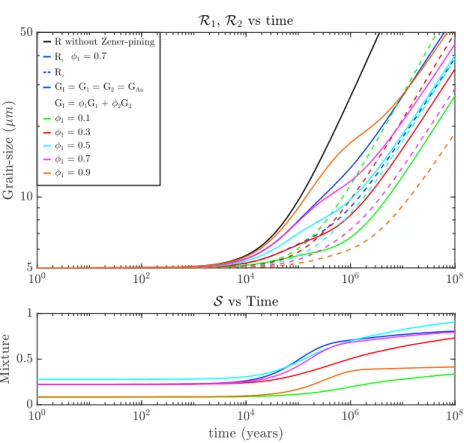
Gi=g grow i exp ( −Egrowi RT ) , (148)
where R is the gas constant, T is the temperature, and giand Egrowi are, respectively, a prefactor and an acti-vation energy (Table E1). As the phases volumic fraction may have an important impact on the grain-sizes growth rates, we display on Figure E4 the grain sizes of during grain growth using the grain growth law of Dresen et al. (1995) for anorthite (phase 1) and Fisler et al. (1997) for enstatite (phase 2) computed with varying𝜙1. The mixing variable S growth until the aggregate reach the maximum mixing possible, that is, all the intraphase boundaries have disappeared in the less abundant phase, all its grains are therefore dispersed within the “matrix” phase. As expected, the maximum S value is reached for𝜙1 = 𝜙2 = 0.5