DIFFERENTIAL LIGHT SCATTERING
SPECTROSCOPY MEASUREMENTS FOR
DETECTING AND IMAGING CANCER
BYCONDON LAU
B.S.E. Mechanical and Aerospace Engineering Princeton University, 2004
Submitted to the Department of Mechanical Engineering in partial fulfillment of the requirements for the Degree of Master of Science in
Mechanical Engineering.
MASSACHUSETTS INSTITUTE OF TECHNOLOGY January, 2006
0 2006 Massachusetts Institute of Technology All rights reserved
Signature of Author: ___
Department of Mechanical Engineering February 03, 2006 Certified by: Michael Feld Professor of Physiks Accepted by: MASACHSS NST1TUjTE-. OF TECHNOLOGY Peter So Professor of M6clanical Eniineering
Lallit Anand Professor of Mechanical Engineering Graduate Officer
Abstract
Optical spectroscopy show great promise for diagnosing the earliest stages of cancer. Light scattering spectroscopy (LSS), the study of single elastic backscattering as a function of wavelength and angle, can detect subcellular structural changes in early cancer. We have developed two novel differential light scattering spectroscopy
techniques, space differential LSS (SD/LSS) and p-angle differential LSS (#/LSS), for detecting the single backscattering signal from a reflectance spectrum dominated by multiple scattering and diffuse reflectance. SD/LSS exploits the penetration abilities of diffuse reflectance while
#/LSS
exploits the angular asymmetry of single backscattering from large particles.#/LSS
has the added advantage of being able to isolate single backscattering specifically from scatterers much larger than the wavelength. Weimplement
#/LSS
to interrogate colon tissue and to develop diagnostic algorithms based on Mie theory. The results show great promise for diagnosing cancer. Instrumentation is being developed to implement SD/LSS and #/LSS together in a wide area imaging system with the goal of studying and detecting cancer at its earliest stages in vivo and in real time. The system has been validated with controlled tissue phantoms and will soon be ready for clinical studies.Table of Contents
Introduction ... 3
1. Spectroscopic techniques for cancer diagnosis ... 12
1.1. Spectroscopy for cancer detection ... 12
1.2. Spectroscopic imaging ... 17
2. Principles of light scattering in tissue ... 23
2.1. Two-layer tissue model ... 23
2.2. Principles of light scattering from a single particle ... 24
2.3. Scattering by particles smaller than the wavelength ... 29
2.4. Scattering by a homogeneous sphere of arbitrary size ... 31
2.5. Scattering by a tissue-like collection of non-ideal particles ... 35
3. Techniques for isolating single backscattering ... 41
3.1. L SS research ... 41
3.2. Space differential LSS ... 44
3.3.
#-angle
differential LSS ... 463.4. Differential LSS imaging ... 48
4. Implementation and experimental results ... 52
4.1.
#/LSS
on tissue phantoms ... 524.2.
#/LSS
on ex vivo colon tissue ... 654.3. SD/LSS effectiveness ... 74
4.4. Spectroscopic imaging with SD/LSS and 0/LSS ... 76
C onclusion ... 81
Appendix A. Mie fitting program for
#/LSS
ex vivo tissue study ... 84Appendix B. Signal to noise analysis ... 88
Introduction
Cancer is the second leading cause of death in the world. Each year, cancer kills over 500 thousand people in the United States alone1. The vast majority of human cancers originate in the epithelium of the body cavities, including the gastrointestinal, respiratory, and genitourinary systems 2. The epithelium is the outermost protective layer
of cells lining the body's surfaces. In open cavities such as the mouth and cervix, the epithelium is exposed to air while in organs such as the stomach, the epithelium is in contact with digestive juices. Virtually all epithelial cancers are treatable if detected at an early, pre-invasive stage. If the cancer is allowed to metastasize, treatment becomes much more difficult. Current cancer diagnosis methods usually involve two medical procedures. The first procedure is a wide-area surveillance over the tissue, such as mammography, colposcopy, palpation (examination by touch), or visual examination. When warning signs are present, small pieces of tissue from suspicious sites are excised from the patient and the cellular morphology is analyzed under a microscope. This second procedure is called biopsy and is the gold standard of cancer diagnosis. Unfortunately, many forms of precancerous and early cancerous lesions are difficult to detect using traditional surveillance procedures. The current wide-area surveillance methods lack sensitivity and biopsies can only sample a small portion of the at risk tissue. Therefore, there is a need for wide-area imaging systems capable of detecting cancer in its earliest stages.
So far, the majority of imaging modalities focus on tissue structure or anatomy at the organ scale, which is not sufficient for detecting tiny precancers at their earliest stages 3. Biochemical and subcellular morphological changes have been shown to
accompany cancer development4. Some of the most prominent changes are enlargement, crowding, and darkening of nuclei in cancerous epithelial cells. Nuclei are typically 4 -7pLrm in size, but can expand to the volume of the cell in cancerous cells5. We focus on nuclear changes in this thesis. It will be most beneficial to develop new cancer imaging modalities that provide subcellular biochemical and morphological information. Several new optical imaging modalities target these features and recent testing has shown great promise. These modalities illuminate the tissue surface with light and collect the returning light for analysis.
Confocal microscopy imaging: Confocal microscopy uses a pinhole to selectively focus light from a small area (several microns) of the tissue. The pinhole is "scanned" across the tissue surface. The images produced are due to light scattered backwards at interfaces of different refractive index. The confocal setup prevents light scattered from outside the region of interest from being focused on the camera, producing thin section images with high resolution and contrast. The size of the pinhole, among other variables, determines the depth and lateral resolution of the system. Several research groups have demonstrated the use of confocal scanning microscopes for imaging human and animal tissues, both ex vivo and in vivo6. Skin and oral mucosa are easily accessible with this technique. The technique has also been applied to image bladder7, embryo8 9, kidneyl4, skin'1, and
12 retina
Optical coherence tomography: Optical coherence tomography (OCT) utilizes the coherence properties of light to obtain cross sectional images of scattering media such as living tissue13. This technique employs low coherence light (light with a short coherence length) in a Michelson interferometer. The specimen is placed at the end of the sample
arm. Backscattered light interferes with light returning from the mirror in the reference arm. Constructive interference occurs only when the distance to a scattering interface in the sample matches that to the reference mirror to within the coherence length. Depth is probed by scanning the reference mirror position and detecting the interference signal. Cross-sectional images can be built up from multiple axial scans at different transverse positions in the sample. As with confocal microscopy, image formation is again due to refractive index change. In turbid tissues, imaging depths on the order of one millimeter
can be achieved, with resolution on the order of several tens of microns. OCT has been used to obtain in vivo images of clear tissues such as the human eye'4 and turbid tissues
such as esophageal mucosa . It has also been used to image intra-arterial walls, arthritic
16 17 18
cartilage and gynecologic neoplasms, and in vitro frog embryos .
Polarization imaging: Several groups have used polarized light to image superficial tissues. Linearly polarized light illuminates the tissue surface. If scattered light with the same polarization is collected, superficial features are observed. If the opposite polarization is collected, sub-surface features are observed' 9. Anderson et al.2 used polarized light to enhance contrast in skin images by separating the specularly reflected and multiply-scattered components of light emerging from skin. Jacques et al. used polarized light to image superficial layers of human skin.
Fluorescence imaging: Fluorescence is induced by the excitation of fluorophores in the tissue, usually with deep blue or ultraviolet illumination. Therefore, fluorescence contains information about fluorophore concentrations in the tissue. This provides valuable biochemical information. Two-photon microscopy is capable of imaging fluorophores
2d
structures in the tissue. Wu et. al. have measured tissue auto-fluorescence, fluorescence from native fluorophores, to detect neoplastic growths in vivo . Wang et. al. have also developed a fluorescence imaging system for in vivo identification of colonic dysplasia24. This project has been translated into Pentax's recently released Lung cancer imaging system, the Safe 3000.
The imaging modalities above use all of the returned light to form an image. In the cases of confocal microscopy, OCT, and polarization imaging, the light is focused on the camera to form a physical image of the cellular morphology. Fluorescence imaging maps fluorescence intensity from different positions of the tissue. These techniques have provided good results for cancer diagnosis, but we can gain extra diagnostic power by distinguishing the returned light by color. The technique of studying the frequency/wavelength spectrum of returned light is called Spectroscopy. It has been used extensively to identify unknown substances. Spectroscopy is not restricted to using electromagnetic waves near the visible regime (400nm to 700nm); other spectroscopic concepts such as neutron scattering spectroscopy provide valuable information on the properties of matter2 5. In this thesis we will focus on spectroscopy with visible and
near-visible light for diagnosis of precancer.
Spectroscopy has recently proven to be a powerful diagnostic tool for many types
26 27
of precancer . In medical spectroscopy, light photons excite (illuminate) the tissue surface and emitted (returning) photons are measured at each wavelength. Several of the exciting new spectroscopic modalities are elastic light scattering (ELSS), absorption (AS),
fluorescence (FS), and Raman spectroscopy (RS). ELSS utilizes light scattered at the same wavelength as the incident light. AS uses the spectrum of scattered light to determine the energy absorption properties of the tissue. FS uses the spectrum of
fluorescence and RS uses the Raman effect28. Spectroscopy can provide structural and
biochemical information at the subcellular level29. The fundamentals of these modalities along with the latest medically relevant research will be reviewed in detail in chapter 1. To date, the use of spectroscopy for cancer diagnosis has primarily focused on diagnosis of small tissue areas on the order of several square millimeters. One average diagnosis is given for the area. Spectroscopic diagnosis can be conducted by using an optical fiber probe that delivers excitation light to the tissue surface and collects returned light.
Being able to perform spectroscopic diagnosis over a wide area of several cm2 is a potentially very powerful surveillance technique. Spectroscopic imaging illuminates a wide area of tissue with light and collects the spectra of light returned from each region in the area. The spectra are analyzed to provide cancer diagnosis in each region. Conducting spectroscopic diagnosis over a wide area greatly reduces the risk of missing small cancerous growth. It can also be used to assess cancer margins, such as in breast, to insure tumors have been completely removed during surgery. Ultimately, spectroscopic imaging can serve as a guide to biopsy to avoid unnecessary excisions and greatly reduce medical costs. If the techniques prove sufficiently accurate, they may replace biopsy as the gold standard of cancer diagnosis. Spectroscopic imaging can be implemented through common medical devices such as colposcopes (cervix) and imaging endoscopes.
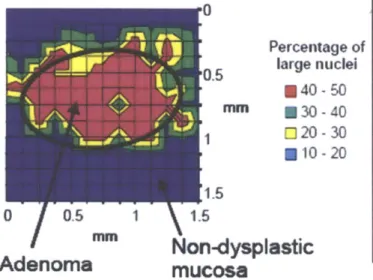
Research on spectroscopic imaging has been in progress for several years. Benavides et. al developed a colposcope capable of conducting FS and ELSS over a 3.5cm diameter area of the cervix3 0. Gurjar et. al. of the MIT Spectroscopy Laboratory
implemented a special case of ELSS, which considered only photons that singly backscattered from the tissue (LSS), over a 1.7cm2 square area of ex vivo colon tissue divided into over ten thousand 125pm by 125ptm regions3 1. A detailed-review of current
advances in spectroscopic imaging is in chapter 1. The research to be presented in this thesis springs from the work of Gurjar et. al.
This thesis is the basic studies part of a project to develop spectroscopic imaging systems based on ELSS, AS, and FS for cancer diagnosis in cervix and oral cavity. We have developed two novel techniques based on the difference between two ELSS signals to conduct spectroscopic imaging. The goal of this thesis is to evaluate the potential of these techniques for measuring cellular morphology and diagnosing cancer with tissue phantom and ex vivo tissue experiments. We also develop a physical model based on light scattering theory to understand the origins of the measured spectra and to extract scatterer properties. Testing is conducted with instrumentation that can be transferred to the clinical imaging system. Chapter 1 provides fundamental concepts and recent research on frequently used spectroscopic modalities for cancer detection. Chapter 2 reviews the fundamental physics of elastic light scattering relevant to elastic light scattering spectroscopy. Chapter 3 samples previous research on LSS for cancer detection and explores challenges involved with implementing LSS. This chapter also presents our two novel differential measurements and how they address the challenges presented by LSS
while improving spectroscopic imaging using LSS. Chapter 4 presents instrumentation and experimental results and discusses findings from tissue phantom and ex vivo tissue studies.
H. Weir, M. Thun, B. Hankey, L. Ries, H. Howe, P. Wingo, A. Jemal, E. Ward, R. Anderson, B. Edwards; "Annual Report to the Nation on the Status of Cancer, 1975-2000, Featuring the Uses of Surveillance Data for Cancer Prevention and Control"; J. of the National Cancer Inst.; Vol. 95, 1276-1299 (2003).
2 A. Jemal, T. Murray, E. Ward, A. Samuels, R. Tiwari, A. Ghafoor, E. Feuer, and M.
Thun; "Cancer statistics, 2005"; CA Cancer J Clin; Vol. 55, 10-30 (2005).
3 D. Benaron; "The future of cancer imaging"; Cancer and Metastasis Reviews; Vol. 21, 45-78 (2002).
4 R. Cotran, V. Kumar, T. Collins; Pathologic Basis of Disease; W.B. Saunders Company (1999).
5 L. Perelman, V. Backman, G. Zonios, R. Manoharan, A. Nusrat, S. Shields, M. Seiler, C.
Lima, T. Hamano, I. Itzkan, J. Van Dam, J. Crawford, M. Feld; "Observation of Periodic Fine Structure in Reflectance from Biological Tissue: A New Technique for Measuring Nuclear Size Distribution", Physical Review Letters; Vol. 80, No. 3, 627-30 (1998).
6 W. Petroll, H. Cavanagh, J. Jester; "Clinical confocal microscopy"; Curr. Opin. Ophthalmol.; Vol. 9, 59-65 (1998).
7 F. Koenig,' S. Gonzalez, W. White, M. Lein, M. Rajadhyaksha; "Near-infrared confocal
laser scanning microscopy of bladder tissue in vivo"; Urology; Vol. 53, 853-857 (1999). 8 P. Kulesa, S. Fraser; "Confocal imaging of living cells in intact embryos"; Methods Mol. Biol; Vol. 122, 205-222 (1999).
9 S. Gonzalez, M. Rajadhyaksha, A. Gonzalez-Serva, W. White, R. Anderson; "Confocal reflectance imaging of folliculitis in vivo: correlation with routine histology"; J. Cutan. Pathol.; Vol. 26, 201-5 (1999).
10 M. Kneen, D. Harkin, L. Walker, D. Alcorn, P. Harris; "Imaging of renal medullary
interstitial cells in situ by confocal fluorescence microscopy"; Anat. Embryol.; Vol. 200, 117-21 (1999).
" M. Rajadhyaksha, R. Anderson, R. Webb; "Video-rate confocal scanning laser microscope for imaging human tissues in vivo"; Appl. Opt.; Vol. 38 (1999).
1 P. Vieira, A. Manivannan, C. Lim, P. Sharp, J. Forrester; "Tomographic reconstruction of the retina using a confocal scanning laser ophthalmoscope"; Physiol. Meas.; Vol. 20,
1-19 (1999).
13 D. Huang, E. Swanson, C. Lin, J. Schuman, W. Stinson, W. Chang, M. Hee, T. Flotte, K. Gregory, C. Puliafito, J. Fujimoto; "Optical coherence tomography"; Science; Vol. 254, 1178-1181 (1991).
1 M. Hee, J. Izatt, E. Swanson, D. Huang, J. Schuman, C. Lin, C. Puliafito, J. Fujimoto; "Optical coherence tomography of the human retina"; Arch. Ophthalmol.; Vol. 113, 325-32 (1995).
15 K. Kobayashi, J. Izatt, M. Kulkarni, J. Willis, M. Sivak; "High-resolution
cross-sectional imaging of the gastrointestinal tract using optical coherence tomography: preliminary results"; Gastrointest. Endosc.; Vol. 47, 515-23 (1998).
16 J. Fujimoto, S. Boppart, G. Tearney, B. Bouma, C. Pitris, M. Brezinski; "High resolution in vivo intra-arterial imaging with optical coherence tomography"; Heart; Vol. 82, 128-133 (1999).
17 S. Boppart, B. Bouma, C. Pitris, J. Southern, M. Brezinski, J. Fujimoto; "In vivo cellular optical coherence tomography imaging"; Nature Medicine; Vol. 4, 861-5 (1998).
18 C. Pitris, A. Goodman, S. Boppart, J. Libus, J. Fujimoto, M. Brezinski; "High-resolution imaging of gynecologic neoplasms using optical coherence tomography"; Obstet. Gynecol.; Vol. 93, 135-139 (1999).
19 S. Demos, R. Alfano; "Optical polarized imaging"; App. Opt.; Vol. 36, 150-155 (1997).
2 R. Anderson; "Polarized light examination and photography of the skin"; Arch. Dermatol.; Vol. 127, 1000-1005 (1991).
2 S. Jacques, J. Roman, K. Lee; "Imaging Superficial Tissues with Polarized Light"; Las. Surg. Med.; Vol. 26, 119-129 (2000).
2 W. Denk, J. Strickler, W. Webb; "Two-photon laser scanning fluorescence microscopy"; Science; Vol. 248, 73-76 (1990).
2 T. Wu, J. Qu, T. Cheung, K. Lo, M. Yu; "Preliminary study of detecting neoplastic growths in vivo with real time calibrated autofluorescence imaging"; Optics Express; Vol. 11, No. 4 (2003).
2 T. Wang, J. Crawford, M. Feld, Y. Wang, I. Itzkan, J. Van Dam; "In vivo identification of colonic dysplasia using fluorescence endoscopic imaging"; Gastrointestinal Endoscopy; Vol. 49, 447-455 (1999).
25 P. Mitchell, S. Parker, A. Ramirez-Cuesta, J. Tomkinson; Vibrational Spectroscopy with Neutrons; World Scientific (2005).
26 V. Backman, M. Wallace, L. Perelman, J. Arendt, R. Gurjar, M. Mlller,
Q.
Zhang, G. Zonios, E. Kline, T. McGillican, S. Shapshay, T. Valdez, K. Badizadegan, J. Crawford, M. Fitzmaurice, S. Kabani, H. Levin, M. Seiler, R. Dasari, I. Itzkan, J. Van Dam, M. Feld; "Detection of Preinvasive Cancer Cells"; Nature; Vol. 406, 35-6 (2000).27 Y. Mirabal, S. Chang, E. Atkinson, A. Malpica, M. Follen, R. Richards-Kortum;
"Reflectance Spectroscopy for in-vivo detection of cervical precancer"; J. Biomedical Optics; Vol. 7, 587-94 (2002).
28 C. Raman, K. Krishnan; "A New Type of Secondary Radiation"; Nature; Vol. 121 (1928).
29 G. Zonios, L. Perelman, V. Backman, R. Manoharan, M. Fitzmaurice, J. Van Dam, M.
Feld; "Diffuse reflectance spectroscopy of human adenomatous colon polyps in vivo";
Applied Optics, Vol. 38, No. 31, 6628-37 (1999).
30 J. Benavides, S. Chang, S. Park, R. Richards-Kortum, N. Mackinnon, C. MacAulay, A.
Milbourne, A. Malpica, M. Follen; "Multispectral digital colposcopy for in vivo detection
of cervical cancer"; Optics Express; Vol. 11, No. 10, 1223-36 (2003).
31 R. Gurjar, V. Backman, L. Perelman, I. Georgakoudi, K. Badizadegan, I. Itzkan, R. Dasari, M. Feld; "Imaging human epithelial properties with polarized light-scattering spectroscopy"; Nature Medicine; Vol. 7, 1245-8 (2001).
Chapter 1:
Spectroscopic techniques for cancer diagnosis
Spectroscopy excites the sample with light and the emitted light can be analyzed by wavelength. Depending on the type of spectroscopy, the illumination light can be monochromatic or broadband and is typically provided by a laser or a white light source. Also, a diffraction grating may be used to disperse the emitted light into its different colors. Spectroscopy has been used extensively to identify unknown substances. In medicine, spectroscopy can provide information about tissue structure and biochemistry not accessible to conventional screening methods. This chapter reviews the literature on spectroscopy for cancer detection. Section 1.1 reviews spectroscopic modalities applied over small areas of tissue. Section 1.2 reviews previous research on spectroscopic imaging, one of the focuses of this thesis.
1.1 Spectroscopy for cancer detection
Much progress has been made in applying conventional spectroscopic modalities to cancer detection. This section reviews 3 frequenctly used modalities: Raman spectroscopy (RS), fluorescence spectroscopy (FS), and reflectance spectroscopy (RES). The accuracy of diagnosis is compared to biopsy and expert analysis by a pathologist. Accuracy is described by sensitivity (percentage of samples correctly diagnosed as diseased) and specificity (percentage of samples correctly diagnosed as healthy).
Raman spectroscopy: Raman spectroscopy (RS) relies on the Raman effect, first observed by Raman and Krishnan. Photons at a given wavelength incident on a molecule are inelastically scattered such that the scattered light occurs in a pattern of spectral lines shifted in wavelength from the incident light. Two shifts, one to shorter wavelengths (anti-Stokes) and the other to longer wavelengths (Stokes), are observed. The Stokes scatter has higher intensity and is usually the one observed with near-visible infrared excitation wavelengths. The shift in spectral line pattern is molecule specific. Raman scattering is typically much weaker then elastic scattering (not shifted in wavelength), but narrow bandwidth lasers can provide sufficient excitation intensity to overcome noise. Therefore, Raman spectroscopy has been very valuable for identifying chemical constituents. Since cancer progression is accompanied by biochemical changes in the epithelium, RS can potentially track the changes and diagnose cancer2. Utzinger et. al conducted RS in vivo to detect squamous dysplasia, a precursor to cervical cancer3. They illuminated a 12mm diameter of cervix with 789nm laser excitation and measured the spatially averaged Raman scatter. From 24 measurements done on 13 patients, they observed peaks at 1070, 1180, 1195, 1210, 1245, 1330, 1400, 1454, 1505, 1555, 1656, and 1760 cm~1. Biopsies were independently analyzed from the measured regions. The researchers found a large intensity ratio I (2 = 1454) / I(2 = 1656) and a small ratio I (A = 1330) / I(2 = 1454) correctly distinguished squamous dysplasia from other tissue types in all but one case. Kendall et. al applied Raman spectroscopy to classifying neoplasia (abnormal cell growth) in Barrett's oesophagus ex vivo 4. Eighty-seven samples were excised from 44 patients and independently classified by three pathologists. They obtained sensitivities from 73% to 100% and specificities from 90% to 100%, depending
on the tissue state distinction (eg. Barrett's vs. neoplastic) targeted. Haka et. al used RS to identify benign and malignant lesions in breast tissue ex vivo5. They also developed a
model using basis Raman spectra from nine morphological and chemical features of breast tissue. The measured spectra were fitted to these basis spectra to extract the morphological and chemical makeup of the tissue. From the spectroscopically measured content of fat and collagen, the researchers obtained 94% sensitivity and 96% specificity distinguishing malignant tissue from other types. Raman spectroscopy offers great potential for precancer diagnosis.
Fluorescence spectroscopy: Fluorescence spectroscopy (FS) exploits the variety in absorption and emission properties of molecules. In fluorescence, light at a certain wavelength excites a molecule and light at longer wavelengths is emitted6. For each excitation wavelength there is an emission spectrum. Similar to Raman spectroscopy, each excitation-emission spectrum carries molecule specific information, so FS can be used to track biochemical changes in cancer progression. Typically, the excitation light is low intensity UV radiation and the emission wavelengths are visible. This is convenient for data acquisition because most optics and CCD cameras are designed for visible light. FS can be conducted with fluorescence stains that bond with certain molecules. In this thesis, we focus on autofluorescence, which is fluorescence from native tissue molecules. Ramanujam et. al. excited cervix with 380nm and 460nm light and measured the
7
emission spectra . With the 460nm spectra, they were able to differentiate squamous intraepithelial lesions (SIL) from normal squamous tissue with 91% sensitivity and
75.5% specificity. They were also able to differentiate high-grade SILs from low-grade
distinguished from inflammation and normal columnar tissue with 77% sensitivity and 72% specificity. Wang et. al. studied fluorescence spectra from ex vivo oral tissue using
8
one and two wavelength excitation . They found exciting with two wavelengths
simultaneously gave 81% sensitivity and 94% specificity when separating healthy from cancerous tissue. Bard et. al. combine FS with RES (discussed below) to detect
carcinoma (CIS) and dysplastic lesions in the bronchial tree in vitro 9 . In vivo
measurements on 21 patients found combining FS with RES distinguished high-grade lesions from low-grade lesions with specificity improved from using fluorescence alone. Fluorescence spectroscopy has great potential for detecting biochemical changes in cancer progression.
Reflectance spectroscopy: Reflectance spectroscopy (RES) utilizes spectral changes in elastic scattering and absorption. Elastic scattering is the dominant form of light scattering and depends on scatterer structure. Light at some wavelength exciting a particle is emitted at the same wavelength, as opposed to Raman scattering and fluorescence. Absorption occurs when a photon is not emitted after excitation. The incident energy has been transformed to a non-electromagnetic form. The total emitted spectrum (reflectance spectrum) will be a combination of the effects of scattering and absorption. RES combines elastic light scattering spectroscopy and absorption spectroscopy. In this thesis, we distinguish between two types of reflectance spectroscopy: diffuse reflectance (DRS) and light scattering spectroscopy (LSS). DRS measures light that has undergone multiple scattering events in the tissue. The returned diffuse light has a Lambertian profile, where the intensity at an angle 0 from the direction of maximum intensity, Io, is Io*cos8. DRS with near-visible wavelength excitation can penetrate
beyond the first layer of cells and assess scatterer and absorber concentrations. Scattering and absorption at these wavelengths provide information on tissue structure and hemoglobin (Hb) concentration, respectively . In human tissue, diffuse reflectance dominates the total reflectance spectrum, thus when authors refer to reflectance, they are usually studying diffuse reflectance. LSS analyzes light that has scattered only once (single backscattering) before returning from the tissue. LSS provides information on the most superficial epithelial cells". Because LSS relies on single scattering, it is able to measure detailed scattering properties of cells and thus, their subcellular morphology. Light scattering theory and LSS research is reviewed in chapter 2. Zonios et. al. used DRS to measure scatterer and absorber concentrations in colon polyps in vivo. They fitted measured reflectance spectra to a diffusion limit transport equation'3 and extracted
'(A) and ,
(A),
the inverse of the reduced scattering and absorption mean-free paths, respectively. In the rest of this paper, p,' and p, will imply wavelength dependence.From p, they are able to extract hemoglobin oxygenation and concentration. From Ps'
and assuming Mie scattering, they obtain scatterer density and cross-section. A study of one normal and one adenomatous (polyp) tissue sample found the samples had different hemoglobin concentration and scattering cross-section. Amelink et. al. conducted DRS over different delivery-collection separations to measure blood oxygenation, blood concentration, average blood vessel diameter, and p,'1. They used an optical fiber probe to deliver light to the tissue and collect reflectance. The delivery and collection fibers were spaced at several distances to collect light that traveled different distances in the tissue. Varying delivery-collection separation provides extra information for extracting tissue parameters. They measured 27 non-malignant spectra and 4 malignant spectra from
bronchial tissue of 9 patients. Biopsies were taken from the same locations and tissue state was assessed by a pathologist. The spectra were fitted to a reflectance model based on Monte Carlo simulations and blood vessel geometry 5. They found malignant tissue has lower oxygenation, higher blood concentration, and smaller vessel diameter. Reflectance spectroscopy is very capable of measuring structural properties of tissue and is valuable for cancer diagnosis.
Raman, fluorescence, and reflectance spectroscopy, along with other forms of spectroscopic diagnosis, may soon be part of routine cancer screening procedures in multiple organs. The cellular level biochemical and structural information they provide are invaluable and nearly unattainable by conventional screening procedures. These techniques can be used in combination such that the combined diagnostic accuracy is greater than the accuracy of any individual technique. For example, our laboratory is working on a tri-modal spectroscopy (TMS) project that combines intrinsic fluorescence spectroscopy (IFS), DRS, and LSS 16. IFS is fluorescence spectroscopy with the
influences of scattering and absorption removed. DRS is used to isolate the fluorescence and single scattering signals from multiple scattering and absorption signals. Therefore, TMS can offer more accurate diagnosis than any of FS, LSS, or DRS alone. Spectroscopic diagnosis can also be extended to wide area surveillance from the small area studies presented in this section.
Spectroscopic modalities for cancer detection have been demonstrated effectively over small areas in multiple organs (Section 1.1). In the introduction we discussed frequenctly used imaging techniques and the information they provide. Extending spectroscopy to wide area imaging will enable spectroscopic diagnosis over multiple tissue sites. This greatly decreases the likelihood of missing a small cancerous growth and will reduce the time and cost of treatment. Spectroscopic imaging appears to be a simple extension of small area diagnosis, but a combination of physical constraints makes the jump non-trivial. In this section we present some research on spectroscopic imaging with fluorescence spectroscopy (FS) and reflectance spectroscopy (RES). We leave light scattering spectroscopy (LSS), the study of single backscattering spectra, imaging for chapter 3.
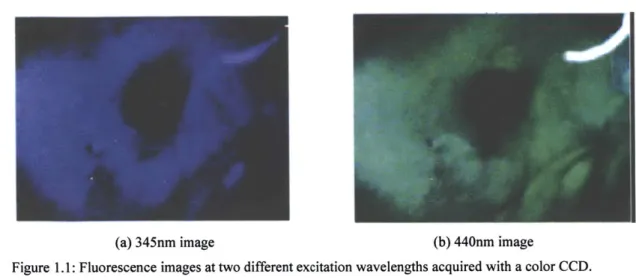
Benavides et. al. used a reconfigured colposcope to acquire 3.5cm diameter fluorescence images at multiple wavelengths from the cervix17. They used two excitation
wavelengths, 345nm and 440nm, to uniformly illuminate a 3.5cm area of cervix and obtained the color images shown in figure 1.1. After processing with an algorithm developed during a small area FS study18, they were able to map areas with high-grade
dysplasia (potentially cancerous) versus squamous normal (cancer free) tissue. The mapping agreed with independent diagnosis determined by a pathologist.
(a) 345nm image (b) 440nm image
Figure 1.1: Fluorescence images at two different excitation wavelengths acquired with a color CCD. Pictures courtesy of Benavides et. al.
Nordstrom et. al. conducted fluorescence and reflectance spectroscopy over a 3mm diameter area, divided into 120 regions, of cervix in vivo j. They studied 373
normal squamous tissue spectra, 25 CIN I (different degrees of cervical intraepithelial neoplasia) spectra, 52 CIN II/III spectra, and 40 metaplasia (transformation to abnormal tissue) spectra. A pathologist independently determined the classifications. With this set of data, the authors set up neural network training routines using part of the spectroscopic data and corresponding histology results. They applied the computed weights to the entire set and obtained the sensitivities and specificities in table 1.1. The authors found FS is able to diagnose disease better than RES but the latter is able to distinguish metaplasia from CIN, demonstrating that the modalities are complementary.
Table 1.1: Diagnostic performance of fluorescence and reflectance spectroscopy imaging system at all regions of all patients studied. Data courtesy of Nordstrom et. al.
Fluorescence Reflectance
Tissue Classes Sensitivity Specificity Sensitivity Specificity
Normal vs. CIN IL/III 91% 93% 82% 67%
Normal vs. Metaplasia 90% 87% 64% 66% Metaplasia vs. CIN II/III 18% 84% 77% 76%
The results of these studies demonstrate that for fluorescence and reflectance spectroscopy, wide area imaging has performance per region comparable to that of small area spectroscopic diagnosis. This is not surprising because an imaging system can be a small area system that is translated from measurement to measurement to acquire data over the entire area of interest (raster scanning). However, constraints such as data acquisition time may necessitate more advanced instrument designs. Fluorescence and reflectance spectroscopy imaging have been well demonstrated and are entering extensive clinical studies , but other spectroscopic modalities such as Raman spectroscopy and light scattering spectroscopy require greater incident light intensity and thus, have not progressed as far in imaging. There are many opportunities for research and development of spectroscopic imaging technology. In the remaining chapters we present progress on LSS imaging.
' C. Raman, K. Krishnan; "A New Type of Secondary Radiation"; Nature; Vol. 121 (1928).
2 R. Cotran, V. Kumar, T. Collins; Pathologic Basis of Disease; W.B. Saunders Company
(1999).
3 U. Utzinger, D. Heintzelman, A. Mahadevan-Jansen, A. Malpica, M. Follen, R. Richards-Kortum; "Near-Infrared Raman Spectroscopy for in Vivo Detection of Cervical Precancers"; Applied Spectroscopy; Vol. 55, 955-9 (2001).
4 C. Kendall, N. Stone, N. Shepherd, K. Geboes, B. Warren, R. Bennett, H. Barr; "Raman spectroscopy, a potential tool for the objective identification and classification of neoplasia in Barrett's oesophagus"; J. Pathol.; Vol. 200, 602-9 (2003).
5 A. Haka, K. Shafer-Peltier, M. Fitzmaurice, J. Crowe, R. Dasari, M. Feld; "Diagnosing
breast cancer by using Raman spectroscopy"; PNAS, Vol. 102, No. 35, 12371-12376
(2005).
6 J. Lakowicz; Principles of Fluorescence Spectroscopy; Kluwer Academic/Plenum Publishers (1999).
7 N. Ramanujam, M. Mitchell, A. Mahadevan, S. Thomsen, A. Malpica, T. Wright, N.
Atkinson, R. Kortum; "Spectroscopic Diagnosis of Cervical Intraepithelial Neoplasia (CIN) In Vivo using Laser-Induced Fluorescence Spectra at Multiple Excitation Wavelengths"; Lasers in Surgery and Medicine; Vol. 19, 63-74 (1996).
8 C. Wang, K. Chiang, C. Chen, C. Chiang, Y. Kuo, S. Chow; "Diagnosis of oral cancer by light-induced auto fluorescence spectroscopy using double excitation wavelengths"; Oral Oncology; Vol. 35, 144-150 (1999).
9 M. Bard, A. Amelink, M. Skurichinac, M. den Bakkerd, S. Burgersa, J. van Meerbeecka, R. Duinc, J. Aertsa, H. Hoogstedena, H. Sterenborg; "Improving the specificity of fluorescence bronchoscopy for the analysis of neoplastic lesions of the bronchial tree by combination with optical spectroscopy: preliminary communication"; Lung Cancer; Vol. 47, 41-47 (2005).
10 G. Zonios, L. Perelman, V. Backman, R. Manoharan, M. Fitzmaurice, J. Van Dam, M. Feld; "Diffuse reflectance spectroscopy of human adenomatous colon polyps in vivo"; Applied Optics, Vol. 38, No. 31, 6628-37 (1999).
" L. Perelman, V. Backman, G. Zonios, R. Manoharan, A. Nusrat, S. Shields, M. Seiler, C. Lima, T. Hamano, I. Itzkan, J. Van Dam, J. Crawford, M. Feld; "Observation of Periodic Fine Structure in Reflectance from Biological Tissue: A New Technique for Measuring Nuclear Size Distribution", Physical Review Letters; Vol. 80, No. 3, 627-30 (1998).
12 R. Gurjar, V. Backman, L. Perelman, I. Georgakoudi, K. Badizadegan, I. Itzkan, R.
Dasari, M. Feld; "Imaging human epithelial properties with polarized light-scattering spectroscopy"; Nature Medicine; Vol. 7, No. 11, 1245-48 (2001).
13 T. Farrell, M. Patterson, B. Wilson, "A diffusion theory model of spatially resolved, stead-state diffuse reflectance for the non-invasive determination of tissue optical properties"; Med. Phys.; Vol. 19, 879-88 (1992).
14 A. Amelink, H. Sterenborg, M. Bard, S. Burgers; "In vivo measurement of the local
optical properties of tissue by use of differential path-length spectroscopy"; Optics Letters; Vol. 29, No. 10, 1087-9 (2004).
15 R. van Veen, W. Verkruysse, H. Sterenborg; "Diffuse-reflectance spectroscopy from 500 to 1060nm by correction for inhomogeneously distributed absorbers"; Optics Letters, Vol. 27, No. 246, 246-8 (2002).
16 I. Georgakoudi, B. Jacobson, J. Van Dam, V. Backman, M. Wallace, M. Muller,
Q.
Zhang, K. Badizadegan, D. Sun, G. Thomas, L. Perelman, M. Feld; "Fluorescence, reflectance, and light-scattering spectroscopy for evaluating dysplasia in patients with Barrett's esophagus"; Gastroenterology, Vol. 120, 1620-9 (2001).17 J. Benavides, S. Chang, S. Park, R. Richards-Kortum, N. Mackinnon, C. MacAulay, A. Milbourne, A. Malpica, M. Follen; "Multispectral digital colposcopy for in vivo detection of cervical cancer"; Optics Express; Vol. 11, No. 10, 1223-36 (2003).
18 S. Chang, M. Follen, A. Malpica, U. Utzinger, S. Gtaerkel, D. Cox, N. Atkinson, C. MacAulay, R. Richards-Kortum; "Optimal excitation wavelengths for discrimination of cervical neoplasia"; IEEE Trans. Biomed. Eng.; Vol. 49, 1102-11 (2002).
19 R. Nordstrom, L. Burke, J. Niloff, J. Myrtle; "Identification of Cervical Intraepithelial Neoplasia (CIN) Using UV-Excited Fluorescence and Diffuse-Reflectance Tissue
Chapter 2
Principles of light scattering in tissue
In Chapter 1 we briefly reviewed research on frequently used spectroscopic diagnosis modalities: Raman spectroscopy, fluorescence spectroscopy, and reflectance spectroscopy. We also reviewed some research on spectroscopic imaging. In section 2.1 of this chapter, we present a two-layer model of elastic light scattering in tissue. Light scattered by tissue under this model is made up of two contributions, single backscattering (SBS) and multiple scattering/diffusive background. In this chapter, we focus on the principal spectroscopic modality of this thesis, light scattering spectroscopy (LSS), the study of single elastic backscattering spectra. Separating SBS from background is the topic of chapter 3. Sections 2.2 through 2.5 provide a quantitative description of light scattering and present powerful findings. The primary objectives of these sections are to introduce and justify our use of the Mie theory and single particle scattering approximations to analyze LSS results in chapter 4. Most of the material discussed in these sections comes from two frequently used textbooks on light scattering'
2
. With a greater understanding of scattering, we can analyze LSS signals in detail to obtain information about scatterers in tissue.
2.1 Two-layer tissue model
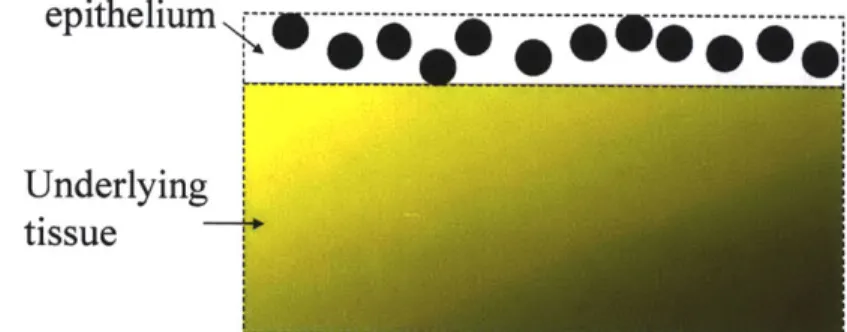
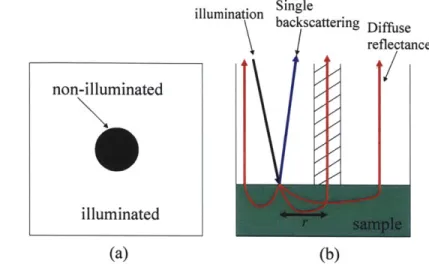
To understand light scattering spectroscopy in tissue, we present a two-layer tissue model in figure 2.1. The top layer consists of epithelial cells and their organelles. The epithelial nuclei here are the primary scatterers because they have a large index of refraction mismatch with the surrounding medium3. Smaller organelles in the epithelium
such as mitochondria, which are more numerous, also scatter4. The lower layer consists of underlying tissue.
epithelium
---
*---Underlying
tissue
Figure 2.1: Two-layer tissue model for light scattering spectroscopy.
Approximately 5% of the illumination light exciting the tissue is singly backscattered by
organelles in the epithelium. Most of the light penetrates the epithelium and is absorbed or undergoes further scattering events. Light returning from the underlying tissue contributes multiple scattering and diffuse reflectance. Since most epithelial cancers originate in the superficial cells of the epithelium5, the origin of single backscattering, LSS is an ideal technique for detecting the earliest stages of cancer. LSS can also be implemented in an imaging modality for wide area diagnosis.
2.2 Principles of light scattering from a single particle
The theory of light scattering from a single particle is the foundation of our research. When an electromagnetic wave is incident on a particle with refractive index different from its surrounding medium, secondary radiation is released in all directions. The secondary radiation is the scattering. Many physical phenomena are due to light scattering. The color of the sky and diffuse reflection off an optically rough surface (roughness > light wavelength A / 4) are two examples. For a small particle (size
comparable to 2) with homogeneous index of refraction, the angular variation of the scattered light depends on A, indices of refraction of the particle and the medium, particle size, and particle shape. Regardless of the complexity of the particle and medium, the scattering is determined by Maxwell's equations.
We can separate the study of light scattering into two problems, the direct and the inverse scattering problems. The direct problem asks for the scattered electric field given the incident field and the properties of the particle (scatterer). This can be found by solving Maxwell's equations, but the process may be difficult for complex configurations. The inverse problem asks for the scatterer's properties given the incident and scattered fields. This is usually the problem of interest in light scattering experiments, including our cancer diagnosis objectives. Unfortunately, to precisely determine the particle's properties, we should know the amplitude and phase of the scattered field at all points in space, which is not usually attainable in practice. In biomedical applications, typically only the amplitude of the scattered field on a plane (camera) is known. To aid the identification process, we can usually make some assumptions about the particle's properties, such as physically feasible ranges for shape, size, and index of refraction. Nevertheless, a unique solution is not guaranteed from a given measurement.
To prepare for the inverse problem, we begin by reviewing the direct problem. Light propagation in matter is described by Maxwell's equations (SI units).
V*D=pF
B
VxE+ =0 at VeB=0 BD (2.1) VxH=JF + at D=c0E+P H = -ME+ B H=--_ME is the electric field, B the magnetic induction, D the electric displacement, H the magnetic field, P the electric polarization, M the magnetization, F- the permittivity, p, the
permeability of free space, PF the charge density, and JF the current density. To close the system of equations, Maxwell's equations require information about the medium of propagation, which are provided by the constitutive relations.
B = pH (2.2)
P = COXE
a is the conductivity, p is the permeability, and X is the electric susceptibility of the medium. For linear, homogeneous, and isotropic media, a, u, and X are constant scalars. Solving Maxwell's equations with the constitutive relations and boundary conditions to describe the particle's borders completely solves the direct problem.
Maxwell's equations in full-form are not easy to solve. Finite difference time domain (FDTD) algorithms solve Maxwell's equations at every spatial position and every step in time6, but these are computation intensive and usually make some assumptions
time and spatial dependences. A monochromatic (one wavelength) light wave has irradiance, frequency (1/A), and polarization. Irradiance is the power per unit area incident on a surface in a direction normal to the surface. Polarization is the orientation of E and how that changes over time. Linearly polarized light has E oscillating along a constant direction. Elliptically polarized light has E changing its magnitude and direction in such a way that the electric field vector traces an ellipse. The polarization state of an electromagnetic wave can be described by its Stokes vector with parameters I,
Q,
U, and V. Linearly Polarized Horizontal Vertical 450 -450 I -1 0 0 0 0 1 -W0 10 0 Circularly Polarized Right Left P I 0 0 0 0Courtesy of Bohren and Huffman
Refer to the text by Bohren and Huffman for the definition of the Stokes parameters. Of note, for unpolarized light, the stokes vector has I= 1 and all other parameters zero. The
usefulness of the Stokes vector is that its transformation after passage through an optical element can be described by a linear matrix multiplication. This matrix is called the Mueller matrix and it can be used to describe a scattering event.
z
Aezi
Ae-L
s
6 0
Aer
/
A
e.
\A A *'SCATTERING . PLANE yIncident light
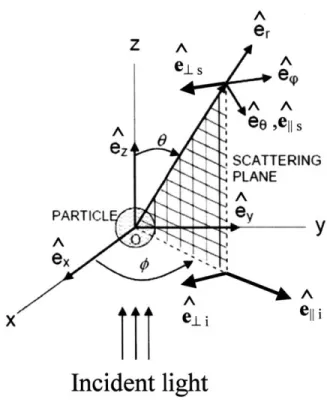
Figure 2.2: Geometry of light scattering. Adapted from Scepanovic et. al.7 and Bohren and Huffman.
The geometry of light scattering is illustrated in figure 2.2. The incident electric field Ej is along e. and the scattered field E, is along er. E is polarized along e1. 9, the
scattering angle, is the angle between e. and e,. The plane containing e. and er is the scattering plane and the angle between it and ex is
#,
the azimuthal angle. Note that#
is not defined for unpolarized illumination. That means there is no#-asymmetry
(azimuthal asymmetry) with unpolarized illumination or at 9 = 1800. The i and s subscripts indicateincident and scattered fields while 11 and .L indicate field components parallel and PARTICLe
exY
exe
e, li
perpendicular to the scattering plane. With this notation, the relation between incident and scattered electric fields can be written in the form:
Ells = e ek('-z) S2 S3)( EllI (2.3)
Els, - ikr (S4 S1, E-D
k is the wave number in the medium and r is the distance to the detector. SI, S2, S3, and S4
form the amplitude scattering matrix and depend on particle size, shape, index of refraction, 0, and
#.
The scattering Mueller matrix also depends on the S terms. In medical imaging, the scattering Mueller matrix is usually of interest because it directly provides the irradiance and polarization of the scattered light.Equation 2.3 is the solution to the direct elastic light scattering problem, although the S terms may not be easy to compute. Before presenting approximate and rigorous solutions to equation 2.3, we review some commonly used scattering terminology. Let
Wsca be the total power scattered by a particle illuminated with irradiance I. The scattering cross-section is defined as Csca = Wsca / L If we consider the cross-section in some small solid angle d., we obtain the differential scattering cross section dCsca / dQ, which is a function of 0 and
0.
From Csca, we can also define the scattering efficiencyQsca = Csca / G, where G is the geometric cross-section of the particle, the amount of area
occupied by the particle in the path of the incident wave. dCsca / dQ is very useful for the O/LSS technique we present in chapter 3 and Qsca has been the basis of much LSS research.
For scatterers that satisfy certain criteria, the S terms take the form of simple expressions that provide insight to scattering dynamics and suggest possible advancements. Scattering from particles with size << A can be described by Rayleigh scattering, where the S terms take the simple form:
S2 3j = ik3aCcos6
0) (2.4)
S4 S1) 0 1,
a is the polarizability of the particle. For particles with refractive index close to that of
the surrounding medium, m = nparicle / nmedium ~ 1, the polarizability is:
a = (m -1)V
2;r
V is the volume of the particle. In tissue, most cell organelles have m close to unity8. Note
from equation 2.4 the S3 and S4 terms vanish, leading to a simplification of the scattering Mueller matrix. From equation 2.3, we find the scattered irradiance has X4 dependence. We also observe from equation 2.3 the magnitude of 4 =o = EII i12 varies as cos20 and IO=9o
= JE i12 is constant in angle. Thus, near the direct backscattering direction, 0= 1800, of interest to in vivo imaging, Io=o ~ 10=9o. The 0/LSS technique we present in chapter 3 exploits the fact that larger particles exhibit greater azimuthally asymmetric scattering around direct backscattering.
In tissue, Rayleigh scattering is only valid for the smallest of cell organelles. Larger organelles such as the nucleus and mitochondria have sizes close to or larger then the wavelength. A less restrictive theory is Rayleigh-Gans scattering, which is accurate for particles that satisfy:
(2.5)
2kalm -1 <<1
a is a length characterizing the size of the particle. For spheres, a is the radius. S3 and S4 are still zero, but S1 and S2 now take the form:
ik3 SI = - (m - 1)Vf(9, $) 2r (2.6) ik3 S2 = - (m -1)Vf(,)cos 21
The form factor
f
depends on particle shape and varies with angle. For a homogeneous sphere,f= 3(sin u - u cos u) / u3, where u = 2x sin(O/ 2) and x = k a. From equation 2.3and the form factor for spheres, we again see that the scattered irradiance has X4 dependence and 1=o _ I=9o around 0= 180'. Therefore, Rayleigh-Gans scattering also exhibits minimal azimuthal asymmetry.
The Rayleigh and Rayleigh-Gans approximations are relatively simple descriptions of light scattering that are relevant for scatterers smaller than the wavelength or with small index mismatch m from the medium. These well describe scattering from smaller subcellular organelles in tissue. Numerous researchers use these models to describe scattering from biological samples9 10. Simple solutions to the direct problem lead to easy solutions to the inverse problem.
The Rayleigh and Rayleigh-Gans approximations provide relatively simple solutions to the inverse problem, but they do not describe a lot of interesting scattering effects from large particles. Since our primary interest is light scattering from cell nuclei
(diameter = 4 - 20um 1) that are significantly larger then visible light wavelengths (A =
400 - 700nm), we look for a formulation that relaxes the constraints on particle size and
index. The next step up in complexity is the solution to the direct problem of scattering from a homogeneous sphere of arbitrary size and index of refraction. In this section we will not present the equations for the S terms, since their complexity limits physical insight. Instead, we present numerical computations of scattering from spheres and discuss qualitative results relevant to our work. The matlab program for this was developed based on a code provided in Bohren and Huffman.
Scattering by a homogeneous sphere illuminated with a plane wave is described by Mie theory, named after Gustav Mie, who formulated the solution in 1908*. Mie theory is an exact solution of Maxwell's equations with boundary conditions defined by the sphere's surface. The solution has S3 and S4 equal to zero, but Si and S2 are infinite
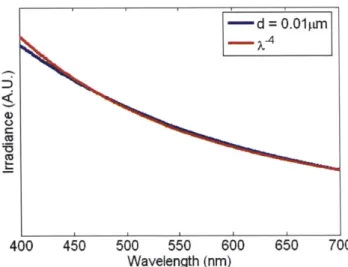
sums of Bessel functions. The important input parameters are the incident Stokes vector, diameter of the sphere d, m, A in the medium, 0, and . Figure 2.3 shows the elastic scattering irradiance spectrum at 0= 1800 from a sphere of diameter d = 0.O1pm and m =
1.05 over the visible wavelengths.
* It is debated whether Gustav Mie first solved the spheres scattering problem, but for historical
- d = 0.01 pm
400 450 500 550 600 650 700
Wavelength (nm)
Figure 2.3: Scattering from a d= 0.0 l1pm sphere and the X~4 dependence of scattering from small spheres predicted by the Rayleigh and Rayleigh-Gans approximations. Both spectra have been divided by their respective means for comparison.
As expected, Mie theory reduces to the Rayleigh approximation of equation 2.4 when d
<< A. For larger sizes, we see departure from the Z4 dependence of the small particle
approximations. Figure 2.4 shows the scattering spectrum with d= 1 Om.
400 450 500 550 600 650 700
Wavelength (nm)
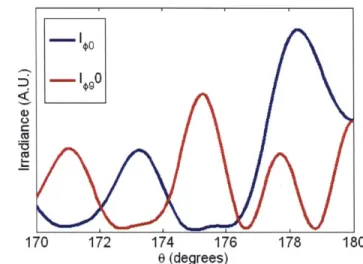
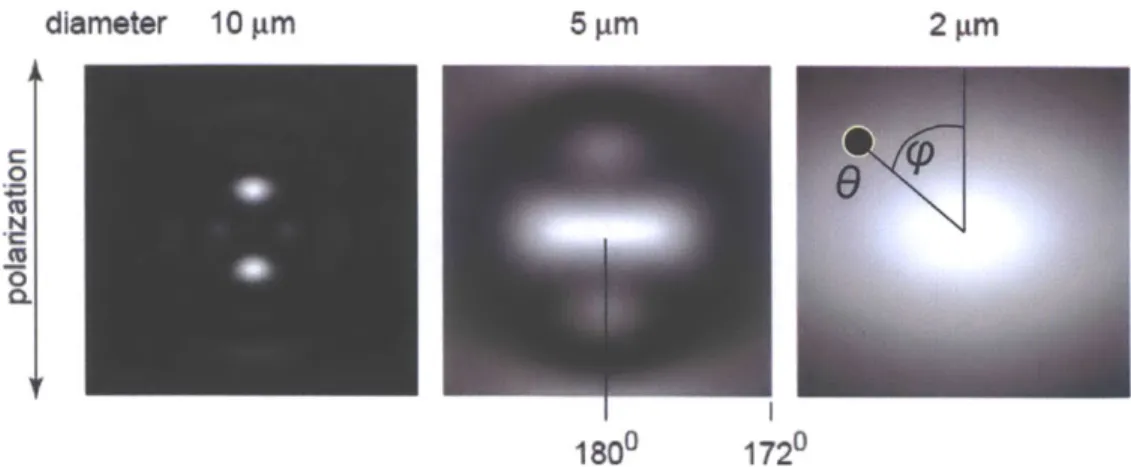
There are multiple orders of oscillation frequencies in the spectrum coming from the sum of Bessel functions. A fourier transform will reveal multiple peaks. Perelman et. al. observed that larger spheres scatter with higher oscillation frequency and used that phenomenon to identify scatterer size. Large particle scattering also exhibits azimuthal asymmetry. Figure 2.5 plots I4=o(o) and I4=9o(6) as functions of 0 at $ = 00 and
#=
900and a fixed wavelength A= 500nm. The incident illumination is linearly polarized.
1 0
C
170 172 174 176 178 180
0 (degrees)
Figure 2.5: Scattering from d= 10pm sphere and m = 1.05 at 2= 500nm, O= from 170* to 180*, and #= 0*
and 90*.
Unlike the Rayleigh and Rayleigh-Gans approximations, Mie theory shows that large
spheres exhibit azimuthal asymmetry near direct backscattering. A spectral plot about 9=
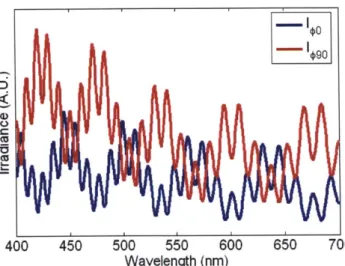
1 0
0)9
400 450 500 550 600 650 700
Wavelength (nm)
Figure 2.6: I=o and I9o at 6= 178* and m = 1.05 for d = 10pm sphere. The incident wave is linearly polarized.
Mie theory exactly describes scattering by a homogeneous sphere and can be used to solve the inverse problem, which we will demonstrate in chapter 4. It is our model of choice for inverting LSS spectra measured from tissue to extract the scatterer's parameters. However, scatterers in tissue can be aspherical and inhomogeneous. Accounting for these adds an element of asymmetry to the equations and leads to much more complex solutions. Also, sections 2.2 - 2.4 have only considered single particle scattering. Scattering from a collection of particles can potentially be much more complicated. In the next section, we argue for using Mie theory to describe scattering from tissue.
2.5 Scattering by a tissue-like collection of non-ideal particles
Sections 2.2 - 2.4 considered single particle scattering and arrived at Mie theory, which describes scattering by a homogeneous sphere illuminated by a plane wave. In human epithelial tissue and most biological systems, more then one particle is excited by
the illumination, and these particles are aspherical, inhomogeneous, and oriented in various configurations. Also, index of refraction changes may be continuous , but we will limit our analysis to discrete variations such as individual particles. A number of research groups have used Mie theory to model light scattering from biological samples1 3
14. This section provides physical justification for the use of Mie theory to describe elastic
light scattering from tissue and discusses some avenues for future research.
In a medium with only one particle, the illumination wave excites the particle and scattering occurs. When multiple particles are present, the illumination excites all the particles and all of them scatter. The scattered radiation can then excite further scattering by neighboring particles (multiple scattering). Also, scattered waves may interfere with each other before reaching the detector. Scattering by a collection of particles, even identical particles, can be quite complicated. Ideally, we want to be able to approximate the total scattering intensity from all particles by the sum of the scattering intensities from individual particles. We call this approximation single particle scattering. For this to be accurate, two conditions must be met: (1) particles must be sufficiently spaced such that scattered fields do not interfere with each other prior to reaching the detector; and (2) the total scattered field in any region of the sample is weak compared to the illumination field (weak scattering). In biological tissue, cell membranes are in contact with other cell membranes and all cells have numerous organelles, all of which scatter because they have different index of refractions than the surrounding media. However, criterion (1) can still be satisfied if interference between scattering fields from the tissue is averaged such that total field intensity is the sum of individual field intensities. Using incoherent excitation
light can accomplish this. Criterion (2) is satisfied when we selectively observe the SBS signals from epithelial nuclei, which are close to the surface. These scatterers have higher refractive index than other organelles and are important for cancer diagnosis s. To selectively observe SBS from epithelial nuclei, we must remove the effects of multiple scattering and diffuse reflectance from other epithelial organelles and lower tissue layers. To visualize this, consider the enlargement of the top layer of figure 2.1 (figure 2.7).
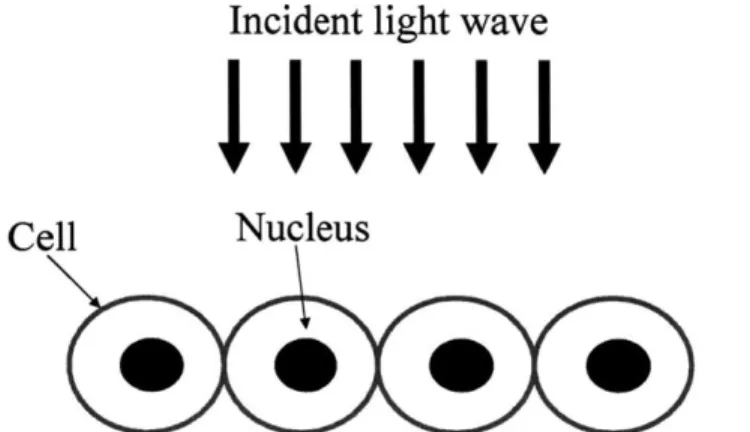
Incident light wave
Cell
Nucleus
Figure 2.7: Single elastic backscattering model of epithelial tissue.
Single backscattering, the key information for LSS, can only occur at the most superficial cell layers (epithelium). To comply with criterion (2), assuming the influences of scattered fields from non-nuclei organelles and lower tissue layers are removed, the singly scattered fields from epithelial nuclei must be much weaker than the illumination field throughout the epithelium. Large scatterers such as nuclei scatter predominantly in the forward direction, 0 = 00. Since forward scattering goes directly into the lower tissue layers, by our model of light scattering in tissue (figure 2.1), criterion (2) is satisfied. It is important to remove the effects of multiple scattering and diffuse reflectance because these scattered fields are comparable in intensity to the incident field. Chapter 3 discusses techniques to isolate SBS from tissue, which enable LSS.
We have justified using single particle scattering to describe SBS by a collection of epithelial nuclei. However, this does not necessarily support the use of Mie theory analysis, which assumes spherical and homogeneous scatters, because nuclei are in general aspherical and inhomogeneous. Here, we provide several justifications for approximating with a sphere. The primary goal of this research is to detect cancer, and two features of cancer are nuclear enlargement and hyperchromasia (higher index of refraction)5' Therefore, the scattering theory must account for size and index differences to enable solving the inverse problem. Mie theory has size and index dependence, but more advanced theories such as ellipsoid scattering may lead to more accurate inversion for the particle's shape. However, a theory of scattering by ellipsoids is much more complicated because an ellipsoid has 3 axes and 3 orientation angles, compared to just one diameter parameter for a sphere. In tissue, we measure SBS from a randomly oriented collection of aspherical particles. The effects of particle orientation are then averaged. Bohren and Huffman show that for a collection of randomly oriented cylinders, the total scattered field is similar to that from a collection of spheres. Another approximation made by Mie theory is homogeneity of index of refraction. In nuclei, DNA clumping can lead to heterogeneity. Chen et. al. used FDTD simulations to compute scattering from randomly inhomogeneous spheres16. They found that the
spectral dependence of the total scattering cross section (Csca) is very similar to that of a sphere with refractive index averaged over the volume. These results validate the use of Mie theory and the single particle approximation to solve the inverse SBS problem crucial to light scattering spectroscopy.