HAL Id: insu-00908707
https://hal-insu.archives-ouvertes.fr/insu-00908707
Submitted on 25 Nov 2013HAL is a multi-disciplinary open access
archive for the deposit and dissemination of sci-entific research documents, whether they are pub-lished or not. The documents may come from teaching and research institutions in France or abroad, or from public or private research centers.
L’archive ouverte pluridisciplinaire HAL, est destinée au dépôt et à la diffusion de documents scientifiques de niveau recherche, publiés ou non, émanant des établissements d’enseignement et de recherche français ou étrangers, des laboratoires publics ou privés.
Major role of shear heating in intracontinental inverted
metamorphism: Inference from a thermo-kinematic
parametric study
Sylvia Duprat-Oualid, Philippe Yamato, Pavel Pitra
To cite this version:
Sylvia Duprat-Oualid, Philippe Yamato, Pavel Pitra. Major role of shear heating in intracontinen-tal inverted metamorphism: Inference from a thermo-kinematic parametric study. Tectonophysics, Elsevier, 2013, 608, pp.812-831. �10.1016/j.tecto.2013.07.037�. �insu-00908707�
Major role of shear heating in intracontinental inverted metamorphism: Inference from a thermo-kinematic parametric study.
S. Duprat-Oualid1, *, P. Yamato1, 2 and P. Pitra1
1
Géosciences Rennes, UMR6118, Université de Rennes 1 & CNRS, 35042 Rennes, France
2
ETH-Zurich, Sonneggstrasse 5, CH-8092 Zurich, Switzerland *
corresponding author: sylvia.duprat-oualid@univ-rennes1.fr
Reference:
Duprat-Oualid, S., Yamato, P. and Pitra, P., 2013. Major role of shear heating in intracontinental inverted metamorphism: Inference from a thermo-kinematic parametric study.
Tectonophysics (in press), doi:10.1016/j.tecto.2013.07.037.
Abstract
Inverted metamorphism corresponds to the stacking of high-temperature metamorphic units structurally on top of lower-temperature units and is commonly observed along main thrusts in major orogens. Yet, in spite of many existing models, the origin and preservation of the metamorphic inversion in intracontinental collision belts is still debated. In this study, we use a crustal-scale 2D thermo-kinematic model in order to investigate the key parameters controlling the inversion of the geothermal gradient at crustal scale. Our results confirm that the kinematic framework strongly impacts the thermal evolution around the thrust. Erosion velocity and thermal conductivity of rocks are two parameters that control the spatial location of the thermal perturbation and the intensity of inversion, respectively. However, even in
extreme kinematic configurations, i.e., convergence velocities > 3cm.yr-1 and relatively high
thrust dip angles ~ 30˚, the thermal inversion is fleeting and thrust temperatures cannot reach the high temperature peak values characteristic of natural occurences (> 600˚C) if shear heating is not taken into account. Conversion of mechanical energy into heat represents a main contribution to the thermal budget along main crustal shear zones. It leads to high temperature conditions in the thrust zone and our results attest that it is the only process that allows the preservation through time of an intense thermal inversion. Our quantification shows that shear heating is much more efficient than other processes such as accretion and surface denudation and is compatible with the observations of inverted metamorphism in the Himalayan or Variscan belts, for example. This comparison with natural occurrences suggests that the formation and preservation of intracontinental inverted metamorphism require shear
zone viscosity values of the order of 1020-1021 Pa.s for convergence velocities between 1 and
Keywords: Inverted metamorphism; Shear heating; Numerical modelling; Thermal properties
1. Introduction and state of the art
An inverted metamorphic sequence is characterised by an upward intensification of metamorphism, typically an increase of the metamorphic peak temperature. Inverted metamorphism is mostly related to major thrusts, where convergence velocities are high. The major occurrences can be ascribed to one of three distinct geological contexts: (i) metamorphic soles beneath ophiolites (e.g., Williams and Smyth, 1973; Jamieson, 1986; Hacker, 1991; Abd El-Naby et al., 2000); (ii) oceanic subduction zones (e.g., Toksöz et al., 1971; Platt, 1975); (iii) major thrusts in continental collision (e.g., LeFort, 1975; Kohn, 2008). The present study is focused on the third geological setting. The best documented example is the inverted metamorphic sequence associated with the Main Central Thrust (MCT) zone in the southern Himalayas (e.g., Frank et al., 1973; LeFort, 1975; Sinha-Roy, 1982; Arita, 1983; Hubbard, 1989; Jain and Manickavasagam, 1993; Henry et al., 1997; Harrison et al., 1997, 1998, 1999; Caddick et al., 2007; Kohn, 2008), but other examples were described in the Variscan belt (Burg et al., 1984; Arenas et al., 1995; Štípská and Schulmann, 1995; Ballèvre et al., 2009; Pitra et al., 2010), in the Caledonian belt (Andreasson and Lagerblad, 1980; Mason, 1984; Watkins, 1985; Johnson and Strachan, 2006) or in the Appalachian belt (Camiré, 1995). The pressure and temperature conditions within such thrust zones attest to a medium pressure, medium-high temperature metamorphism. As an example, inverted metamorphic sequences in both the Himalayas and the Variscan belt have recorded peak temperatures between 500 and 700˚C and peak pressures between 8 and 11 kbar (e.g., Burg et al., 1984; Macfarlane, 1995; Guillot, 1999; Kohn, 2008; Pitra et al., 2010; Corrie and Kohn, 2011). Natural intracontinental metamorphic inversions are thus characterised by
inverted thermal gradients between 10 and 50˚C.km-1 (e.g., Kohn, 2008; Pitra et al., 2010).
been developed, most of them constrained by or aiming to fit data from the Himalayan belt (e.g., Jamieson et al., 1996, 2004; Henry et al., 1997; Bollinger et al., 2006; Kohn, 2008). They suggest two alternative hypotheses to explain the metamorphic inversion.
On the one hand, the inverted zonation is the result of a post-metamorphic deformation of a preexisting “normal” metamorphic sequence. This may result from late thrusts cutting through the initial metamorphic sequence (e.g., Brunel and Kienast, 1986), passive deformation of metamorphic isograds within a ductile shear zone (e.g., Jain and Manickavasagam, 1993; Grujic et al., 1996; Gibson et al., 1999) or crustal-scale folding (e.g., Searle and Rex, 1989; Stephenson et al., 2000).
On the other hand, the inverted zonation may result from a temporary spatial perturbation of crustal isotherms (LeFort, 1975; Peacock, 1987a; Jamieson et al., 1996, 2004; Burg and Schmalholz, 2008). In this hypothesis, metamorphism is synchronous with the deformation event. Some authors propose that inverted metamorphism occurs due to a diffusive heat transfer across the major thrust from the hotter upper unit to the colder subjacent unit (e.g., LeFort, 1975; Shi and Wang, 1987; England and Molnar, 1993). Particularly, the thermal inversion may be due to a “channel flow”, i.e., the extrusion of deep hot crustal rocks above a colder plate (e.g., Grujic et al., 1996; Jamieson et al., 1996, 2004). This model presents the advantage of reproducing the ranges of metamorphic pressures and temperatures characterising the outcroping sections of the MCT (Beaumont et al., 2001). However, it requires strong erosion localised on the thrust front and specific internal physical properties in terms of viscosity and angle of friction. Furthermore, it fails to reproduce some important metamorphic and geochronological records on both sides of the MCT (Kohn, 2008).
Beyond the first-order role of the kinematic framework and thermal diffusion, several studies have specifically focused on the contribution of radiogenic heat, including the
accretion of radioactive material across the active thrust, and on the role of erosion (Royden, 1993; Ruppel and Hodges, 1994; Huerta et al., 1996, 1998, 1999; Bollinger et al., 2006). Accretion models allowing the accumulation of highly radioactive material over a duration longer than 30 Myr can lead to significant increase of temperature within the hanging wall (e.g., Huerta et al., 1996, 1998). However, such studies involve disputable initial assumptions. As an example, the orogenic accretionary wedges of these models (e.g., Huerta et al., 1998) are deeply rooted at 30 to 60 km depths. Reasonable accretion velocities associated with lower, realistic erosion velocities lead to wedges several hundreds of kilometers wide at the surface. Outcrouping rocks across such wide zones should consequently be characterised by a continuous intense deformation and none of the known frontal thrusts displays a such configuration. Moreover, in most cases, strong accretion alone cannot reproduce the high temperatures observed in natural inverted metamorphic sequences. On the contrary, accretion leads to progressive cooling of the active thrust plane to steady temperatures lower than 400˚C at 30 km depth with no significant thermal inversion (Royden, 1993). Concomitant surface denudation characterised by an erosion velocity greater than the accretion velocity is necessary to raise the temperatures in the thrust zones (e.g., Royden, 1993; Bollinger et al., 2006).
In the absence of accretion processes, moderate erosion velocities can lead to thrust temperatures of the order of 600˚C and to the development of inverted isotherms comparable to those observed in natural inverted metamorphic sequences (Royden, 1993). However, these conclusions require a thrust activity lasting for more than 70 Myr and exhumation of ultra-high pressure metamorphic rocks from more than 100 km depth (Royden, 1993). Such implications are not compatible with natural cases where rocks recorded metamorphic peak pressures of 8 to 11 kbar. From a mechanical approach, erosion catalyses the development of main orogenic structures (e.g., Burg and Schmalholz, 2008), and some models highlight the
important influence of both the erosion and the exhumation on the thermal perturbation (e.g., Jamieson et al., 1996; Beaumont et al., 2004; Bollinger et al., 2006; Kohn, 2008).
The role of heat production by conversion of mechanical energy into thermal energy in a major shear zone (shear heating) was also considered to complete the thermal budget and the possible development of thermal inversion around a thrust (Minear and Toksöz, 1970; Toksöz et al., 1971; LeFort, 1975; Graham and England, 1976; Scholz, 1980; England and Thompson, 1984; Pavlis, 1986; Molnar and England, 1990; England and Molnar, 1993; Burg and Gerya, 2005; Burg and Schmalholz, 2008), but without real quantification. Kidder et al. (2013) specifically refute the importance of shear heating under high convergence velocity
(~10 cm.yr-1) and attribute the thermal inversion to accretion process.
The demonstration provided by Kidder et al. (2013) that shear heating is not a cause of inverted metamorphism in accretion domains is based on an oceanic subduction beneath an
active arc (Kidder and Ducea, 2006). The very high convergence velocity (~10 cm.yr-1) and
the high initial geothermal gradients characterising the overriding forearc (Kidder and Ducea, 2006) and the subducting oceanic plate easily and rapidly lead to intense thermal inversion.
With low shear heating (~10-5 W.m-3 implying very low viscosities of about 1017 Pa.s), heat
advection and conduction dominate the thermal budget: both the overriding plate and the slab are rapidly cooled and the subducting material is progressively and slowly heated. Consequently, the rocks accumulated in the accretion zone are representative of the thermal state of the thrust plane. Understandingly, the thermal peaks are thus colder from the top to the base of the accretion area and such thermal inversion is compatible with the thermochronologic data from the Pelona Schist of southern California (Kidder et al., 2013). Considering a stronger shear heating along the active thrust, which is superposed on the overall cooling pattern, decreases the thermal inversion intensity recorded in the accreted sediments. Nevertheless, such shear heating assumptions are not generally applicable because
very low shear stress and viscosities are involved to balance the high strain rate (10-12 to 10-11
s-1).
Previous studies of syn-deformational intracontinental inverted metamorphism used various models with very different degrees of complexity (e.g., Shi and Wang, 1987; England and Molnar, 1993; Jamieson et al., 2004). However, none of the proposed models is commonly accepted to give a general explanation to the development of syn-deformation inverted metamorphism. Whereas analytical studies provide good mathematical solutions for understanding the respective influence of kinematics and heat diffusion on the thermal evolution, the other factors involved (e.g., erosion, various heat sources, variable kinematic configuration, thermo-dependence laws) are difficult to address analytically but can be solved and quantified numerically.
In the present paper, our goal is not to fit a particular natural case (e.g., the Himalayas). Rather, using a systematic approach, we aim to explore and provide a detailed synthesis of the different conditions required for the formation and preservation of crustal-scale inverted metamorphism along one intracontinental thrust. We define and compare the relative importance of each one of the parameters and processes involved: kinematic setting, thrust geometry, erosion velocity, rock properties (in particular the thermal diffusivity), accretion velocity, radiogenic heat production and shear heating. The goal is to infer (i) the conditions required to locally invert the thermal field; (ii) the exact impact of each one of these parameters on the intensity, the location and the duration of the inversion and (iii) the conditions required to preserve the thermal inversion through time. Finally, we discuss how and why shear heating is crucial for the formation and preservation of inverted thermal gradients under realistic kinematic settings.
2.1. Initial setup
In order to test independently the influence of the various parameters and processes on the thermal evolution of a crustal thrust, a simple numerical model is defined in which each component can be controlled. The 2D-model setup (Fig. 1a) is focused on the first 80 km of a continental lithosphere, which includes a 30 km thick crust. In order to study the thermal evolution of a major continental thrust zone, a thrust cutting through the whole continental crust with a dip angle θ is simulated by imposing a velocity contrast between the downgoing
plate and the upper plate, moving with a velocity Vlp and Vup, respectively (Fig. 1). The
convergence velocity Vth is consequently given by Vth = Vlp + Vup. The thrust is mainly
represented by a straight segment, the dip angle of which, however, progressively decreases towards both the base of the crust and the surface in order to avoid any advection errors due to local strong velocity direction contrasts. Since the present study focuses on the slanted part of the thrust and because the temperature evolution around the thrust and in the deepest levels of the fault is not noticeably affected by the configuration of the lower block velocity field beneath the first 30 km (see Appendix A, Fig. A.1), the downgoing plate intentionally lies flat under the upper crust to simplify the boundary conditions and the isostasy computation.
The initial geotherm is defined in the whole model according to the following equation:
T(x,z,t0) =Tsurface+ z⋅ qbase
k + Tsource(x,z) (1)
where Tsurface, qbase, k and Tsource are the surface temperature, the mantle heat flux, the thermal
conductivity and the possible local heat sources, respectively. Initially, the only implemented heat source is the radiogenic heat production. It is considered as a permanent property of the
material and is defined according to the following decreasing exponential law from Turcotte and Schubert (2002): Q(z,t0) = Q0+ exp −z zr (2)
where Q0 is the surface radiogenic heat production, and zr corresponds to the length scale for
the decrease in Q with depth (Turcotte and Schubert, 2002) controlling the curvature of the vertical profile of Q. Eq. (2) allows to easily test a wide range of possible distributions of
radiogenic production and both parameters Q0 and zr, were independently tested. In the
presence of radiogenic heat sources, Eq. (1) is then only z-dependent and becomes:
T(z,t0) = Tsurface+ z⋅ qbase k + Q0⋅ zr 2 k ⋅ 1 − exp −z zr (3) 2.2. Computation methods
Both kinematic and thermal computations are based on a regular Eulerian grid with a space resolution of 1 km. During the thrust activity, at each time step, advection and thermal diffusion are realised separately in order to minimise the numerical diffusion of temperature inside a non-static environment by using the marker-in-cells method (Gerya, 2010). The advection of rock properties and temperature is ensured by a field of initially randomly distributed particles (see Appendix A for more details). Three kinematic parameters can be distinguished here (Fig. 1b). The first one is the burial velocity Vb of the downgoing plate
The second parameter defines the vertical accretion velocity a. As in previous studies (e.g., Royden, 1993; Huerta et al., 1996, 1998, 1999), accretion is realised at each time step by adding a horizontal velocity component a’ (Fig. 1b) in the whole model so that both the active thrust position and the convergence velocity remain fixed. Both parameters are related according to:
a’ = a · tan(θ) (5)
The third kinematic parameter corresponds to the maximum erosion velocity Ve linked
to the upper plate velocity Vup by the following equation:
Ve = Vup · sin(θ) (6)
The erosion velocity Ve controls the upper plate velocity Vup in the models (Fig. 1b, see
Appendix A for more details).
Compared to the tectonic advection times, the isostatic balance is reached instantaneously (Crough, 1977). Thus, at each time step, the isostatic response is calculated in the entire model thereby producing a realistic topography associated with the thrust.
Then, for the thermal part, the following heat equation is solved by using the implicit finite difference method on the Eulerian grid. In order to limit numerical diffusion, the Eulerian computation is coupled with intermediate thermal interpolations with the Lagrangian particles (see Appendix A for more details):
The heat equation (Eq. (7)) is composed by a heat diffusion part where ρ, Cp and k are respectively the density, the heat capacity and the thermal conductivity (left side of Eq. (7)) and by a heat production part (right side of Eq. (7)) where Q and Hs represent the radiogenic heat production and the shear heating, respectively.
The parameters ρ, Cp, and k define the capacity of the material to diffuse heat. This property can be reduced to one parameter, the thermal diffusivity κ, defined as κ = k/(ρ.Cp). Each one of these three parameters depends on the lithology, but also on the physical environment of the rock (e.g., pressure, temperature). Various empirical laws describe the temperature and pressure dependence of these parameters in rocks (e.g., Zoth and Hänel, 1988; Seipold, 1995, 1998; Abdulagatov et al., 2006; Hofmeister, 2007; Whittington et al., 2009). In the present study, we tested independently the influence of a range of realistic values for each parameter on the thermal evolution around the thrust (see Table 1). First, these values were considered constant in the crust and in the mantle. In a second time, their temperature and pressure dependence is considered and their influence on the thermal field investigated. These results are discussed in section 3.3.2.
Shear heating Hs results from the transformation of mechanical energy into heat during deformation and is recognised as a major component of the total energy budget (e.g., Brun and Cobbold, 1980; Lachenbruch and Sass, 1980; Chester et al., 2005). Shear heating is
a function of the strain rate and stress tensors ( ij and σij respectively) and is computed
according to the following equation:
The strain rate tensor is defined as ij = 0.5 [(∂Vi/∂j) + (∂Vj/∂i)] where ∂Vi/∂j corresponds to the variation of the velocity of the component i in the direction j and the same
convention applies for ∂Vj/∂i. Because shear zones related to inverted metamorphism can be
several kilometres thick (e.g., Grugic et al., 1996), ductile rheology is generally attributed to the whole thrust (e.g., Searle and Rex, 1989; Jamieson et al., 1996; Kidder and Ducea, 2006). In the present study, the shear zone thickness is space resolution dependent and is thus approximately of about 1 km. Shear heating is computed in a ductile manner, where stress and strain rate are linked by the effective viscosity η of the material constituting the thrust:
σij = 2⋅ η⋅ ˙ ε ij (9)
Viscosity depends on temperature, strain rate and creep parameters (e.g., Goetze and Evans, 1979; Carter and Tsenn, 1987; Ranalli and Murphy, 1987). It tends to decrease with increasing strain rate and temperature (Meissner and Mooney, 1998). Inversely, both the rock deformation and the associated shear heating depend on the viscosity (e.g., Burg and Schmalholz, 2008; Hartz and Podladchikov, 2008). However, in order to better define the first order role of viscosity, we simplified the problem by using a constant viscosity η all within the thrust (see discussion in section 3.4).
3. Model results
3.1. Burial velocity effects
In order to test the validity of our numerical model, we first realised a comparative study with analytical solutions from England and Molnar (1993). The results are described in Appendix B.
In extreme kinematic configurations (e.g., Vth = 5 cm.yr-1, θ = 30˚), which favour the development of thermal inversion, the thermal evolution around the thrust and in the whole model can be best characterised. In this case, because the initial geotherm is linear, the thermal inversion starts on a large part of the thrust with a relatively homogeneous intensity. Then, the affected area progressively deepens and widens and the maximum intensity is localised towards the deepest levels of the thrust. On each point of the thrust, the vertical temperature gradient ∂T/∂z first decreases, reaches a minimum value (negative when thermal inversion occurs) and then increases again until a steady state when the temperature advection and the heat diffusion are completely balanced. Nevertheless, even under such extreme
kinematic settings, none of the (Vth, θ) combinations allows the preservation of the thermal
inversion in time beyond the first 6 Myr (see Appendix B, Fig. B.2).
3.2. Erosion effects
In our model, erosion can be activated and is only controlled by the erosion velocity
Ve (Eq. (6), Fig. 1 and Table 1). In this case, contrary to the previous analysis (section 3.1,
Appendix B), the thrust velocity Vth is given by a combination of the lower and the upper
plates velocities (Vlp and Vup, see Fig. 1b). Consequently, in order to test the influence of the
erosion velocity independently of the kinematic setting, either the downgoing plate velocity
Vlp or the thrust velocity Vth have to be fixed. Here, we chose to keep constant the thrust
velocity Vth for two reasons. (i) Kinematic simulations having the same vertical component Vz
of the thrust velocity (Fig. 1b) are characterised by very similar thermal evolutions (see
Appendix B). Each given Vz value corresponds to a group of (Vth, θ) combinations. This
allows us to easily make connections and distinctions between the thermal evolution around the thrust and, on the one hand, the erosion velocity, and on the other hand, the convergence velocity and the thrust dip angle. In comparison with the MCT in the Himalayas which is
characterised by a high downgoing velocity of the Indian plate of ~ 2 cm.yr-1 for the last 10 to 20 Myr (e.g., Bilham et al., 1997; Lavé and Avouac, 2000) and a dip angle of ~ 15 ̊ (e.g.,
Kaneko et al., 2003), Vz values of the order of 0.5 cm.yr-1 are realistic and greater values are
excessive. (ii) A further parametric analysis concerning the shear heating (section 3.4) takes into account the velocity contrast on the thrust as a major parameter. Controlling the thrust velocity instead of the downgoing plate velocity is thus more practical to compare the combined effects of the kinematic setting, the erosion velocity and the shear heating. The distribution of the velocity field on both sides of the thrust can be described as the ratio between the erosion velocity Ve and the vertical component Vz of the thrust velocity (see Fig. 1).
Erosion and motion of the upper plate, for a constant Vth, does not lead to significant
variations of the reached intensity (Fig. 2a) and of the thickness of the affected area (Fig. 2b) of the thermal inversion during the thrust activity. However, it strongly influences its space and time locations. Increasing erosion and hence displacement of the upper plate tends to localise the thermal inversion at shallower depths along the thrust (Fig. 2). Taking out crustal material by erosion leads to progressive cooling of the remaining shallowest material controlled by surface thermal conditions. The maximum thermal inversion intensity is not restricted to the base of the slanted part of the thrust but moves to the surface with increasing erosion velocities. However, because erosion velocities are not sufficiently high to efficiently balance the thermal diffusion, even for extreme cases, thermal inversion cannot occur at very superficial levels along the thrust.
The time of maximum inversion is not significantly changed, even if a slight delay can be noticed. The duration of the thermal inversion is widely extended with erosion. However, if for extreme kinematic and erosion values thermal inversion can be preserved until the
steady state, the most realistic kinematic setting tested (corresponding to Vz = 0.5 cm.yr-1) never leads to a thermal inversion, whatever the applied erosion velocity (Fig. 2).
Hence, when the displacement along the thrust is entirely ensured by the downgoing plate (Ve = 0), temperature on each point along the thrust is continually decreasing until the
steady state. When the upper plate velocity Vup approximates the lower plate velocity Vlp, (i.e.,
Ve ≈ 0.5Vz), the thermal evolution along the thrust tends to be reversed. Thus, for Ve > 0.5Vz,
temperature at a given point of the thrust starts to increase in the beginning of the thrust activity (Fig. 2a, case Ve = 2Vz/3) due to the fast exhumation of the deep hot portions of the upper plate. This trend increases with the vertical component Vz of the thrust velocity. After reaching a local temperature peak, maximum thermal inversion is quickly reached and the temperature along the whole thrust decreases until the steady state. Actually, the thrust profile flattening in depth limits the temperature increase because the deepest rocks involved in the thrust come from the base of the upper continental block and cannot thus be hotter than the initial Moho temperature.
To summarise, erosion tends to localise the thermal inversion towards shallower depths of the thrust and significantly increases the thermal inversion duration. Nevertheless, it does not affect the intensity and the thickness of the thermal inversion. Furthermore, even in extreme cases, the initial temperature increase on the thrust is limited (maximum 25˚C) and is far from sufficient to account for the high temperatures known in major thrust zones associated with inverted metamorphism.
3.3. Rock properties effects
In the lithosphere, conduction is generally the predominant heat transport mechanism ahead of convection and radiation (Lachenbruch and Sass, 1980; Abdulagatov et al. 2006). As shown previously in section 2.2, ρ, Cp and k constitute the three rocks properties involved in
the heat diffusion equation. Moreover, as defined by Eq. (3), the initial geotherm in the lithosphere is not only controlled by k and the radiogenic heat sources, but also by the basal
mantle heat flux qbase. These thermal parameters are here considered independently and the
impact of the radioactive character of the crust on the thermal evolution around the thrust is also discussed.
3.3.1. Heat diffusion properties and the mantle heat flux
The ranges of realistic values (Table 1) for each thermal parameter depend strongly on
the lithology. On the one hand, the k values are generally comprised between 2 W.m-1.K-1 and
4 W.m-1.K-1 (Clauser and Huenges, 1995; Turcotte and Schubert, 2002). This high degree of
variability of more than 100 % proportionally controls the thermal diffusivity κ with the same order of magnitude. On the other hand, the heat capacity Cp varies up to ~ 50 %, from 800 to
1200 J.kg-1.K-1 (Waples and Waples, 2004), involving maximum differences for κ of ~ 30 %.
Depending on the lithology, the crustal rock density ρ varies from ~ 2400 kg.m-3 for
sedimentary rocks to ~3300 kg.m-3 for basic eclogites as an extreme case, but is generally
comprised between 2500 and 3000 kg.m-3 with an associated variability of ~ 20%. Heat
diffusion is therefore mainly controlled by the variation of thermal conductivity, and the influence of the variations of density and heat capacity are less significant (see Appendix C, Fig. C.1). This has two reasons:
First, the hotter is the geotherm (obtained for a low thermal conductivity in the crust or a high mantle heat flux), the higher is the thermal inversion (Fig, 3a, c). The basal heat flux,
qbase, only involved in the initial and boundary conditions, influences the intensity of the
thermal inversion proportionally to the magnitude of its variability. For example, between
qbase = 20 mW.m-2 and qbase = 40 mW.m-2, the initial thermal gradient is two times higher and
Proportionally to a qbase increase, the intensification of the inversion with decreasing k is more
significant. From k = 3 to 2 W.m-1.K-1, the thermal inversion is approximately two times
higher (Fig. 3a). Thus, the initial thermal structure of the lithosphere, defined by the
distribution of both qbase and k, constitutes a key parameter controlling the intensity reached
by the thermal inversion. Nevertheless, the location of the inversion, both in space and time,
is mostly insensitive to either qbase or k (Fig. 3).
Second, the strong correlation between κ and k leads the latter to strongly influence the heat diffusion through the thrust. A low thermal conductivity decreases the heat diffusion and thus favours thermal inversion during thrusting. For this reason, the influence of both k and
qbase on the thermal evolution around the thrust is different (Fig. 3). A decrease of k induces a
more significant intensification of the inversion than an increase of qbase (Fig. 3a, c).
Furthermore, contrary to the intensification of the basal heat flux, a decrease of k induces a widening of the thrust part affected by the inversion, a thickening of the area where the thermal inversion occurs (Fig. 3b, d) and a continuation in time of the thermal inversion (Fig. 3).
3.3.2. Temperature and pressure dependences
Thermal properties also vary as a function of temperature and pressure. Various experiments have been realised and some empirical laws have been proposed in order to define the thermal dependence of the thermal conductivity k (Zoth and Hänel, 1988; Horai and Susaki, 1989; Clauser and Huenges, 1995; Seipold, 1998; Voosten and Schellschmidt, 2003; Abdulagatov et al., 2006; Whittington et al., 2009) and heat capacity Cp (Waples and Waples, 2004; Whittington et al., 2009). Generally, with increasing temperature, k decreases, whereas Cp increases. Conversely, thermal conductivity tends to increase with increasing pressure (Horai and Susaki, 1989; Seipold, 1992, Kukkonen et al., 1999; Osako et al., 2004;
Abdulagatov et al., 2006; Hofmeister, 2007). However, the pressure effect is limited compared to the influence of temperature (Abdulagatov et al., 2006).
The reported variation of each thermal property as a function of temperature and pressure lies within the range of constant values tested in our numerical simulations (Table 1). Only the variability of k has a significant impact on the thermal evolution around the thrust. However, k depends on both the lithology and the physical environment, and this impact is difficult to quantify. Indeed, in spite of the numerous laboratory experiments (e.g., Čermák and Rybach, 1982; Osako et al., 2004; Abdulagatov et al., 2006), none of the proposed empiric laws (Zoth and Hänel, 1988; Clauser and Huenges, 1995; Seipold, 1998; Voosten and Schellschmidt, 2003; Abdulagatov et al., 2006; Whittington et al., 2009) appears to be undisputable (Fig. 4). Diverse equations relative to the same lithology appear inconsistent with one another (Fig. 4c, d). Furthermore, they are associated with large uncertainties (e.g., Seipold, 1998, Fig. 4a) and rarely integrate both temperature and pressure dependences in the same time (Kukkonen et al., 1999; Abdulagatov et al., 2006).
Regarding only the vertical distribution of the theoretical lithologies (after Turcotte and Schubert, 2002), the thermal conductivity increases from the superficial levels (sediments) to the mantle rocks. On the other hand, within each lithology, k decreases significantly with temperature (and hence depth; Fig. 4). This progressive drop may reach 30-50 % from 0 to 600 ˚C. Concerning the pressure influence, k increases with depth in the shallowest crustal levels due to the reduction of the pore volume (Abdulagatov et al., 2006). Beyond ~ 100 MPa, k tends to reach a linear behaviour (Horai and Susaki, 1989; Clauser and Huenges, 1995; Abdulagatov et al., 2006), and is supposed to evolve following the thermo-dependence law appropriate for the considered lithology.
To sum up, within the range of realistic values, both Cp and ρ have negligible effects on the thermal evolution of the lithosphere, and the diffusive transport of heat is controlled by
the variability of k. The temperature and pressure dependences do not change the order of variability, but they can lead to different thermal behaviours inside the lithosphere (Maierová et al., 2012). In particular, the dependence of the k value on temperature for a given lithology and pressures > 100 MPa favours the thermal inversion in depths. These physical and lithologic dependences are generally not taken into account in the numerical models although the values allocated to the thermal conductivity have to be considered with caution (Nabelek et al., 2010).
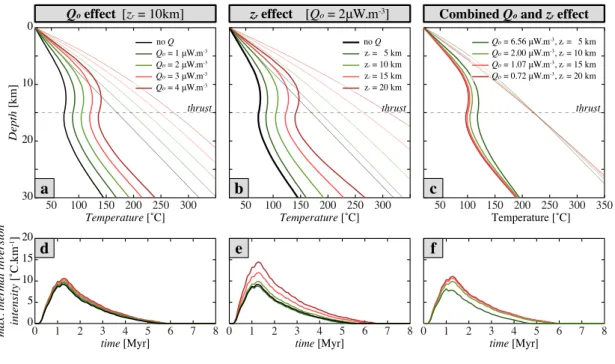
3.3.3. Radiogenic heat production
As for the heat diffusion properties (section 3.3.1, Appendix C), numerical simulations
were realised in an extreme kinematic context (Vth = Vlb = 5 cm.yr-1 and θ = 30˚) in order to
quantify the effect of the radiogenic heat production. They show that although the radiogenic heat production contributes to the initial geothermal profile, it does not influence the thermal inversion around the thrust in terms of intensity and localisation (Appendix C, Fig. C.2).
The previous analysis revealed that the burial velocity, the erosion velocity and the thermal conductivity of rocks are the main parameters controlling the thermal evolution
around a crustal scale thrust. Nevertheless, considering realistic kinematic settings (Vth < 3
cm.yr-1), none of these parameters allows the preservation of an established thermal inversion
in time.
3.4. Shear heating effects
Shear heating constitutes a part of the conservation of energy and a study of the thermal evolution around a thrust during its activity requires to take into account the relative displacement between the two crustal blocks as a source of heat (Toksöz et al., 1971; Brun and Cobbold, 1980; Pavlis, 1986). By considering shear heating in the viscous way, two
parameters have to be examined: the strain rate and the effective viscosity η within the thrust (section 2.2, Eq. (8) and (9)). Since the velocity field is not mechanically computed in our numerical models but imposed, both and η can be considered independently. The initial kinematic conditions used here are based on realistic cases for continental collision: the maximum dip angle θ of the thrust set to 15˚ and the velocity thrust values between 1 and 3
cm.yr-1, implying strain rates from 3.10-13 to 10-12 s-1.
In rocks, viscosity is temperature- and strain rate-dependent. Considering an
undeformed crust, the viscosity field is characterised by a decrease from ~ 1025 Pa.s in the
cold upper crust to ~ 1021 Pa.s in the hot lower crust (e.g., Burg and Gerya, 2005). The
interdependence of strain rate and viscosity tends to a steady state and, as an example, with a
convergence velocity of 2 cm.yr-1, the viscosity drops to values of 1019 to 1021 Pa.s within
major shear zones (Burg and Gerya, 2005). Consequently, we chose to apply this range of viscosity values, constant in time and space along the thrust. In our kinematic models, the strain field is only localised along the thrust (Fig. 1) thus limiting the frictional heat production to the shear zone. In order to highlight the effects of shear heating, no additional heat source is taken into account, and the erosion is not considered so that the downgoing plate only ensures the displacement along the thrust.
The theoretical amount of heat produced (Eq. (8)) along the thrust is very sensitive to
even small variations of viscosity (Fig. 5c). Considering the lowest viscosity (η = 1019 Pa.s)
and strain rate ( = 3.17 . 10-13 s-1), the resulting frictionnal heat produced (Hs ≈ 4 µW.m-3) is
of the same order of magnitude as the maximum realistic radiogenic heat production (Table 1). A viscosity increase induces a proportional increase of shear heating along the thrust. For
example, an increase of 100.25 Pa.s will typically result in an elevation of ~ 100.25 = 178 % of
the produced heat (Fig. 5c). This way, (i) shear heating can efficiently balance the diffusive cooling of the overriding plate. For high viscosity values, the thermal gradient above the
thrust can be elevated beyond the initial crustal geotherm. Consequently, if the heating produced by shearing becomes higher than the cooling driven by the underthrusting of cold material, the surface heat flow at the top of the upper block increases during thrusting (Hartz and Podladchikov, 2008). (ii) The thermal budget at the top of the downgoing crust has two sources: the transfer by diffusion of the heat inherited in the upper block and the shear heating along the thrust. Consequently, in presence of shear heating, the maximum thermal perturbation appears and develops under the thrust, whereas it straddles the thrust when shear heating is not considered (Fig. 5a, b).
As shown in Fig. 6, the amount of heat produced by shearing leads to an intense thermal inversion characterised by a significant thickening of the area affected and to a long duration. Unlike the other situations considered, shear heating allows the preservation of the
thermal inversion in time until the steady state under realistic kinematic settings (Vth = 1-3
cm.yr-1; Fig. 5b and 6).
Thermal inversion intensities, even at shallow depths, can exceed 100˚C.km-1 and
temperatures extend up to more than 1000˚C (Fig. 7). Both ranges of temperatures between
500 and 700˚C and of thermal inversion intensities from 10 to 50˚C.km-1 are reached between
20 and 30 km depth for different combinations of viscosity and convergence velocity (Fig. 8). Consequently, shear heating alone can reproduce and preserve in time thermal features comparable to natural occurences of inverted metamorphic sequences. Furthermore, our model suggests that, in these cases, viscosity values within the thrust zone have to range
between 1020 to 1021 Pa.s (Fig. 8).
In short, for small variations of viscosity or strain rate across a thrust (constant width of the sheared area), the thermal inversion is strongly influenced by shear heating in terms of intensity, space and time location. Although shear heating does not necessary imply an inversion, it plays a major role in the preservation of the perturbation in time.
3.5. Shear heating, accretion and radiogenic heat production competition
Accretion processes were implemented while keeping shear heating in action along the active thrust. As previously, the thrust dip angle θ was set to 15˚. The convergence
velocity Vth was fixed at 2 cm.yr-1 and no erosion process was considered. The vertical
accretion velocities a tested were 1 and 2 mm.yr-1 and are comparable to the values used in
previous works (Royden, 1993; Huerta et al., 1996, 1998, 1999; Bollinger et al., 2006; Kidder et al., 2013). In order to evaluate the thermal influence of accumulation of radioactive
material in the accretion prism, an elevated accretion velocity (a = 2 mm.yr-1) was considered
and two radiogenic profiles (Eq. (2) and (3)) characterised by a common surface radiogenic
heat production Q0 = 2 µW.m-3 but differing in the specific depth zr were tested : (i) a realistic
configuration with zr = 15 km and (ii) an extreme case with zr = 30 km such that the whole
continental crust is highly enriched in radioactive elements. Mantle flux was adapted to each thermal configuration in order to ensure a realistic initial temperature at the base of the crust between 420 and 500˚C.
Results are synthesised in Fig. 9 in terms of maximum thermal inversion intensity and maximum temperatures reached in the thrust zone after the thermal steady state is attained. Whether we take into account accretion and radiogenic heat production or not, no significant
thermal inversion occurs if the viscosity η is lower than 1020.25 Pa.s. Low viscosity implying
low amounts of shear heating (Eq. (8) and (9)), it follows that, in the framework of realisitc kinematic and thermal settings, it is impossible to reproduce metamorphic inversions comparable to natural observations by considering accretion processes only. Conversely, if η
exceeds 1021 Pa.s, temperatures and geothermal gradients within the thrust zone are
the range of viscosities leading to realistic thermal inversions is relatively narrow, of the order
of 1020 to 1021 Pa.s (Fig. 8 and 9).
The concomitance of accretion and shear heating implies that material previously deformed and warmed within the thrust zone is accumulated in the hanging wall while subjacent volumes are in turn sheared and heated. For low amounts of shear heating, upward heat transfert by accretion leads to a smaller pertubation on the geothermal gradient around the active thrust (Fig. 9a) and no change in the maximum temperatures (Fig. 9b). Conversely, when shear heating is significant, accretion of hot material efficiently reduces the heat diffusion from the thrust zone to the overriding plate. Thermal inversion in the active thrust zone is consequently more intense and this trend is more pronounced in depth. However, because the material heated in the shear zone is continuously moved upwards out of the active shear zone, the maximum temperatures are significantly lower (e.g., about 50˚C lower with a
2 mm.yr-1 accretion velocity and η = 1020.5 Pa.s. and almost 100˚C lower with a 1 mm.yr-1
accretion velocity and η = 1020.75 Pa.s.) (Fig. 9b).
Accretion of radioactive material associated with shear heating has no significant effect on the maximum intensity of thermal inversion, even if extremely radioactive crustal material is considered (Fig. 9a). Because the top of the downgoing plate is highly radioactive, the maximum temperatures reached along the thrust are obviously hotter than without radiogenic heating.
In short, whatever the accretion velocity or the radiogenic heat production, even in extreme cases, none of these processes can lead to thermal inversion without shear heating in the framework of realistic kinematic and thermal settings. Furthermore, maximum thermal features in the thrust zone are more influenced by small viscosity variations than by high changes of the accretion velocity and of the amount of radiogenic heating.
3.6. Shear heating and erosion
On the one hand, surface denudation enhances the localisation of the thermal inversion at shallower depths and can lead to increased temperatures along the thrust (see section 3.2). On the other hand, shear heating strongly influences the crustal thermal budget and highly intensifies the thermal inversion (see sections 3.4 and 3.5). Consequently, numerical simulations taking into account both processes are necessary to complete our parametric study (Fig. 9). Here again, tests were performed with a thrust dipping 15˚ and a convergence
velocity Vth of 2 cm.yr-1. Accretion and radiogenic heat production were switched off.
Viscosities ranged between 1019 and 1021 Pa.s and erosion velocity was set to Ve = 2 mm.yr-1.
This results in 38% of the thrust velocity Vth being ensured by the upper plate velocity Vup.
When the hanging wall velocity partially ensures the convergence (i.e., erosion is taken into account), maximum temperatures attained in and along the thrust zone are
significantly rised (Fig. 9b). As an example, at 20 km depth, a 2 mm.yr-1 erosion velocity
induces an increase of the maximum temperature of 80˚ for η = 1020.25 Pa.s, of 110˚ for η =
1020.5 Pa.s and of 140˚ for η = 1020.75 Pa.s. This thermal jump increases with the viscosity.
More generally, the maximum temperatures recorded along the thrust for a such erosion
velocity (Ve = 2 mm.yr-1) show an increase of 10 to 18% at 30 km depth, of 20 to 25% at 20
km depth and 19 to 32% at 10 km depth.Thermal influence of erosion is thus significantly intensified when shear heating is important, whereas it is almost negligible at low frictionnal heat production. However, if exhumation of the overthrusting rocks favours the thermal raise, its influence is inconsiderable with regard to the thermal perturbation intensity (Fig. 9a).
Erosion velocities greater than 2 mm.yr-1 yield similar results and follow the same trend.
To sum up, concomitance of erosion processes with shear heating along a major thrust in realistic configurations (i.e., Ve < Vb) does not lead to significant variations in the
maximum thermal inversion intensity. But the maximum temperatures reached along the thrust are highly increased by several tens of degrees.
4. Discussion and conclusions
Through the present parametric study, we tested and compared the relative influences of the different processes and parameters involved in the thermal evolution in space and time of the continental crust around a major thrust zone:
(i) the kinematic configuration of the thrust, i.e., the thrust dip angle, the
convergence velocity, and the distribution of the thrust velocity on both sides of the shear zone (expressed here as the erosion velocity);
(ii) the thermal rock properties controlling the heat diffusion across the rocks,
i.e., the thermal conductivity, the heat capacity and the density;
(iii) the heat sources, i.e., the basal mantle flux, the internal radiogenic heat
production, including the accretion of radioactive material, and the mechanical energy converted into heat along the thrust during its activity (shear heating).
The initial kinematic configuration plays a major role. Whereas the thermal perturbation around the thrust increases in depth with increasing burial velocity of the downgoing plate, erosion localises the perturbation towards shallower depths of the crust and significantly increases its duration. However, for identical convergence velocities, any changes in the erosion velocity do not impact the intensity and the thickness of the thermal inversion contrary to the thermal conductivity. Nevertheless, whereas a limited and transient thermal inversion can be achieved in extreme kinematic configurations, inversion is never observed in the range of reasonable (reported from nature) values of these parameters. Among
all the processes and parameters tested, only shear heating allows the preservation of an intense thermal inversion through time under realistic kinematic schemes.
4.1. The thermal conductivity problem
The thermal conductivity, in the range of realistic values (i.e., between 2 and 4 W.m
-1
.K-1), has a major influence on the heat transfer by diffusion and on the initial geothermal
gradient. Consequently, it strongly influences the local thermal gradient during the thrust activity, and when thermal inversion occurs, the intensity of this perturbation (Appendix C). As a rule, the initial thermal structure of the lithosphere is an important parameter to take into account in the models. However, tests comparing the thermal evolution of crusts with an identical initial temperature field but different thermal conductivities (the slope of the initial geotherm is thus balanced by the amount of mantle heat flux) attest to the significant effect of
k on the intensity and duration of the thermal inversion (Appendix C).
Whereas the thermal conductivity (or thermal diffusivity) is generally considered to be constant in numerical models, it strongly depends on both the lithology and the physical environment, more particularly the temperature. The choice of the k values (Nabelek et al., 2010; Maierová et al., 2012) and corresponding empirical laws chosen in the numerical thermal models are capital and can lead to significant differences of the thermal behaviour of the lithosphere. For pressures higher than 100 MPa, the pressure effect is negligible and the
thermal influence dominates with a strong decrease of k of ~ 1 W.m-1.K-1for temperatures
ranging from the surface to the base of the crust. Empirical thermo-dependence laws for various rock types were developed for atmospheric pressures. Empirical laws describing the evolution of k as a function of temperature under pressures higher than 100 MPa should give a better estimation of the thermal conductivity field in the crust for a given lithology. Furthermore, metamorphic reactions occurring along and across the thrust, the varying
amount of fluids in the rocks and the possible associated chemical changes linked to their circulation and/or chemical diffusion have also an impact on the evolution of the thermal conductivity of a given rock. These parameters are difficult to integrate in the models at present, but may have significant effects.
4.2. Shear heating, the key parameter
Shear heating, as defined in this paper and in the majority of other numerical models, considers that the whole energy required to overcome the fault friction is converted into thermal energy. However, this is a simplification and other energy transfers should be taken into account and their influence on the formation and preservation of the inverted thermal gradient tested. (i) The energy dissipated during a continuous deformation is not entirely converted into heat but can also be used to change the physical properties of the rock inside the sheared area (e.g., the rock microstructure; Brun and Cobbold, 1980). (ii) Metamorphic reactions occurring within and astride the shear zone can significantly consume or release heat (Oxburgh and Turcotte, 1976; Anderson et al., 1978; DeVore, 1983; Peacock, 1987a, b, 1990). (iii) Potential strain and gravitational energy (Kanamori and Rivera, 2006) can be transformed into pressurisation heat without displacement along the fault. Although these aspects should be taken into account in order to refine the general picture, they are not expected to modify the first-order message delivered by the modelling presented here.
Indeed, our results show that without shear heating, the occurence of thermal inversion requires extreme kinematic configurations (e.g., Kidder et al., 2013), is systematically transient (a few million years) and the inversion paroxysm is reached astride the thrust. In such a case, in order to preserve the trace of the thermal inversion in metamorphic parageneses (i.e., to avoid that any other metamorphic event significantly overprints the inverted record), exhumation of the whole sequence needs to be initiated during
the short period of time concerned by the inversion (some Myr) and to be extremely fast with a very high associated erosion velocity. On the other hand, under realistic kinematic
configurations for intracontinental thrusts (up to 3 cm.yr-1), shear heating is the only
parameter which allows the preservation of the thermal inversion in time until the thermal steady state. It also significantly influences the spatial location and extent of the thermal inversion: (i) frictionnal heating along the thrust causes the localisation of the inversion area under rather than astride the thrust, within the uppermost levels of the lower plate, and (ii) the more frictionnal heat is produced, the thicker is the area affected by the thermal inversion leading to inversion zones up to tens of kilometers thick. The amount of heat produced depends on the local strain rate and the shear zone viscosity (Eq. (8)). The values of both parameters, and particularly the effective viscosity, strongly influence the crustal scale thermal perturbation, especially in terms of thermal inversion intensity.
The present study attests that shear heating is the key-parameter and allows to reproduce thermal features coming from natural inverted metamorphic sequences (Fig. 8). Both the high metamorphic peak temperatures (500-700˚C at 8-11 kbar; e.g., Guillot, 1999; Pitra et al., 2010; Corrie and Kohn, 2011) and the thermal inversion intensities (generally
comprised between 10 and 50˚C.km-1; e.g., Kohn, 2008; Pitra et al., 2010) can be reproduced.
In parallel, our results suggest that the development and preservation of such inverted metamorphic zoning in realistic kinematic and thermal setting requires that the viscosity of
the material involved has to be between 1020 and 1021 Pa.s.
4.3. Applicability to the Himalayan inverted metamorphism
The MCT in the Himalayas is characterised by a dip angle of 15˚ (e.g., Kaneko et al.,
2003) and a downgoing velocity of the Indian plate of 2 cm.yr-1. (e.g., Bilham et al., 1997;
650˚C and pressure peaks are of 8 to 11 kbar (e.g., Macfarlane, 1995; Guillot, 1999; Corrie and Kohn, 2011), corresponding to depths of about 30-40 km (assuming that these pressures correspond to lithostatic pressures). In agreement with the kinematical constraints, Fig. 8
shows that shear zone viscosity of 1020.5 to 1020.6 Pa.s is required to reproduce such maximum
temperatures. The corresponding steady state thermal inversion intensity is 20 to 30˚C.km-1,
hence matching the estimates extracted from Kohn (2008).
By taking into account erosion and accretion of radioactive rocks, as proposed by previous studies (e.g., Huerta et al., 1998; Bollinger et al., 2006) the range of consistent
viscosities is slightly extended to 1020.35 to 1020.65 Pa.s and the corresponding maximum
thermal inversion intensity spreads between 20 and 40˚C.km-1 (Fig. 9). Whether or not
accretion and surface denudation are considered, the thermal features of the inverted metamorphic zoning across the MCT can simply be reproduced by using shear heating and involving viscosities in the shear zone close to those commonly expected (e.g., Burg and Gerya, 2005).
Hence, our model, without pretending to explain the inverted metamorphism related to the MCT, shows that the downgoing of the Indian plate under the Himalayan belt with kinematical constraints from previous works associated with shear heating can reconcile: (i) the simultaneous increase of pressure and temperature conditions within the lower unit; (ii) the metamorphic temperature peaks recorded within the thrust zone as maximum temperatures reached and representative of the thermal steady state; (iii) the order of thermal inversion intensity and (iv) the location of such a thermal inversion mainly below and across the thrust zone. Furthermore it does not contradict the possible concomittance of accretion processes and suface denudation that, in a very lesser extent compared to shear heating, modify the characteristics of the thermal inversion.
Appendix A: Computation methods complements
Continental collision vs. continental subduction: The velocity field configuration of the downgoing plate beneath the first 30 km has a negligible influence on the thermal evolution around the thrust (Fig. A.1).
Interpolation computations between nodes end particles: They are realised by using a weight interpolation scheme (Gerya, 2010) between the Lagrangian particles and the Eulerian nodes. The interpolation from particles to nodes is realised on 1 cell by using at least 25 particles per cell. This constitutes a good compromise between the time needed for interpolation calculations and the generated numerical error (Yamato et al., 2012).
Advection computations: At each time step, the velocity field corresponding to the
tectonic advection (both Vlp and Vup) is computed on each particle. The velocity direction of
each particle is defined as parallel to the nearest segment of the thrust. In order to avoid a sharp variation of the velocity field on particles, the thrust profile was intentionally smoothed at the border of its slanted part (Fig. 1). The magnitude and the sign of each particle velocity are defined by its location relatively to the thrust. Particles are then advected by using the Runge-Kutta method. A Courant criterion maximising the advection to a half-cell by time step associated with the second-order Runge-Kutta method leads to an accurate advection while limiting the computation time (Fig. A.2). The differences between the fourth, third and second orders of the Runge-Kutta method are negligible.
Erosion computation: To simulate erosion, each particle advected above the topography is then numerically considered as part of the atmospheric domain by changing each one of the properties it carries. This way, erosion does not perturb the topography and consequently the crustal thickness that controls the vertical displacements linked to the isostatic balancing. The mass balance is assured by adding the corresponding amount of
Thermal computations: heat diffusion equation (7) is solved by using the implicit finite difference method on the Eulerian grid. Then, the computed temperature difference on nodes ∆T between the current and the previous time step is interpolated from the grid to the particles. Finally, the new temperature is computed by adding the interpolated ∆T to the previous particle temperature. By ensuring the advection by particles, this method has the advantage of defining precisely the new temperature field directly on the particles.
Appendix B: Numerical model validation
Molnar and England (1990) and England and Molnar (1993), by using a series of simplifications, proposed mathematical derivations of the fundamental equations controlling the heat transfer in the lithosphere. This way, without additional heat sources, they defined the tectonic conditions for the occurrence of a thermal inversion on each point of the thrust such as:
Zf⋅ Vth⋅ sin(θ )
π ⋅ κ ≥1 (B.1)
where Zf is the depth of the considered point on the fault. This can be used to provide the
minimum depth Zmin where thermal inversion appears:
Zmin = π ⋅ κ
Vth⋅ sin(θ ) =
π ⋅ κ
Vz (B.2)
Considering a point in the downgoing plate located at the thrust front, it will reach the depth
tzmin = Zmin
Vz =
π ⋅ κ
Vz2 (B.3)
Whereas England and Molnar considered θ constant along the entire slanted part of the fault, θ represents here the maximum dip angle of the thrust and an exact fit with the analytical solutions (B.2) and (B.3) cannot be expected and the thermal inversion is slightly underestimated.
The numerical minimum depth Zmin and start time tmin of the thermal inversion as a
function of Vth and θ show a good agreement with the general trend of the analytical values
given by or deduced from England and Molnar (1993) (Fig. B.1a, c). This consistency is confirmed by the linear regressions (Fig. B.1b, d) resulting from the set of numerical values.
In spite of an overestimation of the minimum depth Zmin of about 5 km, the slope of the linear
regression law between Zmin and Vz-1 is very close to the coefficient π·κ from Eq. (B.2) (Fig.
B.1b). In the same way, the numerical times tmin show also a good agreement with the trend
defined by the analytical solutions for tzmin (Eq. (B.3) and Fig. B.1c, d). Shifts between the
analytical laws and linear regressions are essentially due to the smoothed thrust profile we used (Fig. 1).
Advection effects on the thermal evolution within a thrust zone can be thus described as a function of the vertical component of the thrust velocity Vz (Fig. 1). In Fig. B.1e, g, the results for a range of numerical simulations with different (Vz, k) combinations are treated in the same way as previously. Even if the slopes a relative to the linear regression laws
corresponding to the minimum depth Zmin and time tmin (Fig. B.1f, h) of the beginning of the
thermal inversion are rather far from the coefficient π predicted by England and Molnar (1993) (Eq. (B.2) and (B.3)), both the high similarity between our two regression slopes a and the very good correlation coefficients r confirm the tendencies of the analytical equations.
Appendix C: Rock thermal properties, mantle heat flux and radiogenic heat production effects
Heat capacity Cp crustal scale thermo-dependence law, from Whittington et al. (2009) (T in K): Cpcrust(T < 846K) = 899.54 + 0.3864⋅ T − 2.25⋅ 10−5⋅ T−2 Cpcrust(T > 846K) = 1034.0 + 0.1456⋅ T − 21.59⋅ 10−5⋅ T−2 (C.1)
Thermal conductivity k thermo-dependence laws as a function of the lithology, from Zoth and Hänel (1988) and Clauser and Huenges (1995) (T in ˚C):
kcrust(T) = kmetamorphic(T) = 705
T + 350+ 0.75
kmantle(T) = kultra−basic(T) =
1293 T + 350+ 0.73 (C.2) Acknowledgments
We thank L. Le Pourhiet, T. Duretz and D. May for fruitful discussions and their numerical advices. Stimulating discussions with M. Ballèvre and P. Gautier at the onset of this work were greatly appreciated. We also thank P. Tackley and D. May for the material support (ETH Brutus cluster). This paper benefited from thoughtful and careful revisions from S. Guillot, S. Schmalholz and an anonymous reviewer.
References
Abd El-Naby, H., Frisch, W., Hegner, E., 2000. Evolution of the Pan-African Wadi Haimur metamorphic sole, Eastern Desert, Egypt. Journal of Metamorphic Geology, 18(6), 639-651.
Abdulagatov, I.M., Emirov, S.N., Abdulagatoca, Z.Z., Askerov, S.Y., 2006. Effect of Pressure and Temperature on the Thermal Conductivity of Rocks. Journal of Chemical and Engineering Data, 51(1), 22-33.
Anderson, R.N., DeLong, S.E., Schwarz, W.M., 1978. Thermal model of subduction with dehydration in the downgoing slab. Journal of Geology, 86, 731-739.
Andreasson, P.G., Lagerblad, B., 1980. Occurrence and significance of inverted metamorphic gradients in the western Scandinavian Caledonides. Journal of the Geological Society, 137(3), 219-230.
Arenas, R., Rubio Pascual, F.J., Diaz Garcia, F., Martinez Catalan, J.R., 1995. High-pressure micro-inclusions and development of an inverted metamorphic gradient in the Santiago Schists (Ordenes Complex, NW Iberian Massif, Spain): evidence of subduction and syncollisional decompression. Journal of Metamorphic Geology, 13(2), 141-164.
Arita, K., 1983. Origin of the inverted metamorphism of the lower Himalayas, Central Nepal. Tectonophysics, 95(1–2), 43-60.
Ballèvre, M., Bosse, V., Ducassou, C., Pitra P., 2009. Palaeozoic history of the Armorican Massif : Models for the tectonic evolution of the suture zones. C.R. Geoscience, 341, 174-201.
Beaumont, C., Jamieson, R.A., Nguyen, M.H., Lee, B., 2001. Himalayan tectonics explained by extrusion of a low-viscosity crustal channel coupled to focused surface denudation. Nature, 414(6865), 738-742.
Beaumont, C., Jamieson, R.A., Nguyen, M.H., Medvedev, S., 2004. Crustal channel flows: 1.Numerical models with applications to the tectonics of the Himalayan-Tibetan orogen. Journal of Geophysical Research, 109, B06406.
Bilham, R., Larson, K., Freymueller, J., 1997. GPS measurements of present-day convergence across the Nepal Himalaya. Nature, 386(6620), 61-64.
Bollinger, L., Henry, P., Avouac, J.P., 2006. Mountain building in the Nepal Himalaya: Thermal and Kinematic model. Earth and Planetary Science Letters, 244, 58-71.
Brun, J.P., Cobbold, P.R., 1980. Strain heating and thermal softening in continental shear zones: a review. Journal of Structural Geology, 2 (1/2), 149-158.
Brunel, M., Kienast, J.R., 1986. Etude pétro-structurale des chevauchements ductiles himalayens sur la transversale de l’Everest-Makalu (Népal oriental). Canadian Journal of Earth Sciences, 23, 1117-1137.
Burg, J.P., Leyreloup, A., Marchand, J., Matte, P., 1984. Inverted metamorphic zonation and large-scale thrusting in the Variscan Belt: an example in the French Massif Central. Geological Society, London, Special Publications, 14(1), 47-61.
Burg, J.P., Gerya, T.V., 2005. The role of viscous heating in Barrovian metamorphism of colli- sional orogens: thermomechanical models and application to the Lepontine Dome in the Central Alps. Journal of Metamorphic Geology, 23, 75-95.
Burg, J.P., Schmalholz, S.M., 2008. Viscous heating allows thrusting to overcome crustal-scale buckling: numerical investigation with application to the Himalayan syntaxes. Planetary Science Letters, 274, 189-203.
Caddick, M.J., Bickle, M.J., Harris, N.B.W., Holland, T.J.B., Horstwood, M.S.A., Parrish, R.R., Ahmad, T., 2007. Burial and exhumation history of a Lesser Himalayan schist: Recording the formation of an inverted metamorphic sequence in NW India. Earth and Planetary Science Letters, 264, 375-390.
Camiré, G., 1995. Development of inverted metamorphic gradient in the internal domain of the Taconian belt, Gaspé Peninsula. Canadian Journal of Earth Sciences, 32, 37-51.
Carter, N.L., Tsenn, M.C., 1987. Flow properties of continental lithosphere. Tectonophysics, 136(1–2), 27-63.
![Figure 8 no inversion no inv. 1 1.5 2 2.5 3 1 1.5 2 2.5 3 V th [cm.yr -1 ] V th [cm.yr -1 ]1919.52020.521log10η [Pa.s]1919.52020.521log10η [Pa.s]5007005010500700 5010depth = 20 kmdepth = 30 km both thermal characteristics are in the ranges of the true va](https://thumb-eu.123doks.com/thumbv2/123doknet/14745155.577922/58.892.186.730.199.1090/figure-inversion-depth-kmdepth-thermal-characteristics-ranges-true.webp)
![Figure 10: Appendix Figure A.1 -1.5-1-0.500.51 -5-4-3-2-1012-3-2-1015060403020100Depth [km]1 MyrS = 50 kmvs.50401003060708090110120130x [km]5060403020100Depth [km]1 MyrS = 50 km50401003060708090110120130x [km]510152025Thrust depth [km] 10 2 3 4 5 6 7 8 tim](https://thumb-eu.123doks.com/thumbv2/123doknet/14745155.577922/59.892.136.769.144.808/figure-appendix-figure-depth-myrs-depth-myrs-thrust.webp)