Design and Testing of a Microvalve Capable of Precisely Controlling Low Fluidic Flow Rates
by by MASSACHUSETTS INSTI-TUTE
OF TECHNOLOGY Cody R. Daniel
and
OCI 2 20
Toomas R. Sepp
LIBRARIES
Submitted of the Department of Mechanical Engineering
ARCHNES
in Partial Fulfillment of the Requirements for the Degree of Bachelor of Science in Mechanical Engineering
at the
Massachusetts Institute of Technology June 2011
0 2011 Cody R. Daniel and Toomas R. Sepp. All Rights Reserved.
The authors hereby grant to MIT permission to reproduce and to
distribute publicly paper and electronic copies of this thesis document in whole or in part in any medium now known or hereaftera4re
Signature of Author...
Department of Mechanical Engineering May 17, 2011
Signature of Author...
Department of echanical Engineering May 17,2011 Certified by...,... Martin L. Culpepper Associate Professor Thesis Supervisor Accepted by... John H. Lienhard V Samuel C. Collins Professor of Mechanical Engineering Undergraduate Officer
Design and Testing of a Microvalve Capable of Precisely Controlling Low Fluidic Flow Rates
by Cody R. Daniel
and Toomas R. Sepp
Submitted of the Department of Mechanical Engineering on May 6, 2011 in Partial Fulfillment of the Requirements for the Degree of Bachelor of Science in
Mechanical Engineering
ABSTRACT
Development of the design, manufacture, and testing for a gas flow regulating microvalve is presented herein. The microvalve project served as a test bed for new micromachining techniques and for exploration of MEMS devices made from non-silicon materials. We developed and tested a novel microvalve utilizing a passive mechanical membrane that allows for accurate flow rate control over a wide range of inlet pressures, requiring power only to adjust the flow rate. Design considerations and functional analysis of a microvalve system are discussed, and manufacturing techniques analyzed. The design was verified by comparing the prototyped system to a commercially available mini ball valve. The valves were run through full actuation at varying pressures and the resulting flow was observed and characterized. At 0.69 MPa, the flexure valve prototype was shown to allow adjustments in flow between 1.0* 10-6 and 2.0* 106 m3/s over the period of
about 8 seconds, allowing for a precision adjustment of flow not available in other valves. The experiment demonstrates that the new microvalve offers significant advantages in terms of a wider range of flow rate adjustment available within the operating pressure regime.
Thesis Supervisor: Martin L. Culpepper Title: Associate Professor
Design and Testing of a Microvalve Capable of Precisely Controlling Low Fluidic Flow Rates
by
Cody R. Daniel
Submitted of the Department of Mechanical Engineering on May 6, 2011 in Partial Fulfillment of the Requirements for the Degree of Bachelor of Science in
Mechanical Engineering Statement of Personal Contribution
As a member of a two-person team working on this project, I worked with my teammate to design, prototype, and test the valve presented in the following document. The project was divided into two clear parts in which my teammate and I could work somewhat independently throughout the year, despite being on the same project. The appropriateness of this joint thesis lies within the division of responsibility that is juxtaposed with our cooperation and joint problem-solving efforts throughout the semester.
My main responsibility was the design and manufacture of the microvalve system itself. The
project began with a thorough literature review to examine the landscape of MEMS fluidic devices. From several key pieces of literature an operational scheme was developed and the microvalve structure developed around several key design requirements.
With an operational mode in mind analysis was executed and iterated to build the specific design for an alpha-stage prototype to be tested against a commercially available device. Analysis consisted of both Finite Element Analysis and theoretical modeling, as well as several interface choices made through cost-benefit decisions. With a full model developed around the operating principle and the actuation verified through FEA, machine drawings were produced and parts manufactured on a variety of high-precision micromachining tools.
Interfacing with the testing rig became the synthesis of the work between my thesis partner and me. Working together we were able to set-up the device and gather useful measurements, highlighting the benefits our design offered over commercially available parts. Furthermore, the intersection of our work gave us a framework to evaluate our design decisions and brought attention to several aspects which can be improved in the next iteration of the microvalve. The project as a whole has been enlightening for me. Seeing a project through from
conceptualization through development, refinement, manufacture and testing while working in a team setting has established in my mind a new approach to tasks and problem solving. Further, having a novel design that successfully outperforms currently available devices provided an incredible level of self-validation in my engineering competencies, and encourages me to continue designing and building as I continue my career.
Thesis Supervisor: Martin L. Culpepper Title: Associate Professor
Design and Testing of a Microvalve Capable of Precisely Controlling Low Fluidic Flow Rates
by
Toomas R. Sepp
Submitted of the Department of Mechanical Engineering on May 6, 2011 in Partial Fulfillment of the Requirements for the Degree of Bachelor of Science in
Mechanical Engineering Statement of Personal Contribution
As a member of a two-person team working on this project, I worked with my teammate to design, prototype, and test the valve presented in the following document. The project was divided into two clear parts in which my teammate and I could work somewhat independently throughout the year, despite being on the same project. The
appropriateness of this joint thesis lies within the division of responsibility that is juxtaposed with our cooperation and joint problem-solving efforts throughout the
semester.
My main responsibility was to design and implement a test setup that was capable of characterizing and comparing various iterations of valves to be designed. I began the project with a detailed information search on previous valves as well as the requirements
for the goals of this project. With this, I would have the base knowledge necessary to research and design a test setup capable of testing the prototypes to be developed. By the
end of the project, this involved finding the correct sensors to measure the flow and pressure through the valve, machining the necessary parts to secure the setup, choosing
all the tube and fittings to connect the components, and finally designing the data acquisition loop to record the data. In addition to setting everything up, I also ran the tests, collecting the data necessary to compare the two valves at the end of the semester. Although my main role concerned the setup and testing, I also helped design the actual valve. I was present throughout the entire design process and helped develop the idea of a passive flexure valve into the final prototype. I completed preliminary solid models of the prototyped valve and also machined some of the parts, including the critical flexure part.
Throughout the project I learned a significant amount about everything I did. This
includes pressure and flow sensing, precision machining, the physics of laminar flow, and much more. I gained valuable knowledge of the design process and how to effectively and efficiently turn an idea into a prototype.
Thesis Supervisor. Martin L. Culpepper Title: Associate Professor
Table of Contents Acknowledgements... 8 1. Introduction... 9 1.1. Background... 10 1.1.1. Fab to Micromachines...10 1.1.2. The Microvalve...12 1.2. Thesis Summary... 13 2. Design... 14 2.1. Design Requirements... 14 2.2. Concept Generation...14 2.3. Engineering Design...18 2.4. Implementation...20
2.4.1. Membrane Passive Actuator...20
2.4.2. Valve Seat... 22 2.4.3. Valve Body ... 23 2.5. Control... ... 26 2.6. Competition... ... ... 26 3. Test Setup ... 28 3.1. Overview...28 3.2. Accumulator Tank... 30 3.3. Pressure Sensor...31 3.4. Flow Meter... ... 32 3.5. Data Acquisition... 34 4. Test Results... ... 36
4.1. Ball Valve Baseline... 36
4.1.1. Pressure and Flow vs. Time...36
4.1.2. Flow vs. Pressure - Fluidic Resistance... 39
4.2. Passive Flexure Valve... ... 40
5. Conclusion... .. 45
References ... 48
List of Figures
Figure 1 Completed prototype and final redesign...10
Figure 2 System rendering provided by Lincoln Laboratories... 15
Figure 3 Membrane flexure valve concept... ... 17
Figure 4 Flexure valve cross-section and exploded views... 18
Figure 5 FEA analysis of flexure... 20
Figure 6 Photos of completed valve prototype... 25
Figure 7 Photos of Beswick valve...26
Figure 8 Diagram of initial test setup... 28
Figure 9 Diagram of final test setup... 29
Figure 10 Photo of accumulator tank...30
Figure 11 Photo of Omega pressure sensor... 32
Figure 12 Photo of Omega flow meter... 32
Figure 13 Data acquisition flow chart... 35
Figure 14 Flow and pressure vs. time of ball valve at 0.127 MPa... 37
Figure 15 Beswick ball valve show range of motion...38
Figure 16 Flow and pressure vs. time of ball valve at 0.91 MPa...38/39 Figure 17 Fluidic resistance of ball valve - Flow vs. pressure...40
Figure 18 Flow and pressure vs. time of flexure valve prototype...41/42 Figure 19 Ball valve and flexure valve prototype comparison...43
List of Tables
Table 1 1' Order Design Requirements...15
Table 2 Pugh chart used for design selection... 16
Table 3 Omega pressure sensor specifications... ... 31
Acknowledgements
We would like to give special thanks Robert Panas for his valuable guidance throughout this project. We would also like to thank Professor Martin Culpepper who brought this project to us and Lincoln Labs for their financial support that made this work possible.
1. Introduction
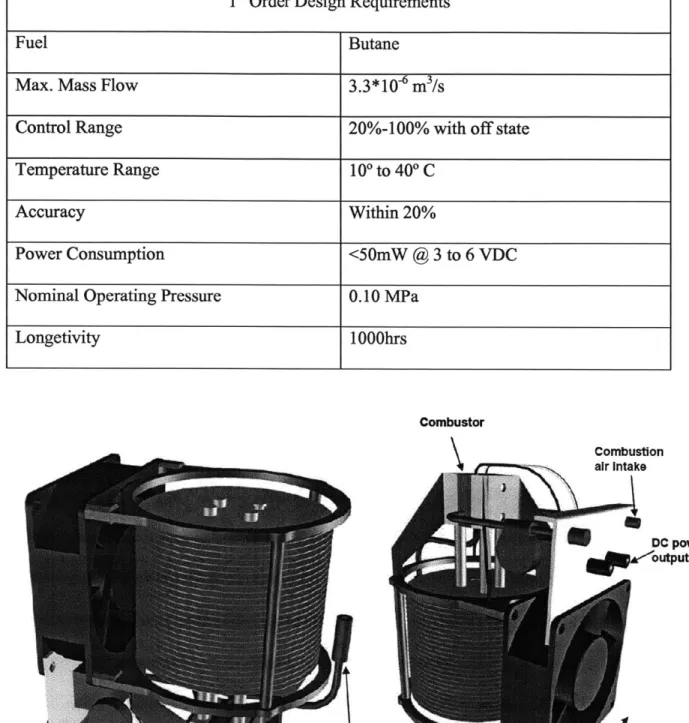
Interest in the development of mobile power generators to supplement battery storage systems has increased in recent times due to the increased power requirements of mobile electronic devices. In particular, a number of military programs aiming to increase the wireless connectivity of soldiers have brought about a need for a lightweight mobile power source. In light of this a micro butane burner has been developed as a wearable power generator capable of producing several watts continuously while running on a compact fuel canister. By allowing a small amount of butane bled through an etched silicon nozzle to burn inside a specially made thermovoltaic chamber a sizable amount of the released energy is directly converted to electrical power, continuously producing power on the order of 1 Watt.
Much of the work towards this concept has been accomplished at Lincoln Laboratories, specifically the burner and thermovoltaic cells. However a suitable valve for regulating gas flow to the microburner has not yet been designed or implemented. Herein, we present, in conjunction with the Precision Compliant Systems Laboratory (PCSL) and Professor Martin Culpepper at MIT, the design, manufacture, and testing of a gas regulating microvalve suitable for the microburner project. The compact size of the system necessitates a similarly sized valve, constrained to approximately 2.5 cm3, yet
which is able to accurately control flow rates on small volume, wide pressure range inlet gasses. To this end, we have designed a microvalve which can be easily manufactured, the design of which allows for a variety of operating characteristics to be utilized, and which allows for better flow rate control than comparable microvalves available. The
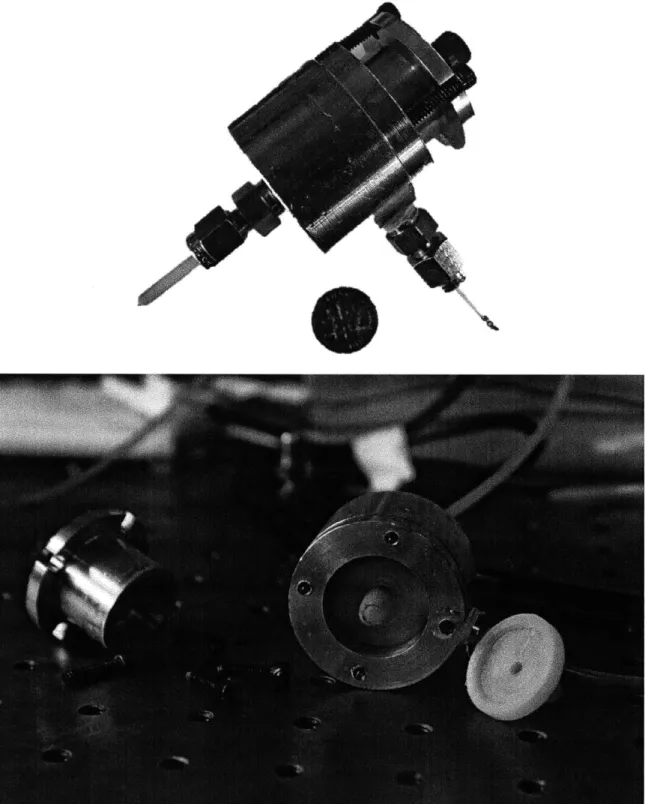
Figure 1: Left, our completed microvalve with a dime for size comparison. Right, our final redesign, 5X more compact and with better expected performance.
final device developed is pictured in Figure 1. From the data and experience gathered with our first prototype, a second device was designed, presented as well in Figure 1.
The PCSL's extensive experience in designing and manufacturing micro-metallic devices, specifically specializing in the design of flexures and MEMS sensors make the lab a natural choice for developing such a device. The work has been spread over a UROP and an undergraduate thesis, and all work took place in the PCSL at MIT.
1.1 Background
1.1.1. Fab to Micromachines
As the techniques developed in the integrated chip (IC) fabrication industry became more refined and better able to produce small features, a natural evolution occurred towards
producing mechanical features integrated with electronic devices. This evolution allowed the first accelerometers to be built into chips by etching movable masses into a silicon wafer and monitoring the change in position with capacitive detection. Realizing the power of this idea, much research was conducted in developing other Micro Electro-Mechanical Systems (MEMS), utilizing silicon fabs as the manufacturing platform.
However many limitations are introduced by using IC processes, particularly as the only working materials are Silicon and vapor-deposited layers such as Gold and Platinum. More so, assembly is limited to integration of 2.5-D machined wafers on top of one another, and moving components typically rely on flexures as the actuation mechanism. Thus enters micromachining. Recent developments of traditional machining techniques on the micro-scale have redeveloped the field of MEMS and allowed new advances hereto unseen. Micromilling, Ultrafast Laser Machining, Wire EDM, and other techniques have all brought new methods to produce small parts which allow new materials and shapes to be produced rapidly. With this development in manufacturing power has come an onslaught of new devices utilizing these techniques to better produce micromachinery and leading to a new era of small machines in every industry. These techniques are capable of repeatable production of parts with micron sized features in either 2.5-D or 3-D machining, and, depending on the technique, can be used with any standard engineering material.
1.1.2. The Microvalve
In 2006 Kwang Oh and Chong Ahn provide the fundamental review on microvalve technology in their 2006 survey paper, stating that while microfluidics has developed rapidly in response to demand from fields such as genomics and biomolecular engineering and built components such as micropumps and micromixers, little review has been given to the critical microvalve. They describe a wide variety of actuation methods, separating designs into Active and Passive types that rely on either mechanical or non-mechanical methods, and offer examples of each actuation scheme in their paper. In their discussion of the paper's findings they highlight the benefits of passive microvalves, notably simple structure, few parts, and reduced power consumption. However, they go on to find that flow regulation is only achieved successfully in active microvalves which require far more complicated structure and are prone to failure. They also state that all mechanical active microvalves "have several disadvantages: unavoidable leakage flow
and relatively high cost due to their complicated structures."
Two years prior A. Debray et al.2 published a paper titled "A Passive Micro Gas
Regulator for Hydrogen Flow Control", detailing the design, manufacture, and testing of a passive flow regulation microvalve. The ingenious mechanical design relied on a membrane with a connected stopper which, when the membrane flexed, would open flow to the outlet line. By having the outside of the membrane in contact with the atmosphere and the inside of the membrane in contact with the exhaust gas, a feedback loop is established which allows for gas flow regulation. Their valve was constructed of a multi-wafer silicon fabrication process, resulting in 3-layer device which was functionally able
to regulate flow through the valve in a variety of conditions. Further, their published theory highlights the scalability of the design to many regimes and materials without a change in the operating principle. This work serves as the fundamental underpinning of the research executed in this thesis, as few other designs offer both the robust operating conditions and simple construction in a scalable design.
1.2 Thesis Summary
In presenting the design of this novel microvalve we have begun with an introduction to the scope, purpose, and impact of this work. The remainder of the thesis is broken into four categories: the design concept and implementation, the test rig and experimental set-up, the results of the work, and the conclusions drawn. Such structure mimics the procedure of our work as we progressed linearly through the project, and as such will convey our thought processes and research decisions as we proceeded through the tasks at hand. With this work we have developed a primer for iterating through a design loop on a small scale, micromachined device, and validated an original design for a microvalve.
2. Design
2.1. Design Requirements
In order to interface this microvalve with the microburner project at Lincoln Laboratories it is critical to meet the design specifications established by the ongoing research project. As such we received a depiction of the ideal final system with a workable area for the microvalve placement as well as a tabulated design specification list, provided in Figure 1 and Table 1, respectively.
Notable within these design requirements are the lifetime, the final size, and the extremely low flow rate. Further noted is the pressure to be dealt with, which at 0.10 MPa requires an upstream regulator to be used as tank pressure in a butane tank can exceed 1.38 MPa on a hot day. Thus a microvalve which could perform to this higher specification would have significant use in removing the upstream regulator component.
2.2. Concept Generation
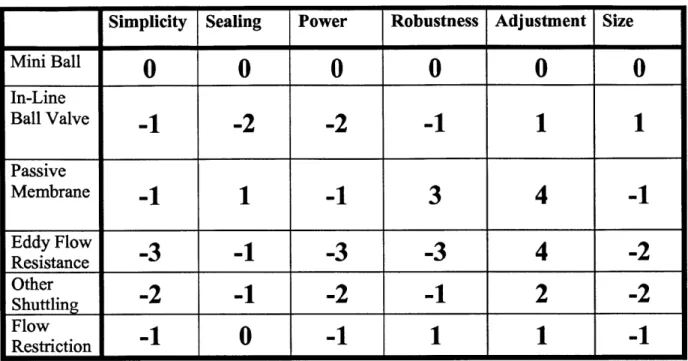
Several concepts exist as the basis for the operating concept of a microvalve. As referenced in the Microvalve Overview1, a number of active and passive designs are possible with varying characteristics. Utilizing this information, a pugh chart (table 2) was created to define which design would best serve for the design requirements at hand (table 1).
Table 1: Design Requirements as specified by Lincoln Laboratories
1st Order Design Requirements
Fuel Butane
Max. Mass Flow 3.3*106 m3/s
Control Range 20%-100% with off state
Temperature Range 100 to 400 C
Accuracy Within 20%
Power Consumption <50mW
@
3 to 6 VDCNominal Operating Pressure 0.10 MPa
Longetivity 1000hrs Combustor Combustion air Intake DC power ftfpoUtput Combustion exhaust Fuel-pressure regulator TE modules
Table 2: Pugh Chart comparing design characteristics
Simplicity Sealing Power Robustness Adjustment Size
Mini Ball
0
0
0
0
0
0
In-LineBall Valve
-2
-2
Passive Membrane3
4
-1
Eddy Flow
Resistance _ _ _1_-3_-3_4_-utilin-2
1
-2
1
2
-2
FlowRestriction
Presented in Table 2 is the Pugh Chart which compares the different available designs suitable for use given the requirements of the project. The categories are defined as follows: Simplicity examines the number of parts and the complexity of the actuation, Sealing how well the seats will hold, Power the running power required, Robustness the flexibility and ability to handle failures, Adjustment the control over outlet flow, Size the final expected size of the valve. First are the three available valves, the mini ball, the in line ball, and the passive membrane design. Last are designs present in the overview, using various shuttling, variable resistance, and variable restriction techniques and summarized here as one category of valve. The expected complexity of a truly active design such as the in-line ball valve or eddy flow resistance is very off-putting, and the ability to fail completely in power loss is unacceptable. That the passive membrane design regulates with the power of the gas pressure is highly appealing, and the cost of complexity and size are worthwhile considering the lack of flow control of the mini ball.
connected to
ambient air valve seat
P2 = 1 atm I fuel cell -I connected to ambient air , = atm TVYvvvy,
reease yuvgen --- released hydrogen
A
30/gm PI = 1 atmA
P, = 0.9 atmconnected to 300pm connected to 300gm
hydrogen tank hydrogen tank
PO = 2.5 atm PO = 2.5 atm
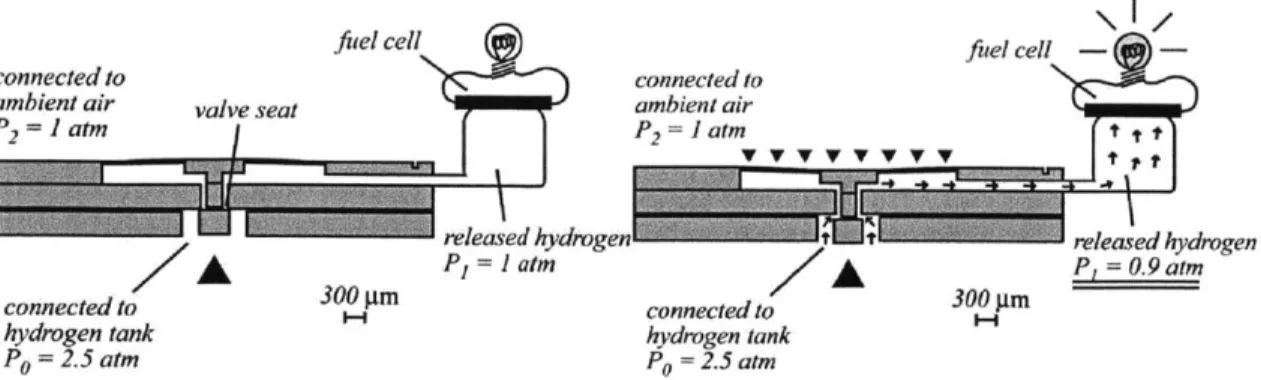
Figure 3: Left, membrane valve in closed position; Right, Membrane opening as pressure differential actuates the control surface.
Having found the design of membrane flexures in the work by Vanelli et al.3 to provide
significantly easy flow control, we explored further designs utilizing this simple flexure design. The work by Debray et al.2
, detailed in the background section, then provided significant design inspiration for the current microvalve project by detailing a suitable design. The simplicity of the design, combined with the scalability and robustness of its performance, promoted the passive membrane design to the lead of the available basis for the microvalve. For reference the figures provided in their paper are given in Figure 3, showing the actuation from the closed state to the open state via the gauge pressure on the membrane opening the stopper. Such actuation was shown to have a markedly good performance in their review, and thus scaling the device to the new manufacturing technique and providing an adjustable flow rate become the necessary functions to implement on the new microvalve. Theoretical understanding of diaphragm deflection was provided by S. Park et al.4 in their work, though FEA was used to validate their
mathematical derivations.
fuel cell
l d h d
2.3. Engineering Design
Building upon the work of Debray et al.2, a diaphragm based passive micro gas regulator
is presented. The theory of operation developed in their paper utilizes several aspects promising for use in this application, including passive pressure regulation, robust compact design, and ease of manufacture. Originally inspired by the method of operation of SCUBA regulators, this valve presents one of the more successful designs in Silicon microvalves. Further, the translation of the regulator away from Silicon fab fabrication techniques and into micromilling presents a series of novel challenges in design and manufacture, as does incorporating the adjustable flow necessary.
*
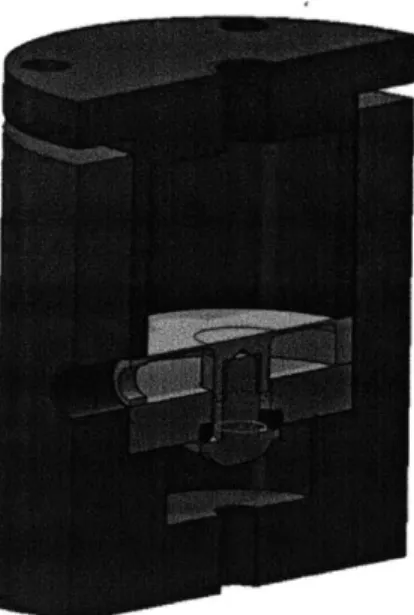
Figure 4: Left, Cross section of the microvalve assembly. Right, Exploded view
The regulator consists of the following components. High pressure gas flows into the high pressure space of the valve first. Separating this region from the outlet flow region is a stopper placed against a sealing plate. The stopper is allowed to open and close via
the flexing of a membrane. Finally there is a pre-loading spring placed against the non-pressurized side of the membrane, all contained within a housing and held together with
four exterior bolts. Assembled and exploded views are contained in Figure 4.
Regulation occurs via a shuttling method of the working gas. The pre-load spring presses the membrane down, opening the stopper and allowing gas to flow through the valve. As the outlet chamber fills with gas force is exerted on the membrane against the pre-load, closing the stopper. Eventually the force on the membrane balances the pre-load force, and the outlet chamber is shut-off from the inlet chamber. Finally, as gas is used from the outlet, the forces unbalance and reopen the stopper, allowing gas flow once again, and continuing the shuttling of gas to the outlet. A reference of the steps is provided in Figure 4.
Using this method for flow regulation provides several benefits over other techniques. First, the design is provably scale-able to the micro level, allowing a prototype to be easily built and then scaled to the appropriate dimension. Second, using the membrane balanced between the force of the pre-load and the force of the gas pressure allows passive operation. The energy required for regulation is provided entirely from the pressure of the gas. Active power is thus required only to adjust the pre-load on the spring to change the operating point. Finally, the use of a flexural membrane reduces the number of true moving parts to zero, relying instead on the deformation of the membrane. This extends the lifespan of the device significantly and reduces the complexity of manufacture and assembly.
2.4. Implementation
Figure 5: FEA analysis showing the deflection under load in open (Left) and closed (Right) states
As successful operation of the device centers around the critical membrane flexural component it served as the driving design constraint. To this end, all development began with a focus on developing this core component to not fail in use in the microvalve system. The other major design constraint was the valve connections, which require certain threads and clearances for proper operation. Machining was carried out referencing the work of J. Gafford5 in his thesis on micromachining techniques.
2.4.1. Membrane Passive Actuator
Designing the flexural membrane required several key aspects to be balanced and taken into consideration. In order for the membrane to flex properly and actuate the valve seat open and close requires that the deformation under load yield an appropriate displacement without excessively straining the material and causing failure.
While in action the membrane will constantly flutter between the two output positions. Describing the forces can be easily done via simple constitutive laws. On the inside surface is the force of the gas pressure, pressing up on the membrane. The other side of the membrane sees the force of the preloading bolt. Thus:
F1 = Poutlet * irr 2
F2= Fpreoad + kpring AZ + kmembrane AZ,
where Poutlet is the out pressure, Fpretoad is the preload force set externally, and kspring and kmembrane are the spring constants of the bolt to membrane interface and the membrane itself. With these equations and the requirement that the forces balance, one can solve for the outlet pressure in terms of an adjustment in the preloading force.
Significant complication is given by predicting kmembrane due to the difficulty of a robust membrane deflection equation. Finite Element Analysis thus allows rapid iteration of a solution for multiple configurations and material properties, as well as allowing fatigue and failure calculations to be executed simultaneously. As such, sample FEA analysis is provided in Figure 4, showing that the deflection under pre-load is ample to open the valve without overly straining the membrane. Further, upon reaching the set pressure point to close the valve, the membrane suffers no failures and closes to the original position flush against the valve seat. This test case is with a 6061-T6 Aluminum membrane with a 25.4 mm diameter and a 254 micron thickness, operating up to a maximum pressure of 1.37MPa and opening a full 0.75 mm. Other materials,
thicknesses, and diameters were iteratively developed to allow a wide sampling of membrane properties to be available for testing purposes. For example, lower pressure requirements demand a more flexible material, and some applications may place restrictions on metals vs. polymers.
2.4.2. Valve Seat
With the valve actuator designed it is time to turn to the valve seating component. In the closed state the membrane must hold the stopper firmly against the valve seat, not allowing leakage into the outlet chamber. Given the circular structure of the membrane actuator a circular valve seat of a matching size naturally follows, given forethought to a cylindrical valve body.
For the prototype device a simple arrangement served as the seating mechanism. A machine screw would be inserted into the membrane via an internal thread. The screw proceeds through the valve seat and with the head emerging in the inlet chamber of the valve. Sealing between the large flat head of the machine screw and the Aluminum valve seat is a soft O-ring of the proper size, secured into position using a quick-setting epoxy.
Choosing this design offers several distinct benefits. First of all is ease of construction, as the valve seat becomes a simple disc with a through-hole and counter-sink cut, and a secondary O-ring seated into position. Cutting threads into the membrane is easy if a stud is made beforehand. Further, using a screw allows for a positive locking seal to be established in the closed state as a slight contact force can be generated between the
screw head and the O-ring. On the downside is the imprecision in concentricity of a screw, resulting in slightly non-level contact of the valve seat surface. However, by properly setting the positive contact of the screw to the valve seat, this problem can easily be averted.
2.4.3. Valve Body
The interaction between the membrane actuator and the valve seat naturally leads to a cylindrical construction of the valve. Considering the core of the inlet chamber, valve seat, outlet chamber and membrane, the natural choice is a slim cylindrical shell which could contain each component in a slip fit. As the housing must also seat the compression tube fittings for inlet and outlet flow, some room must be allocated to properly locate the components provide solid thread area for locking.
Lastly, the valve body must provide structure to hold the membrane actuator closed under the internal pressures and to give a mounting point to the pre-loading screw on the back side of the membrane. In a final production version this would be provided via high strength epoxy compounds, as disassembly would never be required for the device. However, in the prototype device it was deemed necessary to have access to internal components should a piece fail and need replacement or adjustment. And for our experimental purposes easy disassembly allows swapping of membrane actuators to test different actuator characteristics.
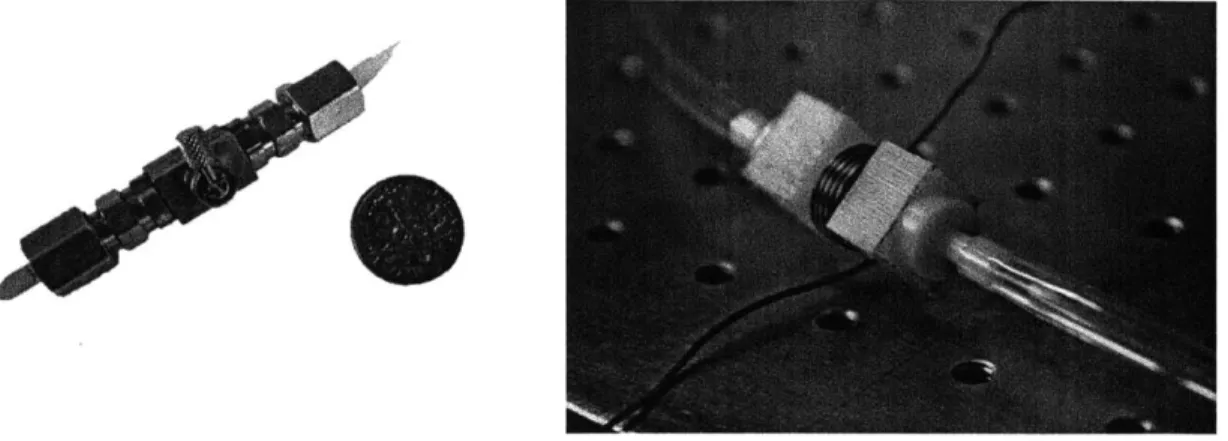
The connector to be accommodated is shown in Figure 6. Available from McMaster-Carr, this compression tube gas fitting line is compact, leak resistant, and above all
incredibly inexpensive relative to other fittings. Choosing this connector as a design constraint helps establish an overall design, as the relative size of the fittings must be taken into account in the valve construction.
To hold the assembly together, four compression bolts are used to clamp the two halves of the valve body together over the actuating core. The bottom half contains both compression fittings and the valve components, while the top part holds the pre-loading arrangement and compression bolts. These two halves mate via a concentric coupling in which the top half slides into the well containing the valve core and is then bolted into place. All of this can be seen clearly in Figure 6.
Coming together, the design is easily manufactured and easily scaled. A variety of materials can be selected for construction, with Aluminum 6061-T6 used here due to its availability and low cost. Machining the valve body was done with a combination of lathe and high-precision milling steps. The final product is shown in Figure 6, with a disassembled view below. Sitting next to the open the microvalve is a spare membrane actuator, showing the construction detail.
Figure 6: Top, the completed microvalve prototype, with a dime for reference. Below, the disassembled microvalve with a spare membrane actuator sitting to the right.
Figure 7: The Beswick miniature ball valve with a dime for comparison, and next to it the solenoid valve of approximately the same size.
2.5. Control
With this device the control of flow through the valve is set by the screw located at the top of the valve. By adjusting the depth of penetration of the screw one compresses the preloading spring, thereby increasing the preload force. Should no force be applied, the membrane naturally closes and shuts off the flow.
One notable situation happens wherein the outlet flow pressure drops far below atmospheric pressure, thereby causing a pressure differential that actuates the membrane. While this would seem to imply a leak condition in the valve, it is counteracted by the valve seating screw which, with positive contact force established when installed, provides resistance to such an occurrence.
2.6. Competition
In order to give comparison of the novel microvalve to other possible designs, two other systems were implemented. The first is a miniature ball valve manufactured by Beswick
and available on McMaster-Carr. The device is simply an ultra-compact ball valve constructed entirely from stainless steel with a control handle on one side. The device is, comparatively speaking, also quite expensive. The second device is a mocked-up valve based on the work of Kwang Oh et al.6 which uses a solenoid to drive a magnetic ball inside a chamber between two valve seat cones made of Delrin. The operating principle is to drive a square wave of current into the solenoid, forcing the magnetic ball to shuttle back forth inside the chamber, thereby allowing a measured flow through the valve. Both devices are shown in figure 7.
3. Test Setup
This section describes two test setups that were used to test various iterations of the valve. The first test setup was used to evaluate the solenoid valve prototyped early in the design process. The second test setup is capable of testing valves at pressures up to 1 MPa and includes a variety of sensors and components that are detailed below.
3.1. Overview
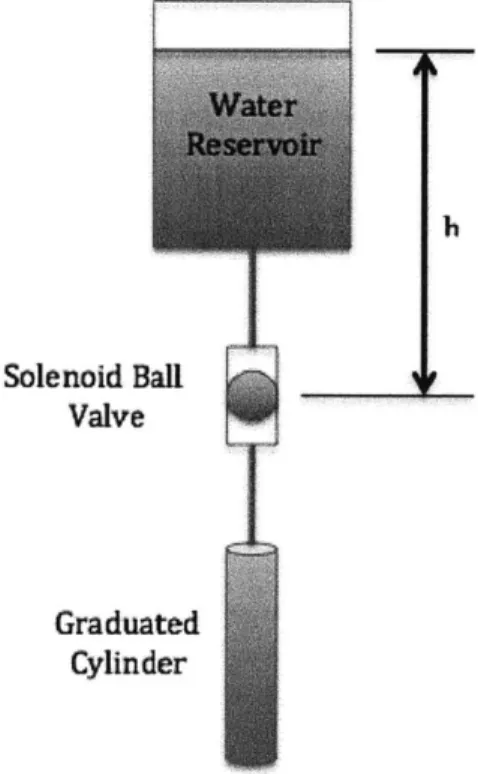
Testing was done on all the design iterations as well as a commercially manufactured miniature ball valve in which to compare our design to. The test setup for our first design, the electrically actuated solenoid ball valve, consisted of a simple setup with a large water supply elevated above the output of the valve and used a graduated cylinder and a stopwatch to approximately measure the flow rate through the valve.
1h
Solenoid Ball Valve
Graduated Cylinder
Figure 8: Test setup diagram for the solenoid ball valve design. The height, h, of the top of the water level in the reservoir to the ball valve is important in estimating the fluid pressure at the valve.
As shown in Figure 8, the water reservoir is located above the valve, creating a pressure at the valve. The pressure seen by the ball valve can be estimated using the relation, P =
p g h, where p is the density of water, g is acceleration due to gravity, and h is the vertical distance between the valve and water level as depicted in Figure 8. Given that the diameter of the water reservoir is much greater than the diameter of the graduated cylinder, it can be estimated that the height, h, remains constant over the period of time in which the graduated cylinder is filled.
Figure 9: Test Setup Diagram used to measure pressure and flow through the valve. Shown above are the supply pressure vessel, regulator, water reservoir tank, pressure sensor, valve, and flow meter. The pressure sensor and flow meter were powered with a power supply and data was collected using a National Instruments DAQ board and software. Thick lines with arrows represent the flow of air or water through the system while thin lines represent electrical connections.
In subsequent iterations of the valve, a more sophisticated method of measurement was used. Figure 9 shows a block diagram of each component of the test setup. The components of this setup were connected using 3.2 mm outside diameter extra-flex nylon 11 tubing. The tube is rated to 1.4 MPa and was connected to each component via compression fittings. The pressure vessel supply tank was typically pressurized at about 14 MPa. A regulator was used to reduce this pressure down in the water reservoir tank to the range of the valve, which is 0 to 1.4 MPa gauge pressure.
3.2. Accumulator Tank
It was necessary to include an accumulator tank in this setup in order test our valve prototype with water. Research was done into using a pump to directly pump water through the valve at a given pressure but this was found to be not feasible as pumps capable of supplying a pressure of 1.4 MPa inherently force a much higher flow rate than we wish to test.
From
Figure 10: Short section of PVC pipe with end caps. This tank was filled with water and acted as the accumulator tank in the test setup.
The accumulator tank was made from a short section of PVC pipe with a diameter of 0.10 m and rated to 1.5 MPa. The pipe section was fitted with end caps on each end with fittings to connect it to the regulator on one side and to the pressure sensor on the other. Risk of catastrophic failure was minimized by always keeping the accumulator as full as
possible with water and keeping it covered and out of sight while pressurized. Figure 10 shows a picture of the PVC accumulator tank.
3.3. Pressure Sensor
Pressure was determined using a solid-state pressure transducer; model number
PX209-300G5V available from Omega Engineering, Inc. Table 3 gives relevant specifications
this unit. The wetted materials on this unit are 316 SSTL, borosilicate glass, silicon nitrite, and aerospace epoxy, which are all compatible with both air and water.
Table 3: Specifications for the pressure sensor used in our valve test, Omega model number PX209-300G5V Pressure Rating 2.1 MPa
Accuracy 0.25% Vibration 20 g peak, 10 g at 2000 Hz Pressure Port M/-18 NPT Burst Pressure 250% Proof Pressure 150% Excitation 24 Vdc @ 15 mA Output 0 to 5 Vdc
Given a full-scale pressure of 2.1 MPa and the voltage output of 5.0 V for this given pressure, it is possible to find the pressure sensor constant, K,, from the linear relation,
P = K, * V,
where P is gauge pressure and V is the voltage output of the sensor. Given the calibration data for this sensor, K, =0.41 MPa/V. The pressure sensor as connected in the test setup is depicted in Figure 11.
Figure 11: The pressure sensor used during valve testing, Omega model PX209-300G5V
3.4. Flow Meter
Flow was measured with a flow meter placed after the valve being tested. This subjected the device to lower pressures, as the only pressure it would have experienced would have come from a short section of tubing place after the flow meter, directing it away from the electronics. The flow meter, part number FLR1007 available from Omega Engineering Inc., features a Pelton Turbine Wheel sensor design. The sensor, as used during testing, is depicted in Figure 12.
The flow is measure using a miniature turbine wheel 16.0 mm in diameter by 0.75 mm thick. Flow is directed onto the small teeth of the turbine wheel causing the wheel to spin at a rotational velocity proportional to the flow rate of the fluid. An infrared light beam is shown on the wheel and a phototransistor is used to detect its reflection on alternating black and white sections of the wheel. Electrical pulses are generated at a frequency linearly proportional to the flow rate and this is converted into a voltage. Table 3 gives all of the relevant specifications on the flow meter.
Table 4: Specifications for the flow rate sensor used in our valve test, Omega model number FLR 1007. Pressure Rating 0.7 MPa
Flow Range (0.2 to 2.0) * 10-f ms/s Accuracy 1.0% Full Scale Repeatability 0.2% Full Scale Port Fittings 1/8 in compression
Response Time <1 sec for 63% of final value Excitation 12 Vdc
Output 0 to 5 Vdc
One consideration that must be made during the tests is the pressure drop across the flow meter. Using data provided by Omega, it is possible to determine a linear relation between the pressure drop, Pdro.0, and flow. For this particular sensor, the maximum pressure drop is 0.04 MPa, occurring at 100% of the rated flow, or 1.67 * 10- m3/s. There is zero pressure drop at zero flow. Given these two points, the linear relation
Pdrop = Kdop * Q,
where Kdro, is the pressure drop constant and
Q
is a given flow rate, can be solved forKdm. For this sensor, Kdr, = 24,550 MPa/m3/s. This linear relation overestimates the
pressure drop since the curve is actually parabolic. Given the maximum pressure tested at the maximum rated flow of the sensor, this leads to an error of 4.2% in the reading from the pressure transducer since the actual drop across the valve being tested would be slightly less. Pressure reading error due to viscous losses in the short sections of tube after the sensor are negligible at the low flow rates that were tested.
As with the pressure sensor, it is also necessary to determine a flow sensor constant, Kf. First, the device was calibrated using a graduated cylinder. A constant flow was passed through the device for 30 seconds and collected in a graduated cylinder while the voltage output, V, was recorded. The flow rate
Q
is found using the equation,Vol
Q = - t
where Vol is the volume of fluid measured by the graduated cylinder and t is time. Then, using the linear relation
Q
= K * V,the flow sensor constant, Kf, was determined to be 0.34 * 10-mn3/s/V.
3.5. Data Acquisition
A National Instruments (NI) data acquisition board (DAQ board) and NI software was used to procure the flow and pressure signals from the sensors. A basic setup was constructed using the software that allowed us to both view a real-time graph of the pressure and flow measurements as well as write the raw data to a file for future analysis. The software was set to collect data at 20 Hz throughout all of the tests. Figure 13 shows the block diagram illustrating the flow of data.
Flow
Figure 13: The voltage outputs of the pressure sensor and flow meter are sensed and split into two paths. The lower path shows how the raw voltages are written to file while the upper path shows each signal roughly amplified by each sensors respective voltage constants for debugging purposes and then output to a graph.
4. Test Results
There were two types of tests performed on the valves that were tested. In the first type of test, the pressure was kept at a near constant value throughout the test. The valve was then brought from a completely closed position to its completely open position and back to a completely closed position. This opening and closing was done as smoothly and uniformly as possible. It was also done very slowly (taking on average 15 to 20 seconds) with the air tank valve open, keeping the pressure at the valve constant. This test was completed at several different pressures ranging from 0.12 -0.91 MPa.
The second type of test was done at a variable pressure. The water accumulator was pressurized to about 1.0 MPa and then disconnected from the air tank. The valve was positioned to allow less than 2.0* 10-6 m3/s at this maximum pressure of 1.0 MPa. Over the course of the test, air was slowly bled out of the accumulator tank in order to decrease the pressure. In the case of the ball valve, it was possible to do this test at different valve positions.
4.1. Ball Valve Baseline
4.1.1. Pressure and Flow vs. Time
As described above, the first series of tests were at a constant pressure. Because the ball valve is able to fully open, reducing its fluidic resistance to near-zero, the tests show that the flow meter becomes saturated during these tests. Figure 14 shows that even at and average pressure of 0.13 MPa, the maximum flow rates exceed 2.0*10-6m3/s.
2.5
-Flow (mA3/s * 10A6) -Pressure (MPa) 2 15 0.5 IS -- - - - -- - ----0 - -0 5 10 15 20 25 Time (s) (a) 2 F"ow (m^3/s * 10A6) -Pressure (MPa) 1.5 1 0.5 15 15.5 16 16.5 17 17.5 18 18.5 19 19.5 20 Time (s) (b) Figure 14: Flow rate and pressure vs. time for the miniature ball valve. The average
pressure during this test is 0.13 MPa. The full test is shown in (a) while a more detailed graph of the valve closure is shown in (b).
It is important to note that the valve was closed very slowly. As can be seen in Figure 14(b), the flow rate can be seen to follow a somewhat parabolic profile as it nears the fully closed position (time = 17 to 20 seconds). It should be noted that the difference in
valve position is 20+/-5* between where the flow rate,
Q,
is zero and 2.0*10=6 m3Is. With
a valve lever arm length, 1 = 7 mm, this corresponds to a distance of 2.4+/-0.4 mm at the end of the lever, which makes it very difficult to precisely control these low flow rates.
Fully Open-
---Fully Closed
Figure 15: Miniature ball valve with annotated fully open and fully closed positions. With a full range of motion of 90*, the useful range is only 20+/-5*.
It is interesting to compare these results at 0.13 MPa to the same test done at and average pressure of 0.91 MPa. Figure 15 graphically shows the data obtained from this test.
2.5 -Flow (m^3/s * 10A6) -Pressure (MPa) 2 1.5 0.5 0 0 5 10 15 20 25 30 Time (s) 38
2.5 -Flow (m^3/s *1OA6) - -Pressure(MPa) 0 20 20.5 21 21.5 22 22.5 23 Time (s) (b)
Figure 16: Flow rate and pressure vs. time for the miniature ball valve. The average pressure during this test is 0.91 MPa. The full test is shown in (a) while a more detailed graph of the valve closure is shown in (b).
Comparing Figures 16(b) and 16(b), flow was brought from the flow meter saturation point to zero in roughly 3.5 seconds in each test. However, at the higher pressure of 0.91 MPa, there was a much more sudden drop in pressure given very similar valve closure rates. This made the flow even more difficult to control within the range of 0 - 2.0*10k
m3/s.
4.1.2. Flow vs. Pressure - Fluidic Resistance
The second type of test performed was conducted at a variable pressure in order to determine the fluidic resistance for various positions of the valve. Pressure was varied very slowly to avoid the effects of any lag between the two sensors or of any time constants working against the change of flow rate within the system. Figure 17 shows the two tests conducted on the ball valve at slightly different positions.
1.8 1.6 1.4 ~1.2 U. 0.2 0 0 0.1 0.2 0.3 0.4 0.5 Pressure (MPa)
Figure 17: Flow rate versus pressure for two different positions of the ball valve. The solid curve shows a valve position that is slightly more open than the dashed curve, hence the higher flow rates given the same pressures.
4.2. Passive Flexure Valve
The passive flexure valve that we designed and prototyped was tested in the same way as the ball valve. The valve was able to create a perfect seal in the pressure range up to 0.41 MPa. At higher pressures above 0.41 MPa, the flexure was not able to flex enough to sufficiently compress the o-ring. Although the flexure certainly flexes more at higher pressures, it reaches a plateau and the increased o-ring compression needed to make a tight seal is not met. Figure 18 shows the flexure valve performance at average pressures of 0.07 MPa, 0.28 MPa, and 0.69 MPa.
2 "nFlow (mA3/s * 10^6) -Pressure (MPa) 1.6 1.4 12 1 -0.8 0.6 0.4
0.2 Average Pressure 0.07 MPa
0 0 5 10 15 20 25 Time (s) (a) 2.5 -Flow (mA3/s 10^6) -Pressure (MPa) 21 1.5 0.5 0 0 5 10 15 20 25 Time (s) (b)
Flow (mA3/s * 10^6) - -Pressure (MPa) 1.5 0 5 10 15 20 25 Time (s) (c)
Figure 18: Flow rate and pressure vs. time for the flexure valve prototype. The average pressures during the tests shown in (a) is 0.07 MPa, (b) is 0.28 MPa, and (c) is 0.69 MPa.
Figure 18(a) shows that for the average operating pressure of 0.07 MPa, flow is kept to within acceptable values. The increase in flow shown in Figure 18(a) that occurs at about 13 seconds reveals some of the challenges that we have faced during this design of this valve. It had proved difficult to design a flexure capable of handling such a large pressure range. The flexure had to be a certain thickness and have a higher preload in order to perform at the high pressures, but this meant that at lower pressures (near normal operating conditions) the valve could not provide the constant fluidic resistance as at higher pressures.
From Figure 18(b), flow rate is completely stopped when the valve is in the fully closed position. Just like the ball valve, flow is able to exceed the saturation voltage of the flow meter. Also, like the ball valve, there is not much control over the flow rate as can be seen by the sudden increase in flow at 8 seconds and the sudden drop in pressure at 15 seconds.
Unlike the ball valve, however, this phenomenon is improved at higher pressures. Figure 18(c) shows how the valve can be varied at an average pressure of 0.69 MPa. Although the valve leaks at about 1.0*10~6 m3/s, the flow rate can be slowly increased and decreased between this and 2.0*10-6 m3Is. Over a period of about 8 seconds, the flow rate
is shown to increase at a steady rate. The fluctuations in this linear increase are explained by human inconsistency in turning the screw used to adjust the flow rate of the valve.
18 1.6 14 L12 IC E 0.8 0.6 -Ball Valve 1 0.4 "Ball Valve 2 " Flexure Valve 0.2 0 - -0 0.1 0.2 0.3 0.4 0.5 0,6 0.7 Pressure (MPa)
Figure 19: Flow rate versus pressure for the flexure valve prototype is shown in red and compared to the two different positions of the ball valve that were tested.
As with the ball valve, a variable pressure test was also done on the flexure valve to determine its fluidic resistance at different pressures. The valve was positioned to the fully closed position with the screw adjustment completely backed off the flexure. Figure 19 shows this test overlaid onto the fluidic resistance curves of the ball valve. The
flexure valve has a very similar curve to the ball valve except shifted to the right as our valve was designed to control lower flow rates at higher pressures. Interestingly, there is a maximum-recorded flow rate of 1.03*10-6 m3/s occurring at 0.53 MPa. At increased pressures, the flow rate is slightly reduced, showing that this design can work well in this
pressure range.
5.
Conclusion
The effort presented here brings the mobile power generation concept closer to completion. With the micro butane burner developed at Lincoln Laboratories, soldiers in the field would have a small source of power on hand for use in charging electronic devices. Such a device would fundamentally change the way in which missions and tasks are performed by allowing for much greater flexibility and increased efficiency. Due to the small flow rates required for the micro-burner and the size and weight restrictions of the system as a whole, it is necessary to develop a compact valve capable of regulating small flow rates at high pressures. The valve we designed and prototyped was demonstrated to do exactly that. Compared to a commercially available miniature ball valve, our prototype was shown to be significantly more capable at regulating very low flow rates at high pressure.
Although further refinement of the design is necessary, the current flexure valve prototype shows promise as a device capable of controlling low flow rates at a great range of pressures. By abandoning the disassembly feature the mass of the microvalve is greatly reduced, allowing the bolts to be replaced with epoxy to bind the system together permanently. With the clamping bolts removed, the space reserved for the pre-load chamber can be reduced, facilitating a smaller bolt and spring mechanism. The final microvalve should also have a smaller flexure, allowing better handling of low pressure regime flow control. While the large diameter flexure used in this prototype does allow pressurization to over 1MPa, it has reduced capabilities sub .3MPa. Lastly, a simple geometry change results in porting of the connector in a linear fashion rather than an "L" shape, reducing the size of the valve significantly. With these changes the volume of the valve is reduced from 48cm3 to 10cm3. The volume of the Beswick's ball valve is roughly 2cm3, according to the CAD model. In total, the changes will reduce the dead
space of the valve, reduce cost, ease manufacture, and make the valve competitively small without sacrificing performance in flow rate control of gases or liquids.
These changes have been synthesized in the CAD model below in Figure 20, highlighting the impact on size and mass from the current alpha prototype to the finalized device. Finally, a variety of control actuators can be mounted to adjust the preload. One simple solution is to use a small servo motor to actuate the bolt configuration. Another is to rely on a shape memory alloy which, when heated, provides the displacement for pre-loading. The solution would depend on whether fast response time or accuracy are desired more, and what characteristics the end-user wishes to see in the system.
Figure 20: A side-by-side comparison of the design for a finalized prototype and the currently available Beswick's super miniature ball valve. The new design is only twice the size of the ball valve, yet offers significant improvement in fluid flow adjustment.
The work here lays the foundation of an incredibly useful device. A scalable, robust microvalve which requires no power to regulate flow, can handle large pressures relative to flow rates and device scale, and can easily change flow rate with an insensitive and broadly linear interface. On a prototyped manufacturing level the valve outperforms
similar devices, and with further work invested in manufacturing the device will easily sit in a unique niche in the current micro flow regulation devices. Finally the device sets precedent for bringing designs from the Silicon Fab to the micromachine, enabling new material choices and design choices not available to wafer scale processes. In all, the device is a resolute success.
References
[1] Kwang W Oh and Chong H Ahn. "A review of microvalves" Journal of
Micromechanics and Microengineering (2006): R13-R39. Digital
[2] A. Debray, T. Nakakubo, K. Ueda, S. Mogi, M. Shibata, H. Fujita. "A Passive Micro Gas Regulator for Hydrogen Flow Control" PowerMEMS 2004 (IEEE) (2004). Digital
[3] N. Vandelli, D. Wroblewski, M. Velonis, T. Bifano. "Development of a MEMS Microvale Array for Fluid Flow Control" Journal of Microelectromechanical
Systems Vol.7, No.4 (Dec. 1998): 395-403. Digital
[4] S. Park, W. Ko, J. Prahl. "A Constant Flow-Rate Microvalve Actuator Based on Silicon and Micromachining Technology" IEEE (1988): 136-139. Digital
[5] J. Gafford "Fabrication of High-Quality Microflexures Using Micromilling
Techniques" MIT Undergraduate Thesis. (June 2010)
[6] K. Oh, R. Rong, and C, Ahn. "In-line Micro Ball Valve Through Polymer Tubing"
Micro Total Analysis Systems (2001): 407-408. Digital
[7] Omega Engineering Inc. "FLR 1000 Series - Flow Sensors and Meters for Liquids User Manual." Available from Omega Engineering Inc.
[8] Omega Engineering Inc. "PX209 Pressure Transducers - Instruction Sheet." Available from Omega Engineering Inc.
Appendix A - Part Drawings
Housing Bottom
0.720 AX 00.107T0.64 MAX 6-32 -2B WO.50 MIN EQUALLY SPACED \ % #0.332THRU Sondwrd Tarnces -- afspeoie4 x.X ±0.2 x.xX 0.01 x.xxX ± 0.005 x.xxxX ± 0.0005 Angle± .5 t o$ $ESolidWorks Student Ucense
Name: Material: Quantity: Sheet: Sheet Scale: Drawn By: housingbottom Aluminum 6061-T6 1 1 of I 1:1 TRS
49
THRUHousing Top
4X 00.150THRU EQUALLY SPACED
SECTION B-B
(/ 5tmncd Tatzaccms
C, (uWies o1ttWrW spec~edj
xLX ±0.2 x.xX 10.01
x.xxX ± 0.005
0 x.xxxX 0.0005
Angle± .5 SolidWorks Student License Po Q C
Name: housing-top Material: Aluminum 6061-T6 Quantity: I Sheet: 1 of 1 Sheet Scale: 1:1 Drawn By: TRS 0.201 THRU
Flexure Plate +0,005 0.010 0.000 0.1 z6
1-i
0.64SECTION B-B
00.13670.41 MAX 8-32 -21B 0.30 MIN 0.100 THRU TO CENTER 0.075 Standard Toheraces Pr- deweSpeci*edj X.X ±0.2 x.xX 0.01 x.xxX t 0.005 x.xocX 1 0.0005 Angle .5 Arje (9 KSolidWorks Student License
Name: Material: Quantity: Sheet: Sheet Scale: Drawn By: flexure-plate Delrin I of 1 2:1 TRS
+0.003 0.050 0.000
SECTION B-B
standard kwces - dWie spece4 x.X t0.2 x.xX 10.01 x.xxX t 0.005 x.xxxX 0.0005 Ange± .5 SolidWorks Student LicenseName: sealing-plate Material: Aluminum 6061-T6 Quantity: 1 Sheet: 1 of 1 Sheet Scale: 2:1 Drawn By: TRS Sealing Plate 0
Valve Assembly DESCRIPTION QTY. 1 BHCS 8-32 X 0500in 2 flexureplate 3 housing-bottom 4 housingtop
5 ORING 010 VITON 75DUR
Ssaling-plate
7 SHCS 0.25-20 X 0500in 1
8 SHCS 6-32 X 0500 4
SolidWorks Student License
Stcard Takuunces
'" sp-Acco '' Name: valve x.X t 0.2
x.xX 10.01 Material:
x.xxX i 0.005 Quantity: 1
x.xxxX 0.0005 Sheet: 1 of 1
Angle± .5 Sheet Scale: 1:1 K.i Drawn By: TRS
Beswick's Super-Miniature Ball Valve 1032 Thred