HAL Id: hal-01023379
https://hal.archives-ouvertes.fr/hal-01023379
Submitted on 12 Jul 2014
HAL is a multi-disciplinary open access
archive for the deposit and dissemination of
sci-entific research documents, whether they are
pub-lished or not. The documents may come from
teaching and research institutions in France or
abroad, or from public or private research centers.
L’archive ouverte pluridisciplinaire HAL, est
destinée au dépôt et à la diffusion de documents
scientifiques de niveau recherche, publiés ou non,
émanant des établissements d’enseignement et de
recherche français ou étrangers, des laboratoires
publics ou privés.
Microrelief
Edwige Vannier, Odile Taconet, Richard Dusséaux, Olivier Chimi Chiadjeu
To cite this version:
Edwige Vannier, Odile Taconet, Richard Dusséaux, Olivier Chimi Chiadjeu. Statistical
Character-ization of Bare Soil Surface Microrelief. Maged Marghany. Advanced Geoscience Remote Sensing,
InTech, Chapitre 9: pp. 207-228, 2014, ISBN: 978-953-51-1581-6. �10.5772/57244�. �hal-01023379�
Statistical Characterization of Bare Soil Surface
Microrelief
Edwige Vannier, Odile Taconet,
Richard Dusséaux and Olivier Chimi-Chiadjeu
Additional information is available at the end of the chapter http://dx.doi.org/10.5772/572441. Introduction
Because the soil surface occurs at the boundary between the atmosphere and the pedosphere, it plays an important role for geomorphologic processes. Roughness of soil surface is a key parameter to understand soil properties and physical processes related to substrate movement, water infiltration or runoff, and soil erosion. It has been noted by many authors that most of the soil surface and water interaction processes have characteristic lengths in millimeter scales. Soil irregularities at small scale, such as aggregates, clods and interrill depressions, influence water outflow and infiltration rate. They undergo rapid changes caused by farming imple‐ ments, followed by a slow evolution due to rainfall events. Another objective of soil surface roughness study is investigating the effects of different tillage implements on soil physical properties (friability, compaction, fragmentation and water content) to obtain an optimal crop emergence. Seedbed preparation focuses on the creation of fine aggregates and the size distribution of aggregates and clods produced by tillage operations is frequently measured. Active microwave remote sensing allows potential monitoring of soil surface roughness or moisture retrieving at field scale using space-based Synthetic Aperture Radars (SAR) with high spatial resolution (metric or decametric). The scattering of microwaves depends on several surface characteristics as well as on imagery configuration. The SAR signal is very sensitive to soil surface irregularities and structures (clod arrangement, furrows) and moisture content in the first few centimeters of soil (depending on the radar wavelength). In order to link the remote sensing observations to scattering physical models as well as for modelling purpose, key features of the soil microtopography should be characterized. However, this characteri‐ zation is not fully understood and some dispersion of roughness parameters can be observed in the same field according to the methodology used. It seems also, that when describing
© 2014 The Author(s). Licensee InTech. This chapter is distributed under the terms of the Creative Commons Attribution License (http://creativecommons.org/licenses/by/3.0), which permits unrestricted use, distribution, and reproduction in any medium, provided the original work is properly cited.
surface roughness as a whole, some information related to structured elements of the micro‐ topography is lost.
2. Data SAR – Electromagnetic models and soil modelling: Position of
problem
Synthetic Aperture Radars allow the study of agricultural bare soils by measuring the backscattered coefficient. The backscattered signal depends on the surface roughness, on the electrical permittivity which is closely linked to the soil moisture and texture. It varies depending on the frequency and polarization of the transmitted electromagnetic wave and on the incidence angle [1-4]. The electromagnetic modeling is a valuable tool for radar data inversion to intend to characterize the roughness and / or the humidity of agricultural soils. The electromagnetic models based on the Maxwell's equations and the boundary conditions can be classified into two categories: analytical models [5] and numerical models [6-9]. The analytical models are based on physical approximations which reduce the applicability domain. But, these models have an obvious interest: the electromagnetic field scattered by the surface and the coherent and incoherent intensities are given by analytical formulas arousing physical interpretations. The first-order small-perturbation method (SPM1) is only valid for surfaces with small roughness versus the wavelength [10] and the Kirchhoff approximation (KA) is applicable to surfaces with long correlation length [11-12]. The small slope approxi‐ mation (SSA1) has an extended domain of applicability which includes the domains of the two previous approaches [13]. It is likewise for the integral equation model (IEM) which became the most quoted and implemented rough surface scattering model in the field of radar remote sensing for earth observation [14]. These four analytical models assume that the soil can be represented by a stationary random process. The stationarity is not clearly established for agricultural soils, especially in the presence of very marked furrows [15]. These models require the knowledge of the autocorrelation function. In addition, the models KA, SSA and IEM require the one-point and two-point height probability distributions. The calculations are typically conducted with the Gaussian probability density function. The Gaussian character is observed for seedbeds with furrows slightly marked but to our knowledge, it is not the case for ploughed soils [9, 16]. Furthermore, tilled agricultural soils are anisotropic surfaces and we have to take into account the quasi-periodicity of the surface in the estimation of the coherent and incoherent components of the backscattered signal [17]. Fractal and multi-fractal ap‐ proaches for describing agricultural soils were also implemented. Some works allowed extending electromagnetic analytical models to the fractal character of soils [18-19]. So, the remote sensing studies using these analytical models consider a global description of the scattering surface and do not take into account their structuring objects such as soil clods, holes and aggregates [20]. Then, for the analysis of radar data, it is essential to extend the analytical models by taking into account these structuring objects which needs the understanding of their statistical properties and their influence on the autocorrelation function.
The second class of electromagnetic models relies on numerical methods for solving Maxwell's equations and boundary conditions [6-8]. These models are so called exact if no physical approximation is made. These models do not provide an analytical solution of the problem and require high computational times. This is a major drawback for the inversion of radar data. Advanced numerical methods have been developed over the past two decades to reduce computational time [21]. For these numerical methods, the scattered intensities and the backscatter coefficient are estimated over results of a finite set of surface realizations. The estimation error depends on the number and size of surfaces. These numerical models associated with the Monte Carlo method rely on surface generating algorithms. Agricultural bare soils have structuring objects contributing to the backscattered signal. Except for a few references [22], the surface generators are based on a global approach and do not take into account the objects characterizing agricultural soils. To improve the analysis of radar data, it makes sense to move forward in the statistical description of the structuring objects, to develop new surface generating algorithm in accordance with the statistical properties of these objects and to interface them with numerical electromagnetic models.
3. Statistical and spatial analysis of soil roughness
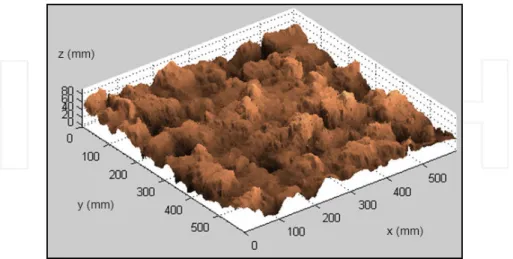
Several types of surface roughness may be recognized from micro relief variations to larger level variations representing the landscape. At millimetre or centimetre-scales, soil surface roughness mainly results from the breakdown of the superficial soil layer by tillage operations. Depending on the soil properties, in particular texture, organic matter content and moisture state of the soil material, and on the tillage tool, different aggregate sizes will be produced (figure 1).
3.1. Background
Two approaches are commonly investigated for statistical and spatial analysis of soil rough‐ ness at these scales. In the first one, the surface roughness is characterized as a whole by its autocorrelation function model or by its variogram and is summarized by statistical indices: root mean square of heights, correlation length, roughness exponent or Hurst coefficient, parameter Zs, tortuosity or other specific indices [9, 15, 23-31]. Fractal and multifractal
description are investigated too [32-34]. In the second one, local and morphological aspects of the surface are brought into focus such as aggregates, clods and mound-and-depression patterns [20, 28, 35-43].
Direct ground field measurement of surface roughness can be performed by either contact techniques [44-46] or non-contact techniques such as close range photogrammetry [15, 26, 47-50] or laser scanning [32, 51-53]. Some authors made comparative studies [30, 54-56] and a review of the measurement techniques can be found in [3]. Although close range photogram‐ metry and laser scanning enable retrieving a 3D digital elevation model (DEM) of the soil surface, many authors still carry on characterizing soil surface roughness by extracting 1D profiles on the 3D measurement [50, 57-58]. This can be explained by the fact that 1D statistical indices are widely spread and serve as reference, since measurement of 1D profiles was developed in the first place. Nevertheless, it traduces also a lack of microrelief modelling. In the field of soil moisture retrieval from SAR imagery, Lievens and Verhoest, [59], are led to propose methods to circumvent surface roughness parameterization problems.
Blaes and Defourny [30] and Dusséaux et al. [9] suggest using a bidimensional autocorrelation function to characterize bare soil agricultural surfaces. Bidimensional approach is more appropriate to the measurement of roughness anisotropy related to multiscale processes (row structured field, clod arrangement). In order to improve statistical characterization of bare soil surface microrelief, we highly focus on 3D DEM interpretation study. The proposed approach is detecting and localizing clods and big aggregates by segmentation methods, modelling them by a simplified geometric form, estimating the statistical distribution of the modelling structuring object parameters and then generate numerical surfaces by setting structuring objects onto a substrate according to statistical laws.
3.2. 3D-DEM interpretation
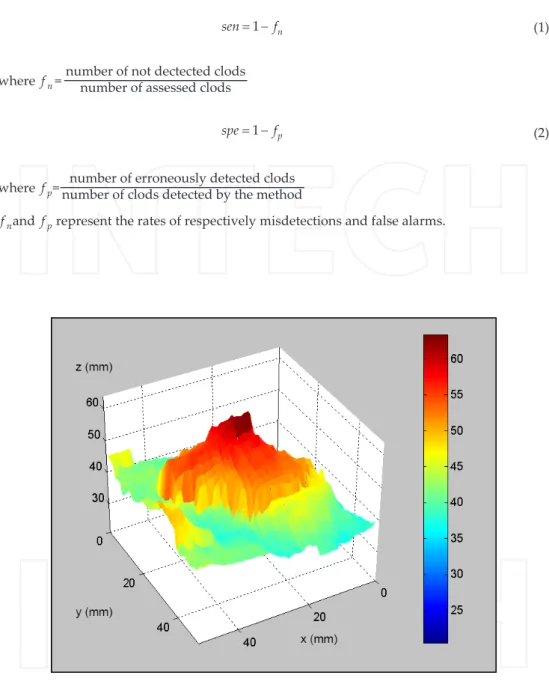
Millimetric DEMs of the soil surface were seldom used for detecting and localizing big aggregates and clods. In 3D, an individual clod (or big aggregate) is seen as a local bump standing out with slightly sharp boundaries (figure 2). It is a recognizable structure presenting rather medium or high level values, with a high gradient on the edges, but inside color level values are non-homogenous. Two newly built methods have been presented [41- 42, 60]. Addressing the problem of detecting and localizing clods requires also an evaluation meth‐ odology. We propose several qualification tools based on the knowledge of a ground truth serving as reference. The detection performance can be evaluated by estimating the sensitivity
1 n
sen= -f (1)
where fn=number of not dectected clodsnumber of assessed clods
1 p
spe= -f (2)
where fp=number of clods detected by the methodnumber of erroneously detected clods
fnand fp represent the rates of respectively misdetections and false alarms.
Figure 2. Clod representation in 3D
There is usually a compromise between sensitivity and specificity for a detection method. Setting of the method parameters can be made by constructing the receiver operating curve (ROC), eventually introducing weight reflecting the cost of a bad decision [61].
The localization performance can be estimated by computing the overlap rates between each detected clods and matched reference clods:
( )
( ) / ( )v i ti i ti
O i =A I II A I UI (3)
where Ii is the set of pixels located inside the identified boundaries of the clod i, Iti the set of
pixels located inside the true boundaries of the clod i, and A(Ii) the cardinal of Ii. Ov is null
either when a true clod is not identified or when a false positive has been detected. The ideal case corresponds to an overlap rate equal to 1 for all the clods. This ideal case leads to a cumulative distribution function (cdf) equal to 0 for an overlap rate strictly lower than 1 and equal to 1 for an overlap rate upper or equal to 1 [60].
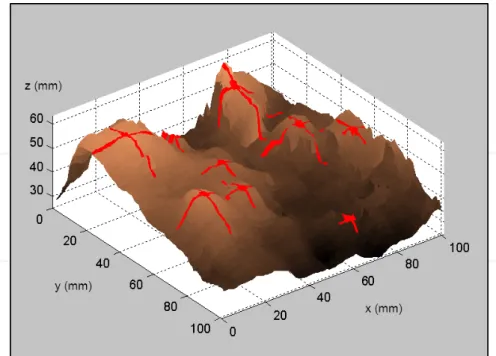
Now, in [41], clod identification is obtained by merging information on local maxima enhanced at different scales by wavelet transform. Clods are successfully identified by their summit and two diameters on several kinds of soil surfaces. Boundary points are estimated by thresholding the height slope. The detection performance was evaluated with the help of a soil scientist on a controlled surface made in the laboratory as well as on real seedbed and ploughed surfaces, made by tillage operations in an agricultural field. A minimum size, set here to 7 mm of diameter depending on the DEM horizontal resolution of 1mm, is required for aggregates, in order to prevent a high false positive rate. Indeed, one has to be able to count the aggregates. The identifications of the clods were in good agreement, with an overall sensitivity of 84% and a specificity of 94%. A limitation of this method is that it does not provide the clod boundaries. An example of clods identification on a part of seedbed surface is provided on figure 3. We can see that most of the mounds have been identified. A small one, with center coordinates located near (50, 15) has not been detected.
In order to get the clods boundaries, a contour-based method has been proposed by Taconet et al. [42]. The clod boundary is determined by hierarchy of closed elevation contours going through the pixels of highest gradient values. This second method gives satisfactory results with a clod identification sensitivity of 75% and specificity of 95%. Figure 4 displays the clods localization obtained in the same part of seedbed as on figure 3.
There is a good agreement with the identification of clods by wavelet-based method. The small clod that was not detected is now identified (clod number 5 in figure 4), but two clods are not detected anymore, illustrating the lower sensitivity of the contour-based method.
The contour-based method has been tested until now, on freshly tilled seedbed and artificial soils which both contain mostly distinct clods and aggregates. Furthermore, defining clod boundary as an elevation contour requires that the substrate of clods has little variation, which is not the case of ploughed surfaces. Indeed, the automatically retrieved clod boundaries are generally underestimated and lay at a constant height, which is not very realistic.
Another approach is developing a more classical method of image segmentation based on mathematical morphology, the watershed-based method [62]. Such a method has been introduced in [63]. It relies on a transformation of the DEM image in order to produce a pseudo
Figure 3. Automatic localization of clods by wavelet-based method
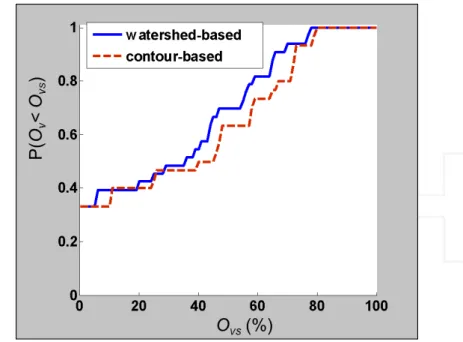
elevation image of greater dynamic to enhance the clods and on mixing information on heights and gradients so that the local minima correspond to clods bases. Figure 5 shows the cdf of overlap rates estimated for the contour-based and the watershed-based methods on a seedbed DEM.
The cdfs have the same value at the origin, showing that both methods have the same rates of false detected and not detected clods. The clods localization is all the better than the cdf is low. The watershed-based method cdf being higher than the contour-based one, it shows that, for this surface, the classical image segmentation method does not perform better than the newly built method. However, it does not have the drawback of horizontal clods bases. Thus identifying clods and big aggregates on a millimeter DEM remains a complex problem. Also, a specific approach of contour moving based on the minimization of a cost function related to clods detection properties has been introduced [64]. Based on the characterization of clods, as recognizable structures presenting rather medium or high level values, with a high gradient on the edges and low height values on the boundary, we have defined four criteria, linked to heights and gradients again, that characterize the clod boundary. Contrary to [42], the hypothesis of a horizontal base does not exist anymore. The minimization is performed by a meta-heuristic inspired from the simulated annealing algorithm [65]. Let us notice that each identification method can be used to initialize the contour moving algorithm, however, until now, the results are better if the initial contours lay inside the reference boundaries. The overlap rates can be enhanced by up to 10%.
4. Modelling of soil characteristics
As clods and aggregates are irregular shaped objects, a way to define relevant indices in size and shape is representing them by a simple approached form which matches closely their horizontal and vertical extents. In numerical generation of soil surfaces, clods and aggregates are usually modelled by half circles [22] or half spheres [38] or part of spheroids [66] put onto a substrate which may be a plane surface, an exponentially correlated random surface, or a surface representing furrows. In [66], the spheroids are equal-sized and regularly placed on a square grid. In [38], an envelope-Boolean surface generation model was introduced, where half spheres were set onto a plane according to the desired statistic. Two artificial surfaces were manually created by distributing aggregates randomly on a plane. Then structuring elements were generated by a Poisson point process reproducing the occurrence of aggregates size classes. It was suggested that the use of other primary function than half-sphere, like ellipsoids, could improve the performance of the surface generation process. In [22], the soil surface is described as a substrate, modelled by a 1D profile of Gaussian distribution of heights, with an exponential autocorrelation, and clods, modelled by half circles, randomly and independently set onto the substrate. Size of clods and distance between them obey to statistical laws that are not estimated from observations.
The choice of a modelling shape is dependent on the type of soil considered in an experiment. In [67], soil compaction extent is described by a half-ellipse. In [20], it is proposed to fit an ellipse to clod horizontal boundary contour and a half cosine function to the height shape. A semi-ellipsoid can also be suitable to fit the height shape of clods and aggregates. Mathematical frame of these modelling is presented hereafter.
4.1. Equivalent ellipse modelling clod base contour
The equivalent ellipse denotes the best fitting ellipse of a plane closed contour. Let O be the barycentre of the considered clod, R = (Oxy) its barycentric reference and Re = (OXY) the inertia principal reference. Estimation of the three shape parameters (semi-major axis length a, semi-minor axis length b and orientation angle θ, (i.e. the angle between the major axis supported by (OX) and the horizontal axis supported by (Ox)) is based on the method of geometric moments [68]. The central second order moments in the barycentric refer‐ ence, where the summation extends over all the pixels located within the clod boundary contour are given by:
2 2 1 1 1 1 N , 1 N 1 N Ox i i xy i i i i i I y IOy x and I y x N = N = N = =
å
=å
=å
(4)in the barycentric reference, where the summation extends over all the pixels located within the clod boundary contour. Using these geometric moments, the length of the semi-axes (a,
1 2 1 tan ( ) ( ) 2 2 xy Oy Ox I k k N I I p q= - ± Î q - (5)
where only one orientation angle is kept so that θ varies within −π/2, π/2 interval, and:
2 2
1 2 Oxcos Oysin xysin2
m = I q+I q-I q (6)
2 2
2 2 Oxsin Oycos xysin2
m = I q+I q+I q (7) 1 2 max( , ) a= m m (8) 1 2 min( , ) b= m m (9)
4.2. Semi-arch of cosine modelling clod height shape
The height of the semi-arch of cosine hc is estimated by least squares minimization of the sum of squared residuals: 2 2 2 2 2 1 ( ) cos 2 c N i i i i b c i x y z x y h h a b p e = é æ öù ê ç ÷ú = - - + ê ç ÷ú è ø ë û
å
(10)where z, is the elevation at point (xi, yi) in barycentric reference, and hb the elevation of the clod base contour.
4.3. Half ellipsoid modelling clod height shape Parametric equation of half ellipsoid is:
( )
( )
( )
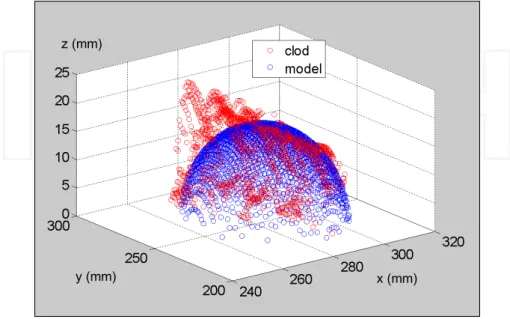
cos cos( ) cos sin( ) sin x a v u y b v u z h v ì = ï = í ï = î (11)with u ∈ −π, π and v ∈ 0, π / 2 , a and b semi axes of the equivalent ellipse and h, height of the half ellipsoid, that can be estimated by identifying the sum of squares of clod heights and the sum of squares of model heights, in order to keep the second order moment. An example of clod modelling is illustrated on figure 6.
Figure 6. Clod modelling by a half ellipsoid
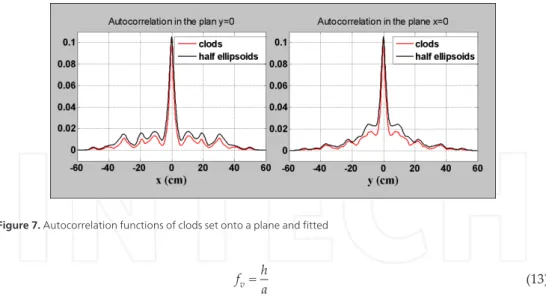
Extracting the identified clods and setting them onto a plane gives a surface with mainly the same autocorrelation function as the same surface where clods are replaced by their half ellipsoid model (see figure 7). This illustrates the goodness of fit, when modelling clods and big aggregates by half ellipsoids. Let us notice that the finite length of surfaces causes oscilla‐ tions in the autocorrelation functions.
4.4. Generation process
Analysis of DEM plots of a soil surface allows deriving the statistical distributions character‐ izing structuring object parameters. As an example, when analyzing a seedbed surface containing 350 clods, we find that the centers of gravity G and the orientation angles θ of big aggregates and clods can be assumed uniformly distributed. With the ellipsoid model, the variables a, b and h are not independent. Therefore intermediate variables have to be intro‐ duced, such as horizontal and vertical compression factors. They can be defined as follows:
h b
f a
v h
f a
= (13)
Using Pearson’s chi-squared tests of independence, we found a plausible independence of a and fh and of a and fv. Then, b and h would be derived from fh and fv using equations (12) and
(13).
Generating realistic numerical surfaces is expected for soil science studies as well as for numerical electromagnetic codes used in remote sensing studies. In order to generate a cloddy surface, several parameters have to be estimated:
• Number of objects (according to the desired density) No;
• Probability density functions (pdf) of a, fh and fv, θ and G;
• Shape of the substrate, where to put the structuring objects onto.
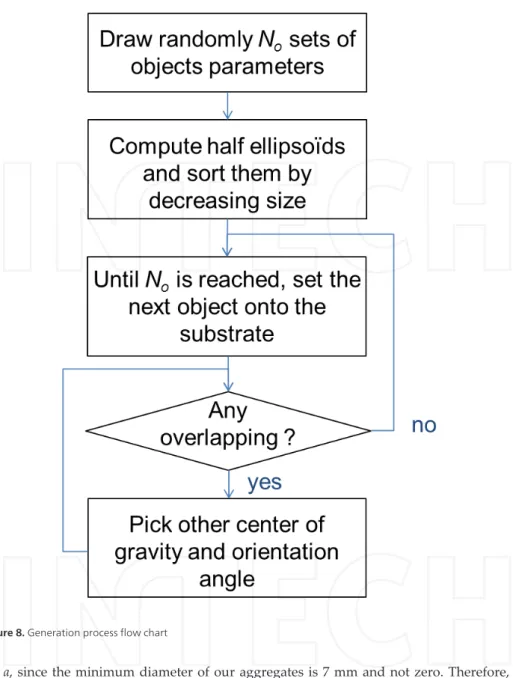
Then, the proposed generation process is composed of three main steps (see figure 8). First step is drawing randomly No sets of objects parameters. Variables a, fh and fv as well as θ
and G are drawn according to their pdf. Variables b and h are deduced from fh and fv using
equations (10) and (11). Second step is computing half ellipsoids and sorting them by decreas‐ ing size. Last step is setting each structuring object onto the chosen substrate only if it does not overlap with a former object; drawing another couple of center of gravity and orientation angle otherwise.
5. Results and discussion
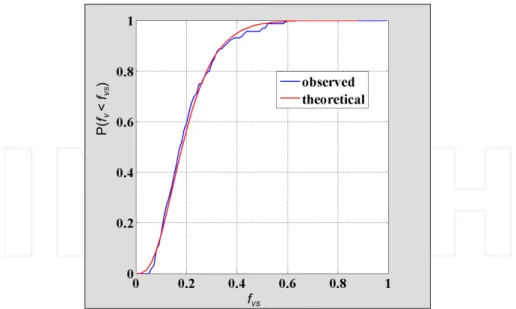
This generation process has been applied, until now, only on a natural freshly tilled seedbed surface. We estimated Gamma pdf for a and Bêta pdf for fh and fv. A correction has to be made
for a, since the minimum diameter of our aggregates is 7 mm and not zero. Therefore, the computing is performed with the translated variable a – amin, where amin designates the mini‐
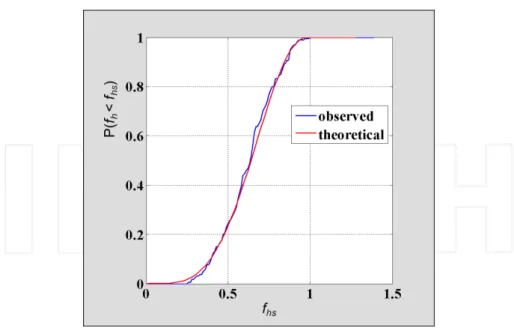
mum value of a. Figures 9 to 11 show the cdf of observed and modelled major semi-axis a and compression factors fh and fv. The small difference between the model and the data in each case,
less than 3%, confirms the theoretical distributions. The data modeling is also validated by Pearson’s chi-squared tests. Figure 12 shows a generated surface obtained by placing half ellipsoids onto a plane.
Figure 9. Cdf of half ellipsoid major semi-axis a fitted by Gamma function
Figure 11. Cdf of vertical compression factor fv fitted by Bêta function
Figure 12. Generated numerical surface
The generated soil surface on figure 12 is a simplified surface representing only some irregu‐ larities of the soil. Aggregates and clods cover about 30% of a surface. A more complex model would include also the holes or depressions and an appropriate substrate. The segmentation
methods presented in this chapter have the potential to detect also the holes. Characterization of a more realistic substrate than a plane is a complex problem that has not been solved until now.
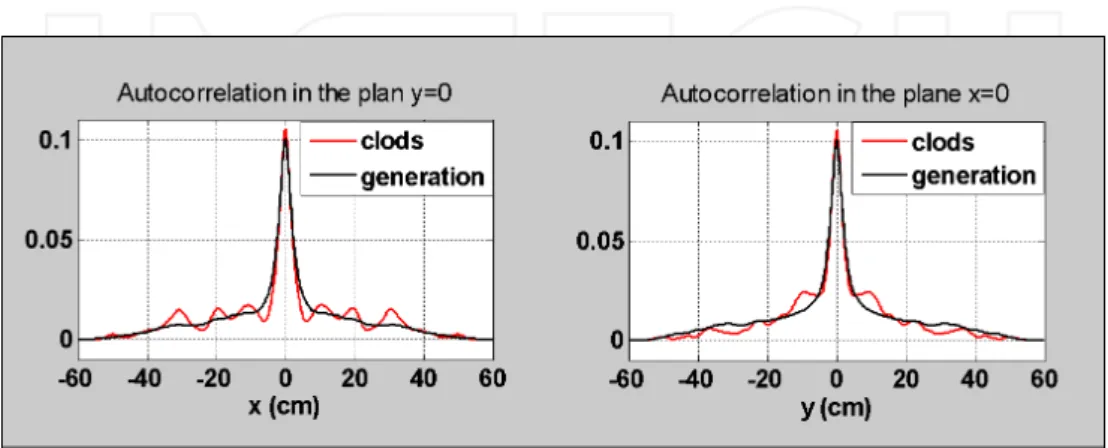
In order to validate the exposed generation process, the autocorrelation function of generated surface was compared to that of the surface obtained by setting the half ellipsoid modelling the automatically identified clods and aggregates of the seedbed surface under study onto a plane. Both autocorrelation functions can be seen on figure 13.
Figure 13. Autocorrelation functions of half ellipsoids set onto a plane by fitting detected clods or by generation proc‐
ess
One can see that the autocorrelation function of generated surface reproduces satisfactorily the shape of the autocorrelation function of the modeled clods set onto a plane, which is encouraging for future work. The black curve is a mean autocorrelation function, estimated on 15 realizations of generated surface. It has thus no more oscillations.
Recently, some authors have recalled the need to characterize the soil structure [69] or to define appropriate parameterization of the microtopography [70]. Addressing the arrangement of aggregates and clods contributes to these objectives. The proposed approach for modelling soil characteristics and generating soil surface is robust, as shown by the results. It relies on a geometric model of clods, which gives a physical basis to the characterization of surface microrelief. It represents also a progress in modelling compared to preceding works [22, 38, 66]. Future work should take into account soil depressions in relation to aggregates and clods.
6. Conclusion
Taking into account the structured elements when studying roughness effects is more and more brought into focus. The soil irregularities at millimeter or centimeter scales have an impact on hydrological processes, as they influence water outflow and infiltration rate. They have also an influence on remote sensing studies, by producing scattering and shadowing
effects. The proposed approaches in this chapter are detecting and characterizing some of the soil surface irregularities that are clods and big aggregates. Little studies were dedicated to this topic. For seedbed-type surfaces, a contour-based identification method enables to automatically retrieve the clods and big aggregates on a 3D DEM with a sensitivity of 75% and a specificity of 95%. Then modelling clods by semi-ellipsoïds is suitable and allows reproduc‐ ing the same autocorrelation function. The cdf of the semi-ellipsoïds parameters were fitted with relative errors less than 3%. Numerical soil surfaces were successfully generated by placing semi-ellipsoïds onto a plane, according to the statistical distributions. These recent works were applied to a limited number of soils and should be extended to more soils. Interest of a good surface roughness description is allowing generating realistic numerical surfaces. Such surfaces are then very useful for soil science studies as well as for electromagnetics codes used in remote sensing.
Author details
Edwige Vannier, Odile Taconet, Richard Dusséaux and Olivier Chimi-Chiadjeu
Université de Versailles Saint-Quentin en Yvelines, LATMOS/IPSL/CNRS, Guyancourt, France
References
[1] Holah N., Baghdadi N., Zribi M., Bruand A., King C. Potential of ASAR/ENVISAT for the characterization of soil surface parameters over bare agricultural fields. Re‐ mote Sens. Environ. 2005, 96: 78-86.
[2] Rahman M.M., Moran S.M., Thoma D.P., Bryant R., Sano E.E., Holifield Collins C.D, Skirvin S., Kershner C., B.J. Orr, A derivation of roughness correlation length for pa‐ rameterizing radar backscatter models. Int. J. Remote Sens. 2007, 28: 1907-1920. [3] Verhoest N.E.C., Lievens H., Wagner W., Alvarez-Mozos J., Moran M.S., Mattia F.
On the soil roughness parameterization problem in soil moisture retrieval of bare surfaces from Synthetic Aperture radar. Sensors. 2008, 8: 4213-4248.
[4] Lievens H., Verhoest N.E.C., De Keyser E., Vernieuwe H., Matgen P., Alvarez-Mozos J., De Baets B. Effective roughness modelling as a tool for soil moisture retrieval from C- and L-band SAR. Hydrology Earth System Sciences. 2009, 15: 151-162.
[5] Elfouhaily T.M., Guérin C.A. A critical survey of approximate scattering wave theo‐ ries from random rough surfaces. Waves Random Media. 2004, 14: R1-10.
[6] Warnick K.F., Chew, W.C. Numerical simulation methods for rough surface scatter‐ ing. Waves Random Media. 2001, 11: R1-R30.
[7] Saillard M., Sentennac, A. Rigorous solutions for electromagnetic scattering from rough surfaces. Waves Random Media. 2001, 11: R103-R137.
[8] Dusséaux, R., Aït Braham K., Granet G. Implementation and validation of the curvi‐ linear coordinate method for the scattering of electromagnetic waves from two-di‐ mensional dielectric random rough surfaces. Waves Random Complex Media. 2008, 18: 551-570.
[9] Dusséaux R., Vannier E., Taconet O., Granet G. Study of backscatter signature for seedbed surface evolution under rainfall ― Influence of radar precision. Progress in Electromagnetics Research 2012 ; 125: 415-437.
[10] Thorsos E.I., Jackson D.R., The validity of the perturbation approximation for rough surface scattering using a Gaussian roughness spectrum. J. Acoust. Soc. Am. 1989, 86: 261-277.
[11] Beckmann P., Spizzichino A. The Scattering of Electromagnetic Waves from Rough Surfaces. 1963. Pergamon, New-York.
[12] Thorsos, E.I.The validity of the Kirchhoff approximation for rough surface scattering using a Gaussian roughness spectrum, J. Acoust. Soc. Am. A. 1988, 82: 78-92.
[13] Voronovich G. Wave Scattering from Rough Surfaces. 1994. Springer, Berlin.
[14] Fung A. K. Microwave scattering and emission models and their applications. 1994. Artech House, Boston.
[15] Taconet O., Ciarletti V. Estimating soil roughness indices on a ridge-and-furrow sur‐ face using stereo photogrammetric. Soil and Tillage Research 2007; 93: 64-76.
[16] Chimi O., Caractérisation probabiliste et synthèse de surfaces agricoles par objets structurants à partir d’images haute résolution. PhD thesis. Univerty of Versailles Saint-Quentin en Yvelines. 2012
[17] Mattia F. Coherent and incoherent scattering from tilled soil surfaces. Waves Ran‐ dom Complex Media. 2011, 21: 278-300.
[18] Franceschetti G., Migliaccio M., Riccio D. An electromagnetic fractal-based model for the study of fading. Radio Sci. 1996, 31: 1749–1759.
[19] Guérin C.A., Holschneider M., Saillard M. Electromagnetic scattering from multi-scale rough surfaces. Wave Random Media 1997: 331-349.
[20] Taconet O., Dusséaux R., Vannier E., Chimi-Chiadjeu O. Statistical description of seedbed cloddiness by structuring objects using digital elevation models. Computers and Geosciences 2013; 60: 117-125.
[21] Tsang L., Kong J.A., Ding K.H., Ao C.O. Scattering of electromagnetic waves – Nu‐ merical Simulations. Wiley-Interscience, New York: 2001.
[22] Zribi M., Le Morvan A., Dechambre M., Baghdadi N. Numerical backscattering anal‐ ysis for rough surfaces including a cloddy structure. IEEE Transaction Geosciences Remote Sensing 2010; 48 (5): 2367-2374.
[23] Currence H. D., Lovely W. G. The analysis of soil surface roughness. Transaction ASAE 1970; 13: 710-714.
[24] Römkens M.J.M., Wang, J.Y. Effect of tillage on surface roughness. Transactions of the American Society of Agricultural Engineers 1986; 29: 429-433.
[25] Bertuzzi P., Rauws G., Courault D. Testing roughness indices to estimate soil rough‐ ness changes due to simulated rainfall. Soil and Tillage Research 1990; 17: 87-99. [26] Helming K., Roth C. H., Wolf R., Diestel H. Characterization of rainfall-microrelief
interactions with runoff using parameters derived from digital elevation model (DEMs). Soil Technology 1993; 6: 273-286.
[27] Takken I., Govers G. Hydraulics of interrill overland flow on rough, bare soil surfa‐ ces. Earth Surface Processes and Landforms 2000; 25: 1387-1402.
[28] Darboux F., Davy P., Gascuel-Odoux C., Huang C. Evolution of soil surface rough‐ ness and flowpath connectivity in overland flow experiments. Catena 2001; 46: 125-139.
[29] Zribi M., Dechambre M. A new empirical model to retrieve soil moisture and rough‐ ness from C-band radar data. Remote sensing of environnement 2002; 84: 42-52. [30] Blaes X., Defourny P. Characterizing bidimensional roughness of agricultural soil
surfaces for SAR modelling. IEEE Transactions on geoscience and remote sensing 2008; 46: 4050-4061.
[31] Croft H., Anderson K., Kuhn N.J. Reflectance anisotropy for measuring soil surface roughness of multiple soil types. Catena 2012; 93: 87-96.
[32] Huang C., Bradford J.M. Application of a laser scanner to quantify soil microtopogra‐ phy. Soil Science Society of America Journal 1992; 56: 14-21.
[33] Vidal Vázquez E., Vivas Miranda J.G., Paz González A. Characterizing anisotropy and heterogeneity of soil surface microtopography using fractal models. Ecological Modelling 2005 ; 182: 337-353.
[34] Vidal Vázquez E., García Moreno R., Miranda J. G. V., Díaz M.C., Saa Requejo A., Paz Ferreiro J., Tarquis A.M. Assessing soil surface roughness decay during simulat‐ ed rainfall by multifractal analysis. Nonlinear Processes in Geophysics 2008; 15: 457-468.
[35] Moldenhauer W.C. Influence of rainfall energy on soil loss and infiltration rates: II. Effect of clod size distribution. Soil Science Society of America Journal 1970; 34: 673– 677.
[36] Ambassa-Kiki R., Lal R. Surface clod size distribution as a factor influencing soil ero‐ sion under simulated rain. Soil and Tillage Research 1992; 22: 311-322.
[37] Sandri R., Anken T., Hilfiker T., Sartori L., Bollhalder H. Comparison of methods for determining cloddiness in seedbed preparation. Soil and Tillage Research 1998; 45: 75–90.
[38] Kamphorst E.C., Chadœuf J., Jetten V., Guérif J. Generating 3D soil surfaces from 2D height measurements to determine depression storage. Catena 2005; 62: 189-205. [39] Arvidsson J., Bölenius E. Effects of soil water content during primary tillage - laser
measurements of soil surface changes. Soil and Tillage Research 2006; 90: 222–229. [40] Keller T., Arvidsson J., Dexter A.R. Soil structures produced by tillage as affected by
soil water content and the physical quality of soil. Soil Tillage Research 2007; 92: 45-52.
[41] Vannier E., Ciarletti V., Darboux F. Wavelet-based detection of clods on a soil sur‐ face. Computers and Geosciences 2009 ; 35: 2259-2267.
[42] Taconet O., Vannier E., Le Hégarat-Mascle S. A boundary-based approach for clods identification and characterization on a soil surface. Soil Tillage Research 2010 ; 109: 123-132.
[43] Borselli L., Torri D. Soil roughness, slope and surface storage relationship for imper‐ vious areas. Journal of Hydrology 2010; 393: 389-400.
[44] Merrill D. Comments on the chain method for measuring soil surface roughness: use of the chain set. Soil Science Society American Journal 1998; 62: 1147-1149.
[45] Planchon O., Esteves M., Silvera N., Lapetite J. Microrelief induced by tillage : meas‐ urement and modelling of surface storage capacity. Catena 2001; 46: 141-157.
[46] Guzha A.C. Effects of tillage on soil microrelief, surface depression storage and soil water storage. Soil and Tillage Research 2004; 76: 105-114.
[47] Brasington J., Smart R.M.A. Close range digital photogrammetric analysis of experi‐ mental drainage basin evolution. Earth Surface Processes and Landforms 2003; 28: 231-247.
[48] Rieke-Zapp D., Nearing M.A. Digital close range photogrammetry for measurement of soil erosion. Photogrammetric Record 2005; 20 (109): 69-87.
[49] Abd Elbasit M.A.M., Anyoji H., Yasuda H., Yamamoto S. Potential of low cost close-range photogrammetry system in soil microtopography quantification. Hydrological Processes 2009; 23: 1408–1417.
[50] Bretar F., Arab-Sedze M., Champion J., Pierrot-Deseilligny M., Heggy E., Jacque‐ moud S. An advanced photogrammetric method to measure surface roughness : ap‐
plication to volcanic terrains in the Piton de la Fournaise, Reunion Island. Remote Sensing of Environment 2013 ; 135: 1-11.
[51] Helming K., Römkens M.J.M., Prasad S.N. Surface roughness related processes of runoff and soil loss: a flume study. Soil Science Society of America Journal 1998; 62: 243-250.
[52] Darboux F., Huang C. An instantaneous-profile laser scanner to measure soil surface microtopography. Soil Science Society America Journal 2003; 67: 92-99.
[53] Zhixiong L., Nan C., Perdok U.D., Hoogmoed W.B. Characterization of soil profile roughness. Biosystem Engineering 2005; 91: 369-377.
[54] Frede H.-G., Gäth S. Soil surface roughness as the result of aggregate size distribu‐ tion 1. Report: measuring and evaluation method. Pflanzenernaehr. Bodenk. 1995; 158: 31-55.
[55] Jester W., Klik A. Soil surface roughness measurement- methods, applicability and surface representation. Catena 2005; 64: 174-192.
[56] Aguilar M.A., Aguilar F.J., Negreiros J. Off-the-shelf laser scanning and close-range digital photogrammetry for measuring agricultural soils microrelief. Biosystem Engi‐ neering 2009; 103: 504-517.
[57] Marzahn P., Ludwig R. On the derivation of soil surface roughness from multi para‐ metric PolSAR data and ist potential for hydrological modelling: Hydrology Earth System Sciences 2009; 13: 381-394.
[58] Vulfson L., Genis A., Blumberg D.G., Sprintsin M., Kotlyar A., Freilikher V., Ben-Asher J. Retrieval of surface roughness parameters of bare soil from the radar satel‐ lite data. Journal of Arid Environments 2012; 87: 77-84.
[59] Lievens H., Verhoest N.E.C. Spatial and temporal soil moisture estimation from RA‐ DARSAT-2 imagery over Flevoland, the Netherlands. Journal of Hydrology 2012; 456-457: 44-56.
[60] Chimi-Chiadjeu O., Vannier E., Dusséaux R., Taconet O. Influence of gradient esti‐ mation on clod identification on seedbed digital elevation model. Environmental & Engineering Geoscience 2011; 17: 337-352.
[61] Fawcett T. ROC Graphs: Notes and Practical Considerations for Researchers. Techni‐ cal Report. HP Laboratories, Palo Alto 2004, USA.
[62] Beucher S., Meyer F. The morphological approach to segmentation: the watershed transformation. In: E. R. Dougherty (ed) Mathematical Morphology in Image Proc‐ essing. 1993. p433–481.
[63] Chimi-Chiadjeu O., Vannier E., Dusséaux R., Le Hégarat-Mascle S., Taconet O. Seg‐ mentation of elevation images based on a mathematical morphology approach for
agricultural clod detection: proceedings of 5th international congress on image and signal processing CISP 2012, Chongqing, China, 16-18 October 2012, 701-705.
[64] Chimi-Chiadjeu O., Vannier E., Dusséaux R., Le Hégarat-Mascle S., Taconet O. Using simulated annealing algorithm to move clod boundaries on seedbed digital elevation model. Computers & Geosciences 2013 ; 57: 68-76.
[65] Kim Y.H., Rana S., Wise S. Exploring multiple viewshed analysis using terrain fea‐ tures and optimisation techniques. Computer & Geosciences 2004; 30 : 1019–1032. [66] Cierniewski J., Verbrugghe M., Marlewski A. Effects of farming works on soil surface
bidirectional reflectance measurements and modelling. International Journal of Re‐ mote Sensing 2002 ; 23 (6): 1075-1094.
[67] Richard G., Boizard H., Roger-Estrade J., Boiffin J., Guérif J. Field study of soil com‐ paction due to traffic in northen France: pore space and morphological analysis of the compacted zones. Soil and Tillage Research 1999; 51: 151-160.
[68] Feral L., Mesnard F., Sauvageot H., Castanet L., Lemorton J. Rain cells shape and ori‐ entation distribution in south-west of France. Physics and Chemistry of the Earth, Part B: Hydrology, Oceans and Atmosphere 2000; 25 (10): 1073-1078.
[69] Roger-Estrade J., Richard G., Caneill J., Boizard H., Coquet Y., Defossez P., Manichon H. Morphological caracterisation of soil structure in tilled fields: from a diagnosis method to the modeling of structural changes over time. Soil and Tillage Research 2004; 79: 33-49.
[70] Martin Y., Valeo C., Tait M. Centimetre-scale digital representations of terrain and impacts on depression storage and runoff. Catena 2008; 75: 223-233.