HAL Id: hal-01818602
https://hal.archives-ouvertes.fr/hal-01818602
Submitted on 13 Mar 2019
HAL is a multi-disciplinary open access
archive for the deposit and dissemination of
sci-entific research documents, whether they are
pub-lished or not. The documents may come from
teaching and research institutions in France or
abroad, or from public or private research centers.
L’archive ouverte pluridisciplinaire HAL, est
destinée au dépôt et à la diffusion de documents
scientifiques de niveau recherche, publiés ou non,
émanant des établissements d’enseignement et de
recherche français ou étrangers, des laboratoires
publics ou privés.
Cost-effective computational method for radiation heat
transfer in semi-crystalline polymers
Sinan Boztepe, Rémi Gilblas, Olivier de Almeida, Yannick Le Maoult, Fabrice
Schmidt
To cite this version:
Sinan Boztepe, Rémi Gilblas, Olivier de Almeida, Yannick Le Maoult, Fabrice Schmidt. Cost-effective
computational method for radiation heat transfer in semi-crystalline polymers. ESAFORM 2018 - 21st
International ESAFORM Conference on Material Forming, Apr 2018, Palermo, Italy. pp.art.120005,
�10.1063/1.5034973�. �hal-01818602�
Cost-Effective Computational Method for Radiation Heat
Transfer in Semi-Crystalline Polymers
Sinan Boztepe
1,a, Rémi Gilblas
1,b,
Olivier de Almeida
1,c, Yannick Le Maoult
1,dand
Fabrice Schmidt
1,e11 Université de Toulouse ; IMT Mines Albi, ICA (Institut Clément Ader) ; Campus Jarlard, F-81013 Albi cedex 09, France.
a)[email protected] b)[email protected] c)[email protected] d)[email protected] e)[email protected]
Abstract. This paper introduces a cost-effective numerical model for infrared (IR) heating of semi-crystalline polymers.
For the numerical and experimental studies presented here semi-crystalline polyethylene (PE) was used. The optical properties of PE were experimentally analyzed under varying temperature and the obtained results were used as input in the numerical studies. The model was built based on optically homogeneous medium assumption whereas the strong variation in the thermo-optical properties of semi-crystalline PE under heating was taken into account. Thus, the change in the amount radiative energy absorbed by the PE medium was introduced in the model induced by its temperature-dependent thermo-optical properties. The computational study was carried out considering an iterative closed-loop computation, where the absorbed radiation was computed using an inhouse developed radiation heat transfer algorithm -RAYHEAT- and the computed results was transferred into the commercial software -COMSOL Multiphysics- for solving transient heat transfer problem to predict temperature field. The predicted temperature field was used to iterate the thermo-optical properties of PE that varies under heating. In order to analyze the accuracy of the numerical model experimental analyses were carried out performing IR-thermographic measurements during the heating of the PE plate. The applicability of the model in terms of computational cost, number of numerical input and accuracy was highlighted.
INTRODUCTION
In terms of modeling the radiation heat transfer in optically heterogeneous media, numerous examples of modelling approaches exist in literature that adopt well-known optical scattering theories, such as Rayleigh-Debye-Gans [1] or Mie [2,3] theory which allows to predict the spatial distribution of the scattered light intensity accurately. However, such radiation heat transfer models that handle complex radiation physics may be computationally costly, especially if spectral or geometrical complexity in a heated component is involved [4]. In contrast to laser heating applications, the radiation emitted by an IR source and transferred through a polymer medium is not monochromatic, but in a range, which introduces such a complexity in terms of modeling of optical scattering, as the scattering behavior may change under varying wavelength in the spectral range of emitted radiation. Such a wavelength-dependent scattering behavior in semi-crystalline polymers was discussed in [5,6].
Apart from the computational cost due to spectral complexity of IR radiation, the strong coupling between the microcrystalline structure of unfilled semi-crystalline thermoplastics and their optical scattering behavior may also increase the complexity of a numerical approach, and thus computational cost. It is known that optical scattering in semi-crystalline polymers are strongly related to their microcrystalline structure where the optical scattering behavior may evolve under heating, due to a potential change in their microcrystalline phase at the temperatures close to their melting ranges. It may therefore be useful to adopt a numerical model that considers this temperature-dependent optical behavior. Potente et al [7] proposed temperature-temperature-dependent optical properties for semi-crystalline polypropylene (PP), named as “effective absorption constant“. However the temperature dependency in absorption characteristics of PP was modeled based on the change in the density of the polymer in the corresponding temperature range, so that it lacks the physical background due to no experimental characterization on its optical properties was performed. Similarly, temperature-dependent absorption properties were introduced as a numerical
input for laser transmission welding (LTW) process simulations of short glass fiber filled and unfilled PP and PA6 in [8] whereas the behavior about the absorption characteristics under varying temperature was not highlighted.
In this paper, a cost-effective numerical approach was proposed for unfilled semi-crystalline thermoplastics considering the dependent behavior in their optical characteristics. For the study, temperature-dependent directional-hemispherical transmittance (Tλi, (T)) and reflectance (Rλi, (T)) of semi-crystalline PE was
experimentally analyzed considering different temperatures between 25oC and 128oC. Assuming an optically
homogeneous medium, the measured Tλ i, (T) and Rλ i, (T) were used to calculate the temperature-dependent
extinction coefficient (βλ (T)), which considers an evolution in the optical characteristics of PE under heating
condition. The calculated βλ (T) were then used as numerical input so that the temperature-dependency of absorbed
radiative energy by the PE medium was taken into account in the model. The computational study was carried out considering an iterative closedloop computation, using an inhouse developed radiation heat transfer algorithm -RAYHEAT- and the commercial software -COMSOL Multiphysics- where the closed-loop iterations was established using MATLAB LiveLink. In order to analyze the accuracy of the numerical model experimental analyses were carried out performing IR-thermographic measurements for the case of IR-heating of the PE plate. The model developed here proposes a numerical approach to consider the optical scattering and its effect under heating condition indirectly that is governed by microcrystalline morphology. In other words, the effect of optical scattering on the optical characteristics of semi-crystalline PE was taken into account without modeling the spatial distribution of the scattered light intensity which offers computationally cost-effective numerical solutions.
TEMPERATURE DEPENDENCY IN THE THERMO-OPTICAL PROPERTIES OF
SEMI-CRYSTALLINE POLYMERS
The Tλi, (T) and Rλi, (T) tests were done over the spectrums of 0.25-2.5μm and 2-25μm using PE samples in
three different thicknesses. All the samples were quenched into liquid nitrogen (LN2). The details of the sample
preparation is presented in [5]. Tλi, (T) and Rλ i, (T) of each PE sample were measured at various temperature
steps, between 25oC and 128oC. The T
λi, (T) tests were performed employing FT-IR spectrometer (Perkin Elmer
950) combined with an integrating sphere. For the tests, a heating stage (Bruker A599) was positioned at the entrance port of the integrating sphere, so that the samples were mounted into the heating stage and their Tλi, (T)
were measured. For the measurement at each step, the samples were heated up and waited for 2 minutes in order to reach a steady-state temperature. In total, Tλi, (T) of each PE sample was measured at 14 different temperature
points. Similarly, for each PE sample, Rλi, (T) measurements were performed at 10 different temperature steps.
The Rλi, (T) tests were done employing SOC-100 model Hemispherical Directional Reflectometer (HDR) built by
Surface Optics Corporation. For these tests, the samples were heated using the heating unit of the SOC-100 HDR. Details of the PE samples and the temperature steps of the tests are presented in Table 1.
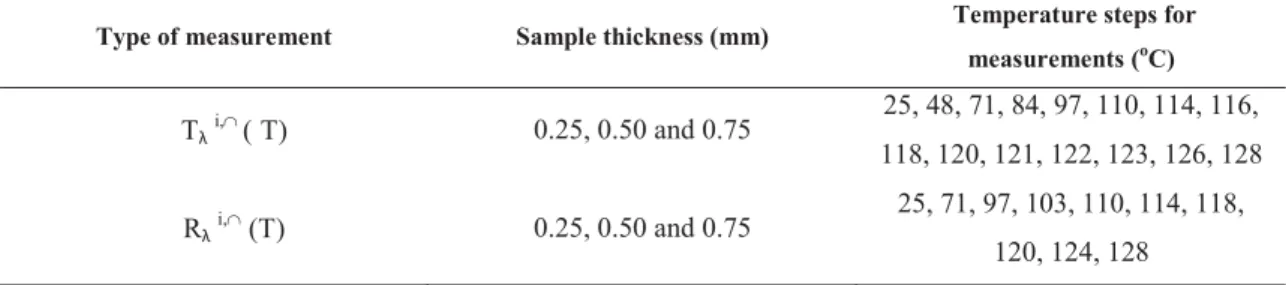
TABLE 1. The PE samples and the testing characteristics of the Tλi, (T) and Rλi, (T) tests
Type of measurement Sample thickness (mm) Temperature steps for measurements (oC) Tλi, (T) 0.25, 0.50 and 0.75 25, 48, 71, 84, 97, 110, 114, 116, 118, 120, 121, 122, 123, 126, 128 Rλi, (T) 0.25, 0.50 and 0.75 25, 71, 97, 103, 110, 114, 118, 120, 124, 128
It should be noted that the temperature steps mentioned in Table 1 represent the actual temperature on the sample surface where the measurements were obtained. In other words, it was observed that the set temperature on the heating devices that were used in Tλi, (T) and Rλi, (T) tests and the actual temperature on the measurement zone
are different. Therefore, preliminary tests were done in order to determine the actual temperature on the measurement zone. The actual temperatures adopted in the Rλi, (T) tests were determined using identically thick
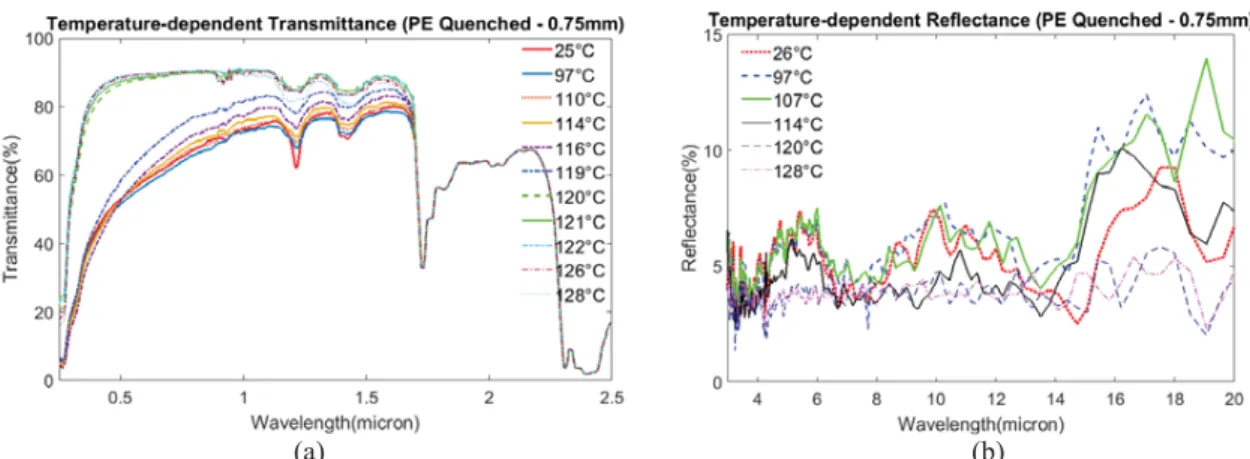
dummy PE samples on the heating unit of SOC-100 HDR. In addition, the details of the preliminary tests for the transmittance measurements is revealed in [9] . In Fig. 1(a) and (b), the typical trend obtained in each Tλi, (T) and
Rλ i, (T) tests were presented respectively. It is seen in Fig. 1(a) that the Tλ i, of the 0.75 mm thick sample
the melting range of the polymer [5]. It should also be mentioned that no significant change was observed in Tλi,
for the wavelengths greater than 1.7 μm, where also a significant noise was detected during the measurements at high temperatures. It was thus assumed that Tλ i, remains unchanged under heating considering the spectrum
between 1.7 and 2.5 μm. In contrast to the trend in Tλi, (T), there is an inverse relation between the Rλi, of PE and
temperature. As shown in Fig. 1(b), the temperature change is less effective on the reflectance properties of PE in comparison to its temperature-dependent transmittance. For the sake of clarity in the trends observed at both the Tλ i, (T) and R
λi, (T), certain number of data are presented in Fig. 1(a) and (b).
(a) (b)
FIGURE 1. Typical trend obtained in Tλi, Rλi, measurements of PE polymer under varying temperature
As our previous studies [5,10] showed that the strong coupling between microcrystalline morphology and the transmittance characteristics of PE becomes negligible in MIR range (2-25μm), no temperature dependency was assumed for transmittance characteristics of PE in MIR range. Hence, Tλi, of the identical PE samples measured at
room temperature was adopted for this range. Conversely, no temperature-dependent measurements were able to be obtained for the reflectance measurement considering the wavelengths lower than 2 μm, due to the limitations in the testing devices employed and the spectral responses of their detectors. It was therefore assumed that reflectance characteristics of PE are independent of temperature. Although this is not a rigorous assumption, further analyses on the PE samples prepared with different microcrystalline structure were tested at room temperature and a slight effect of the microcrystalline morphology on the reflectance was observed. It may therefore be stated that the reflectance behavior of PE may not change dramatically in case that a change in its microcrystalline structure under varying temperature is seen. Based on the measured Tλ i, (T), Rλ i, (T) and the adopted assumptions, βλ (T) of PE was
calculated considering an optically homogeneous medium. Using the transmittance and the reflectance characteristics of an optically homogeneous medium, it may be possible to define the βλ [11]. Hence, βλ may be
calculated for each adopted temperature step that eventually leads to:
Aλ i, (T)+ Tλi, (T)+ Rλi, (T)= 1 with; (1) 2 2 ) ( 1 ) 1 ( ) ( i, T T and 2 2 2 2 ) ( 1 ) 1 ( 1 ) ( i, T R (2)
The computation of βλ at each temperature step was carried out in MATLAB, adopting an inverse method based
on SQP (Sequential Quadratic Programming) estimation algorithm, so that the equation 2 was solved for computing ρλ and τλ values, and eventually βλ. The background of this in-house developed estimation algorithm is explained
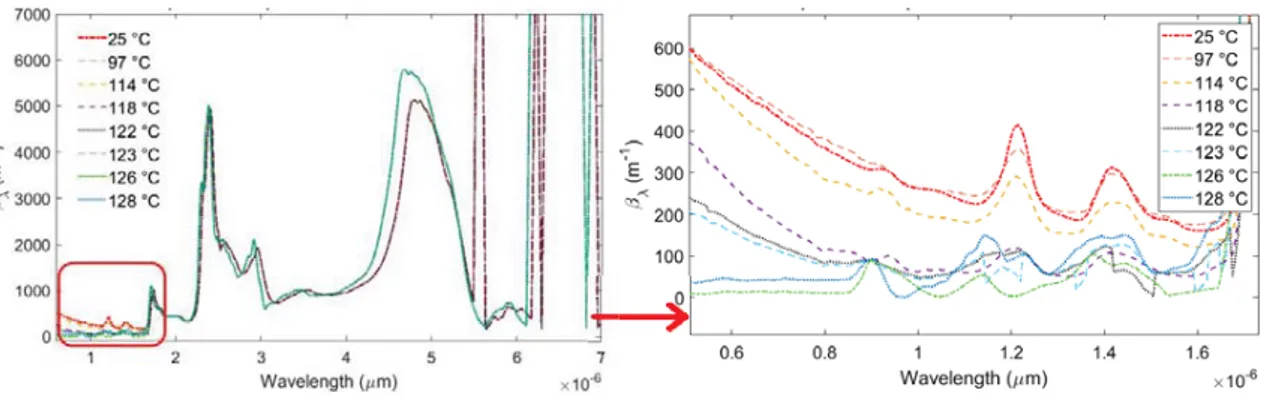
further in [12]. In Fig. 2, the computed βλ (T) values are presented considering the spectrum between 0.6-7μm.
Again, for the sake of clarity, some of the computed values are not presented in the figure. Furthermore, the drop in βλ under heating is illustrated further in the figure at right, including the spectrum between 0.6-1.6 μm. This may be
plausible, as the change in the Tλ i, (T) values is significant in this spectrum. Apart from this, it is clear that the
trend in βλ (T) is monotonically decreasing under heating, except the computed βλ at 128 oC. This is due to the fact
that a slight drop in Tλi, were observed for all the PE samples after the measurement at 126 oC, which resulted to
have slightly higher βλ computed at 128 oC, in comparison to the computed one at 126 oC. This behavior was also
observed in our previous study [9], which can be attributed to disintegration of polymer at semi-molten state, and therefore potential thickening in the measurement zone of the vertically positioned sample. Because of this limitation in Tλi, (T) tests, the calculated extinction coefficient at 128 oC is ignored in this study. Hence the βλ (T)
FIGURE 2. βλ (T)of PE polymer between room temperature and 128 oC
RADIATION HEAT TRANSFER MODELING APPROACH WITH
TEMPERATURE-DEPENDENT OPTICAL PROPERTIES AND EXPERIMENTAL COMPARISONS
Background of the numerical model
As aforementioned, the computational study was carried out considering an iterative closed-loop computation, where the absorbed radiation was computed using in-house developed algorithm, RAYHEAT, and transferred into COMSOL. The current version of RAYHEAT is based on optically homogeneous medium assumption, hence, attenuation of radiative energy is computed adopting Beer-Lambert Law, as shown in Equation 3 [11]. The further details about RAYHEAT, including ray tracing method, and discretization of emitted rays can be found in [13].
) ( )) ( ) ( ( ) ( ) (z I z z D z I z dz dI (3)
The absorbed energy, namely radiative source term ( qr), at the depth “z” of a heated medium can be defined in
Equation 4, at which βλ is the sum of both absorption (κλ) and scattering coefficients (Dλ):
0 0 ( ) ( ) (0) ( ) (0) r z D z q z I e d D I e d (4)
FIGURE 3. Working algorithm of the developed numerical model
In order to take into account βλ (T) as a numerical input in the model, a close-loop iterative approach was
developed. The working algorithm of the model is displayed schematically in Fig. 3. As RAYHEAT is a MATLAB-based code, the iterative closed-loop between RAYHEAT and COMSOL was established using MATLAB LiveLink feature which allows to transfer the computed qr into COMSOL as a numerical input, solves the transient heat
transfer problem to predict the temperature field and calls back RAYHEAT for updating the qr of polymer
medium regarding the computed temperature at the end of the corresponding iteration step. By this way, the transient heat transfer equation solved for the IR-heating of PE is formulized as:
p r
C k q x y z
t (5)
Therefore, the change in the amount of radiative energy absorbed by the PE medium - which is a function of the temperature and the spatial coordinates of the modeled mesh element-, is introduced in the model. The computation time for qr was discussed in [13] in terms of number of rays, mesh element and geometrical calculation of modeled
rays. In order to reduce the computation cost, the radiative energy that may be absorbed by each modeled 3D mesh element was computed considering the calculated βλ (T) at 13 different temperature steps and saved before starting
the iterative closed-loop temperature field computations. In the model, if a computed temperature in a mesh element is between these 13 steps, the numerical model qr interpolates regarding the qr of the 2 most close temperature
steps. Otherwise the model adopts the qr of 126 °C, for the mesh element temperatures higher than 126°C.
Experimental - numerical comparisons for IR-heating of PE plate
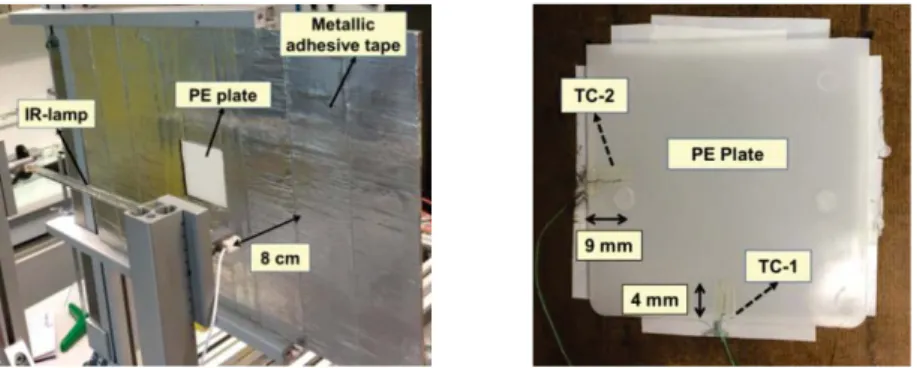
The accuracy of the developed model was analyzed performing an IR-heating test using a rectangular PE plate with dimensions of 78x78x2.2 mm. The plate was heated with a single IR-lamp (1kW) at which 100% of its total power input was utilized. The front surface of the PE plate was positioned 8cm away from the IR-lamp.
FIGURE 4. Test setup for IR-heating of PE plate (left) and the positions of mounted thermocouples on the back surface (right) In Fig. 4, the test setup for IR-heating of PE plate is presented at left. As it is seen on that figure, a plate-like barrier is positioned in front the IR-lamp where a small frame (70x70mm) is designed for positioning the PE plate. In addition, the front surface of the barrier is covered with metallic adhesive tape in order to avoid heating on the barrier, otherwise conduction heat transfer between the barrier and the PE plate may cause an erroneous temperature measurement. The reason for using a barrier is to perform an IR-thermographic measurement on the back surface of the PE plate, as some of the emitted radiation from IR-lamp may directly reach to the IR-camera and cause noise. For the surface temperature measurements, two thermocouples (TC) were also positioned on the back surface of the plate for comparing their recordings with the IR-thermography. The TC recordings and the IR-heating of the plate were started simultaneously and, it was observed that the temperature on the back surface became steady-state after 600 seconds where also an IR-thermography was taken. Due to the limitations in the IR-thermography of PE that are stressed in [14], the measurement was obtained when the temperature of the plate was at steady-state.
The boundary conditions of the numerical model were built adopting the identical conditions as applied in the experimental test setup. In the model, the plate geometry was meshed with 4232 linear hexagonal elements, and the temperature of each mesh element was calculated as the average temperature of its nodes’ temperatures. In the current study, the barrier around the PE plate was not modeled. Based on the findings from the experimental study, heating of the plate up to 600 seconds was simulated using 1500000 rays. The computation of the simulation took around 10 and 55 minutes for the computations of geometrical optics, and the qr (T), respectively. In Fig. 5,
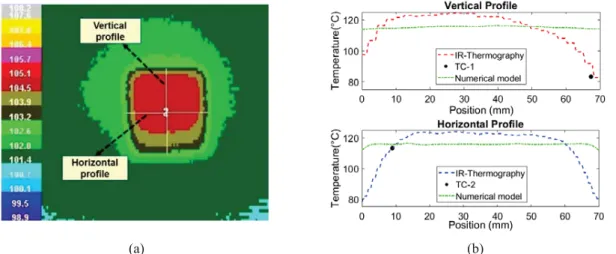
IR-thermography of the plate scaled in radiometric values (UI) (a) and, the comparisons between the temperature profiles obtained from the experimental measurements and the numerical studies (b) are presented. The UI values obtained in the IR-thermography was converted into temperature using the methodology in [14]. As displayed in Fig. 5(b), the predicted surface temperature is close (around 3 °C difference) in the middle zone of the plate regarding the numerically and experimentally defined vertical and horizontal profiles. Conversely, the difference between both the analyses becomes significantly great considering the zones close to the edge of the plate for both
the horizontal and vertical profiles. This may be attributed to ignorance of heat losses due to conduction between the barrier and PE plate as the barrier around the plate was not modeled. In addition, the convergence studies for the number of modeled rays were not performed at this step which may change the final temperature field predictions.
(a) (b)
FIGURE 5. IR-thermography taken at steady-state temperature (a) and the back surface temperature of PE plate obtained via
numerical and experimental analyses (b)
CONCLUSIONS
The model presented in this study proposes a numerical approach to consider the optical scattering and the change in its behavior under heating condition indirectly, without modeling how the light scatters inside of polymer medium. In other words, the effect of optical scattering on the optical characteristics of semi-crystalline PE was taken into account without modeling the spatial distribution of the scattered light intensity which offers computationally cost-effective numerical solutions. The change in the directional-hemispherical optical characteristics of PE under heating conditions were experimentally analyzed and, it was demonstrated especially in the temperature ranges close to the melting range of PE and eventually used as numerical input. In this study, the experimental and numerical analyses showed that the model predicts the temperature closely in the middle zone of the PE plate, whereas there is a remarkable difference at regions close to the edge of the plate considering both the computed and measured surface temperature profiles defined on the normal and alongside to the IR-lamp. This may be attributed to ignorance of potential heat losses due to conduction between the barrier and PE plate as the barrier around the plate was not modeled in this study. In addition, the convergence studies for the number of modeled rays were not performed at this step which may cause to change the final temperature field predictions.
REFERENCES
1.
R. Apetz and M.P.B. Bruggen, J. Am. Ceram. Soc. 86, 480 (2003).2. M. Ilie, J.-C. Kneip, S. Matteï, A. Nichici, C. Roze, T. Girasole, Opt. Lasers Eng. 45, 405 (2007). 3. E. Berrocal, D.L. Sedarsky, M.E. Paciaroni, I.V. Meglinski, M.A. Linne, Opt.Express 15, 10649 (2007). 4. A. Humphrey, T. Harman, M. Berzins, and P. Smith, in Int. Conf. High Perf. Comput. (2015), pp.212-230. 5. S. Boztepe, R. Gilblas, O. de Almeida, C. Gerlach, Y. Le Maoult, F. Schmidt, Int. J. Mater. Form. (2017). 6. D.V. Tsu, M. Muehle, M. Becker, T. Schuelke, and J. Slagter, Surf. Coat. Technol. 336, 39 (2017). 7. F. Becker and H. Potente, Polym. Eng. Sci. 42, 365 (2002).
8. M. Devrient, X. Da, T. Frick, and M. Schmidt, Phys. Procedia 39, 117 (2012).
9. S. Boztepe, R. Gilblas, O. De Almeida, F. Schmidt, and Y. Le Maoult, in SFT 2017-Congrès Annu. Société
Fr. Therm. (2017).
10. S. Boztepe, A. Thiam, O. de Almeida, Y. Le Maoult, F. Schmidt, in 19th Int. ESAFORM Conf. on Mater.
Form. (2016).
11. J.R. Howell, M.P. Menguc, and R. Siegel, Thermal Radiation Heat Transfer, 6th Ed. (CRC Press, 2015).
12. A.C.A. Asséko, B. Cosson, F. Schmidt, Y.L. Maoult, E. Lafranche, Infrared Phys.Technol. 72, 293 (2015). 13. B. Cosson, F. Schmidt, Y. Le Maoult, and M. Bordival, Int. J. Mater. Form. 4, 1 (2011)
14. S. Boztepe, R. Gilblas, O. de Almeida, Y. Le Maoult, F. Schmidt, in 20th Int. ESAFORM Conf. on Mater.
![[PDF] Cours et exemple UML | Télécharger PDF](data:image/gif;base64,R0lGODlhAQABAIAAAP///wAAACH5BAEAAAAALAAAAAABAAEAAAICRAEAOw==)